
Why Interest Rates Impact Some Stocks More Than Others
After better-than-expected US inflation reports this week, investors wasted little time sending the market higher. Technology stocks led the way, while many defensive sectors posted more modest gains. The reason comes down to a term you’ll often hear in investing: rate-sensitive stocks.
In other words, changes in interest rates don’t affect all stocks equally – they affect some more than others. A rate-sensitive stock is simply one whose share price tends to react more than the overall market when interest rates – or expectations for them – change. The infographic below shows why.
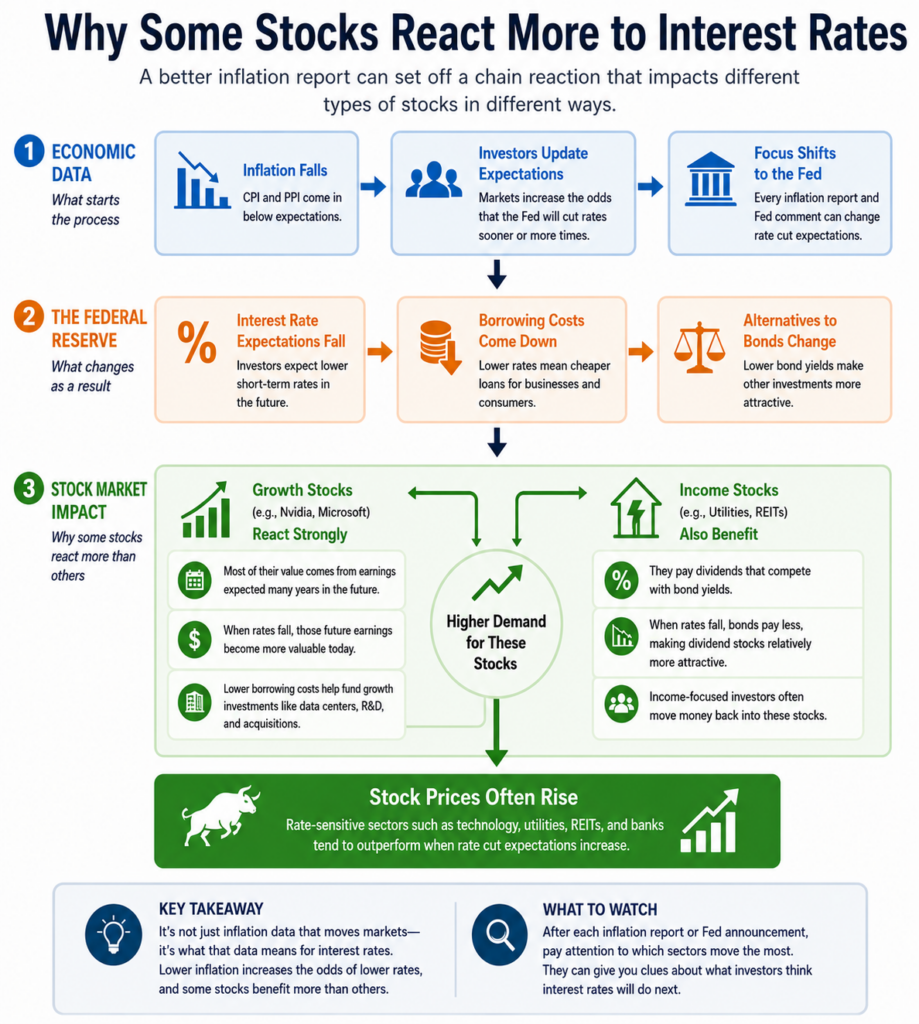
Figure 1: Why Some Stocks React More to Interest Rates
Growth Stocks: Betting on Tomorrow
Technology companies are among the most rate-sensitive stocks because investors buy them largely based on what they expect the business to earn years from now.
Imagine someone offers you $100 today or $100 ten years from now. Most people would choose the money today because it could be invested and earn interest in the meantime. Investors think about company profits the same way.
That’s why companies like Nvidia (NASDAQ: NVDA) often react so strongly to inflation reports. Lower interest rate expectations make future earnings more valuable in today’s dollars, allowing investors to justify paying a higher valuation for companies like Nvidia.
Beyond valuations, lower interest rates can also reduce borrowing costs, making it less expensive for companies to build data centres, expand operations, invest in research and development, or make acquisitions.
Income Stocks: Competing with Bonds
Utilities are also considered rate-sensitive, but for a different reason.
Many investors own utility companies because they generate stable cash flows and pay reliable dividends. Imagine you own a utility yielding 4%. If government bonds suddenly offered 5% yields with much less volatility, some investors may switch from utility stocks to bonds instead. When interest rates fall, the opposite often happens, making dividend-paying companies like Fortis (TSE: FTS) more attractive.
Not Every Stock Reacts the Same Way
Not every company benefits equally from changing interest rate expectations. Companies that sell everyday necessities, such as grocery stores or consumer staples, tend to generate relatively stable earnings regardless of where interest rates are heading. Their share prices are often influenced more by company-specific results than by changes in monetary policy.
Why the Federal Reserve Matters
This is why investors pay such close attention to inflation reports and every word spoken by Federal Reserve (Fed) officials.
The Fed doesn’t set stock prices – it sets interest rates. Those rates influence everything from mortgage costs and business borrowing to the way investors value future earnings. That’s why inflation reports and Fed announcements can move entire sectors of the market, even if interest rates themselves don’t change.
That’s exactly what happened this week. Better-than-expected inflation data increased investors’ confidence that the Fed may eventually lower interest rates. That shift in expectations helped lift many of the market’s most rate-sensitive stocks – even though interest rates themselves didn’t change.
The next time inflation data is released, or the Fed announces an interest rate decision, don’t just watch whether the market goes up or down. Watch which sectors move the most. Understanding why different industries react differently can provide clues about what investors expect interest rates – and the economy – to do next.
The key takeaway is that interest rates don’t affect every company the same way. When expectations for Fed policy change, some stocks can move sharply while others barely react. That dynamic played a significant role in this week’s market action, but it was only one piece of the puzzle. Let’s take a closer look at how the major indexes performed, what drove investor sentiment, and how those moves impacted my three portfolios.
Items that may only interest or educate me ….
Canadian Economic news, US Economic news, ….
Canadian Economic news
This past week’s key economic data that the Bank of Canada (BoC) considers when deciding whether to raise or lower the interest rate.
Rate Decision
As expected, the BoC left its benchmark interest rate unchanged at 2.25%, marking the sixth consecutive meeting without a change. The decision was unanimous and widely anticipated by financial markets, signalling that officials believe borrowing costs are at the right level to return inflation to the BoC’s 2% target while continuing to support Canada’s economic recovery.
Governor Tiff Macklem said the BoC expects inflation to remain elevated in the near term before easing to around 2.5% during the second half of 2026 and returning to its 2% target in early 2027. One of the biggest uncertainties, however, remains the conflict between the US and Iran. While higher oil prices have pushed up fuel costs, the Bank noted there is little evidence so far that those increases have spread into the prices of other goods and services.
Compared with its previous communications, the BoC struck a noticeably more optimistic tone. It acknowledged that the Canadian economy is recovering after a weak first quarter, supported by stronger consumer spending, resilient exports, and businesses adapting to ongoing trade uncertainty. As a result, the Bank now expects the economy to grow at an annualized rate of 2.5% in the second quarter. However, it also lowered its 2026 growth forecast to 0.7% from 1.2%, reflecting the weak start to the year. In other words, the economy appears to be improving, but not enough to fully recover from the weakness earlier in the year.
Canadian Market Volatility
Canada’s equivalent of the VIX is the S&P/TSX 60 VIX Index (VIXC). Like its US counterpart, it measures how much volatility investors expect in the Canadian stock market over the next 30 days. Higher readings signal greater uncertainty, while lower readings suggest investors are feeling more confident.
Unlike the VIX, however, the VIXC typically trades at lower levels. That’s because the Canadian market has much less exposure to high-growth technology companies and larger weightings in financials, energy, and materials. These sectors generally experience fewer sharp swings in investor sentiment, resulting in lower expected volatility.
The VIXC opened the week at 14.14, above the previous week’s close of 12.89, as renewed hostilities in the Middle East unsettled investors. Better-than-expected US inflation data and the Bank of Canada’s decision to leave its benchmark interest rate unchanged helped calm markets, pulling the index back toward 13.5. However, that optimism faded later in the week as investors sold semiconductor and other AI-related stocks, pushing the VIXC back above 14.5 before it closed Friday at 14.62.
Although Canadian markets were influenced by many of the same events as their US counterparts, the VIXC remained well below the US VIX throughout the week. Even during a week filled with geopolitical tensions, inflation data, and an AI-driven sell-off, Canadian investors remained noticeably less nervous than their American counterparts.
US Economic news
This past week’s key data points that the Fed considers when deciding whether to raise or lower the interest rate.
Consumer Price Index (CPI)
The latest inflation data from the Bureau of Labor Statistics was welcome news for both investors and the Fed, with consumer prices rising less than expected in June. Lower energy costs helped cool inflation, easing concerns that the Fed might need to keep interest rates higher for longer.
Consumer prices fell 0.4% during the month after rising 0.5% in May, marking the largest monthly decline since April 2020. On an annual basis, headline inflation slowed to 3.5% from 4.2%, beating analysts’ expectations of 3.8%.
Core inflation, which excludes the more volatile food and energy components, was unchanged during the month after increasing 0.2% in May. On an annual basis, core inflation eased to 2.6% from 2.9%, also coming in below expectations.
The biggest monthly decline came from gasoline prices, which fell 9.7% as easing geopolitical tensions helped push oil prices lower through much of June. Utility (piped) gas (natural gas) service prices edged up 0.5%. On an annual basis, fuel oil prices recorded one of the largest increases, climbing 42.9%, reflecting higher global oil prices, while medical care commodities posted one of the biggest declines, falling 2.1%.
Shelter costs, the largest component of the Consumer Price Index covering rent and homeowner costs, increased just 0.1% after rising 0.3% the previous month. On an annual basis, shelter inflation also eased slightly to 3.3% from 3.4%, providing further evidence that one of inflation’s stickiest components continues to moderate.
While June’s report was encouraging, investors should avoid reading too much into a single month of data. Oil prices have climbed sharply again following renewed tensions in the Middle East, meaning some of June’s progress could prove temporary if higher energy costs begin feeding back into inflation over the coming months. For now, however, the report provides another sign that inflation is moving in the right direction and reduces pressure on the Fed to tighten monetary policy further.
Retail Sales
The US Census Bureau reported that retail sales increased 0.2% in June, matching analysts’ expectations and marking the fifth consecutive monthly increase. Although the pace of spending slowed from May’s revised 1.0% gain, the report showed consumers continue to spend despite ongoing economic uncertainty. On an annual basis, retail sales rose 6.7%, slightly below May’s 6.9%.
At first glance, a 0.2% increase suggests consumer spending is slowing. However, much of the weakness came from lower gasoline prices, which reduced sales at gas stations simply because consumers were paying less at the pump – not necessarily because they were buying less fuel.
Motor vehicle & parts dealers and online retailers (nonstore retailers) led the monthly gains, with sales rising 1.9%. Gasoline stations posted the largest monthly decline, with sales falling 5.3%. Over the past year, however, gasoline stations recorded the largest increase in sales, up 19.8%, reflecting higher fuel prices, while furniture & home furnishings stores saw little change.
To get a better sense of underlying consumer spending, analysts also look at core retail sales, which exclude the categories that tend to fluctuate the most from month to month. In June, core retail sales rose 0.4% after increasing 0.5% in May. On an annual basis, core sales climbed 5.7%, up from 5.6% the previous month.
The report creates an interesting balance with this week’s inflation data. While the softer-than-expected CPI and Producer Price Index (PPI) reports suggested inflation is easing, the retail sales report showed consumers are still spending, indicating the economy remains on solid footing. That’s generally good news for investors because it suggests the economy isn’t slipping into recession while inflation continues moving in the right direction. At the same time, resilient consumer spending may give the Fed less urgency to lower interest rates, allowing policymakers to remain patient as they monitor future inflation data.
Consumer Sentiment Index (CSI)
The University of Michigan’s preliminary CSI for July comfortably beat expectations, rising to 54.4 from 49.5 in June. That marked the second consecutive monthly improvement and the highest reading since February, although sentiment remains 11.8% below where it stood a year ago.
The improvement was largely driven by lower gasoline prices, which helped consumers feel more optimistic about both their current financial situation and the economy over the next six months. The Current Economic Conditions Index, which measures how consumers feel about their finances and job security today, rose 15.1% to 54.9 from 47.7 in June. Meanwhile, the Expectations Index, which gauges consumers’ outlook for the economy over the next six months, climbed 6.5% to 54.0. Despite the improvement, both measures remain below their levels from a year ago.
For us investors, the report complemented this week’s better-than-expected CPI and PPI reports, suggesting consumers were becoming more optimistic about the inflation outlook. However, there is an important caveat. Much of the survey was conducted before the recent rise in oil and gasoline prices, meaning the improvement in sentiment could prove short-lived if higher fuel costs persist.
American Market Volatility
The VIX – often called the market’s “fear gauge” – measures expected volatility in the S&P 500 over the next 30 days. In simple terms, it reflects how much uncertainty investors are pricing into the market. The index typically rises when fear increases and falls as confidence returns. Readings above 20 are generally associated with heightened volatility, while lower levels tend to signal calmer market conditions.
The VIX opened the week at 16.32, up from the previous week’s close of 15.04, as renewed hostilities between the United States and Iran unsettled investors. As tensions escalated, the index climbed above 17.5 before retreating after better-than-expected inflation data boosted hopes that the Fed may eventually lower interest rates. That optimism didn’t last. A broad sell-off in semiconductor and other AI-related stocks later in the week pushed the VIX above 18, where it finished Friday at 18.74.
Weekly Market and Portfolio Review
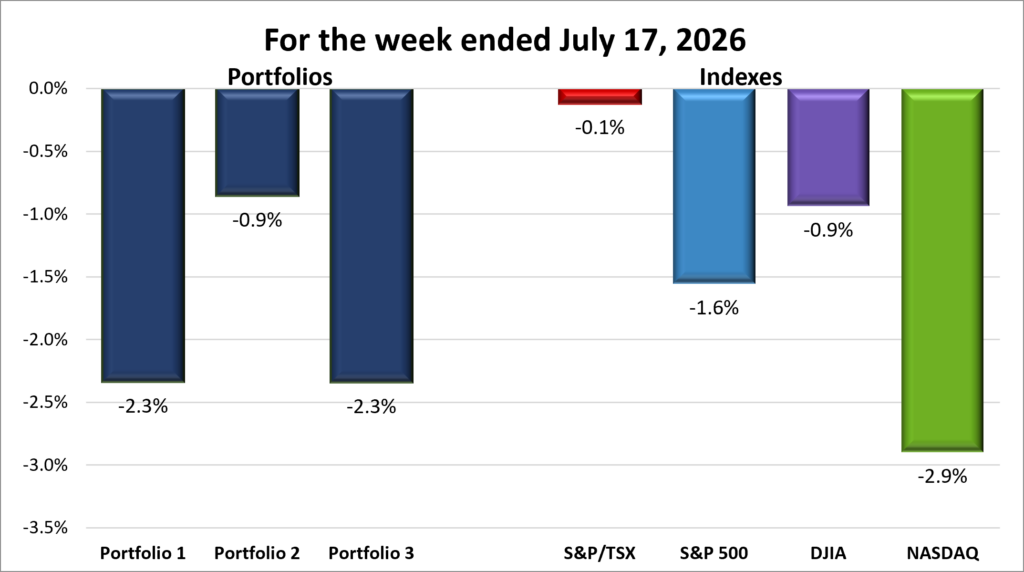
For the week, the TSX (SPTSX) slipped 0.1%, the S&P 500 (SPX) dropped 1.6%, the DJIA (INDU) shed 0.9% and the Nasdaq (CCMP) was down sharply 2.9%.
| Index | Weekly Streak |
| TSX: | 1 – week losing streak |
| S&P: | 1 – week losing streak |
| DJIA: | 2 – week losing streak |
| Nasdaq: | 1 – week losing streak |
 Once again, markets were pulled in opposite directions this week. Better-than-expected inflation data and a strong start to earnings season provided support, while renewed Middle East tensions and another bout of AI volatility weighed on investor sentiment. By the end of the week, all four major indexes, the Toronto Stock Exchange Composite Index (TSX), the S&P 500 Index (S&P), the Dow Jones Industrial Average (DJIA), and the Nasdaq Composite Index (Nasdaq), finished lower despite a midweek rally. The S&P 500 snapped its weekly winning streak, recording only its third losing week since March.
Markets initially came under pressure but recovered after June inflation data came in better than expected. The report eased concerns that the Fed would need to keep interest rates higher for longer, pushing bond yields lower and reviving hopes that policymakers could have more flexibility with future rate cuts.
However, inflation concerns were not completely eliminated. Optimism for a peaceful resolution in the Middle East faded as tensions between the US and Iran escalated, raising concerns that a disruption to energy supplies, particularly shipments passing through the Strait of Hormuz, could push oil prices higher and reignite inflation pressures. Higher oil prices can spread through the economy by increasing transportation and production costs, creating another challenge for the Fed if inflation begins moving higher again.
The other major story was another volatile week for artificial intelligence (AI) and semiconductor stocks. After leading markets higher for much of the year, chip companies came under pressure as investors questioned whether the expected returns from AI spending could justify the enormous investments being made. Even strong earnings from major semiconductor companies were not enough to prevent selling, highlighting just how lofty expectations have become within the sector.
Because of its enormous market capitalization, Nvidia was the biggest drag on the market as investors sold shares of major chip companies. As one of the largest companies in the major indexes, even a relatively modest decline in Nvidia can have a much bigger impact on overall market performance than larger drops in smaller companies. This impact was amplified by the fact that technology and semiconductor stocks now make up such a large share of the market, meaning weakness across the sector spilled over into the broader market. The unveiling of Chinese AI startup Moonshot’s Kimi K3 model added to concerns that competition in AI is intensifying and companies may need to continue spending heavily to maintain their advantage.
The week also marked the unofficial start of second-quarter earnings season. Strong results from several major US banks reassured investors that parts of the economy remain healthy, helping broaden market participation beyond the technology sector. Even so, investors continued to question whether corporate earnings can keep pace with the lofty expectations already reflected in many share prices.
In Canada, the TSX set a record high close before pulling back as investors locked in profits. Rising oil prices supported Canadian energy producers, helping offset weakness in basic materials stocks as lower gold prices weighed on mining companies. Because energy and materials make up such a large portion of the TSX, strength in oil producers was largely offset by weakness in gold miners, keeping the overall index within a relatively narrow range.
Canada’s financial sector also provided an important tailwind. As expected, the BoC left its benchmark interest rate unchanged, removing one source of uncertainty for investors. Strong earnings from major US banks also boosted confidence in the North American banking sector, providing additional support for Canadian financial stocks before profit-taking in financials and metal miners pulled the TSX lower by Thursday’s close.
Overall, the week reminded investors that markets rarely move for a single reason. Inflation, earnings, geopolitics, and investor expectations all pulled markets in different directions, creating a volatile week.
| Portfolio | Weekly Streak |
| Portfolio 1: | 1 – week losing streak |
| Portfolio 2: | 2 – week losing streak |
| Portfolio 3: | 1 – week losing streak |
Last week, the AI rally rewarded the technology-heavy Portfolios 1 and 3. This week, the script flipped as semiconductor stocks sold off. All three portfolios finished lower, but Portfolio 2 once again proved the most resilient, highlighting how diversification can help soften the impact when market leadership suddenly changes.
Portfolio 1 declined 2.3% for the week. That’s never the goal, but it still outperformed the Nasdaq. 😊 The selloff in semiconductor stocks weighed heavily on the portfolio, with every chip company finishing the week lower. Nvidia, the portfolio’s largest holding, fell 3%, creating a significant headwind. Broad diversification within the technology sector helped cushion the overall decline, even though only 42% of the holdings finished the week higher. Apple (NASDAQ: AAPL) reached another record high as it reclaimed the title of the world’s most valuable company, while CrowdStrike (NASDAQ: CRWD) and Cloudflare (NYSE: NET) also set new highs. Offsetting those gains were steep declines in Celestica (TSE: CLS), down 15%, Navitas Semiconductor (NASDAQ: NVTS), down 12%, and Kraken Robotics (TSE: PNG), down 11%.
Portfolio 2 was the week’s best performer, declining just 0.9%. With much less exposure to AI, strength in its financial and energy holdings helped offset weakness elsewhere. Although 58% of its holdings finished the week higher, including another record high from the Bank of Nova Scotia (TSE: BNS), those gains weren’t enough to overcome steeper declines, led by MongoDB (NASDAQ: MDB), which fell 10%.
Portfolio 3 also declined 2.3%, narrowly trailing Portfolio 1 by a fraction of a percentage point. With only 34% of its holdings finishing the week higher, diversification helped keep the losses in check. Like Portfolio 1, it was hurt by the broad semiconductor selloff, with Nvidia, its largest holding, pushing the portfolio into the negative territory for the week. Weakness across AI and space stocks also weighed on the portfolio, but the portfolios diversified mix helped limit the overall decline. Royal Bank (TSE: RY) reached another record high, while the biggest losses came from 5N Plus (TSE: VNP) down 18%, and Rocket Lab (NASDAQ: RKLB) and Corning (NYSE: GLW) both down 15%.
Overall, the week highlighted the value of diversification. While the AI-driven portfolios gave back some of last week’s gains as semiconductor stocks retreated, they still outperformed the Nasdaq. Meanwhile, Portfolio 2’s greater exposure to financials and energy helped cushion the impact of the technology selloff, demonstrating how leadership can shift from one sector to another.
Companies on the Radar
 With no new companies catching my attention this week following SK hynix‘s (NASDAQ: SKHY) debut the previous week, my focus remains on the five companies below. Along with the top-performing holdings across all three portfolios, these are the businesses I’m watching most closely as I consider either opening a new position or adding to an existing one.
- SK Hynix: A large cap South Korean semiconductor company and one of the world’s leading memory chip manufacturers. The company is best known for producing DRAM and NAND flash memory, including the high-bandwidth memory (HBM) chips that have become essential for AI data centres. Think of it as one of the companies supplying the memory that allows AI processors from companies like Nvidia to perform at their best, generating revenue by selling memory chips used in servers, smartphones, PCs, and other electronic devices.
- S&P Global (NYSE: SPGI): A large cap American company and one of the world’s most important financial information companies. Most investors know it for the S&P 500 Index, but the business also provides credit ratings, market data, analytics, and research used by banks, corporations, governments, and investors worldwide. Think of it as one of the key information providers that helps global financial markets function, generating revenue through subscriptions, licensing fees, and rating services.
- Perimeter Solutions (NYSE: PRM): An American mid-cap company that produces specialty chemicals. Its best-known products are the fire retardants used to fight wildfires. If you’ve seen aircraft dropping bright red retardant over a wildfire, there’s a good chance it came from Perimeter. The company operates in a niche but essential market, supplying products and services that help protect communities, infrastructure, and natural resources during increasingly active wildfire seasons.
- TerraVest Industries (TSE: TVK): A mid-cap Canadian industrial company that produces equipment for energy, storage, and transportation markets, including propane tanks, pressure vessels, and heating systems. It grows through a mix of organic expansion and acquisitions, serving steady, asset-heavy industrial niches across North America.
- Forgent Power Solutions (NYSE: FPS): An American large-cap industrial company that builds the electrical infrastructure needed to power data centres, factories, and other large facilities. In simple terms, it makes the equipment that helps move electricity from the grid to where it is needed. It’s not the company building AI models, but rather one of the companies supplying the critical infrastructure that helps keep the AI boom running.
As always, these are not buy recommendations. Make sure to do your own research and choose investments that fit your personal financial goals.
The Radar Check was last updated July 17, 2026.
Note: Because SK hynix only began trading on Nasdaq on July 10, 2026, analyst coverage, Morningstar ratings, and other third-party research are not yet available for the new listing. As coverage develops, this information will provide additional insight into how the market is evaluating the company.


That’s a wrap for this week, thanks for reading – may your portfolio stay green and your dividends steady. See you next time!