
America’s Emergency Oil Tank
“The deal with the Islamic Republic of Iran is now complete.” With those words from President Trump, markets breathed a sigh of relief as investors hoped the US-Israel-Iran conflict had finally come to an end. Beyond the obvious humanitarian benefits, investors also welcomed greater geopolitical stability. A lasting ceasefire lowers the risk of supply disruptions, restores confidence, and allows one of the world’s most important energy routes – the Strait of Hormuz – to reopen, easing fears of another spike in oil prices and inflation.
Most headlines have focused on the ceasefire itself and the resumption of oil shipments through the Strait. What has received far less attention is what happened behind the scenes. To help stabilize fuel prices and cushion potential supply disruptions, the United States once again tapped its Strategic Petroleum Reserve (SPR), pushing it to one of its lowest levels in more than four decades.
That may sound like an obscure statistic, but the SPR plays an important role in global energy markets. Its size can influence everything from oil prices to inflation expectations.
So, what exactly is the Strategic Petroleum Reserve, why does it exist, and why should investors care?
Created in 1975 after the oil shocks of the 1970s, the SPR is an emergency stockpile of crude oil the US government can release during wars, natural disasters, or other major supply disruptions. Think of it as a giant emergency fuel tank buried underground. Like an emergency fund in your personal finances, it exists for the moments you hope never happen – but need to be prepared for anyway.
Today, the reserve is stored in massive underground salt caverns along the Gulf Coast, where oil can be safely stored for decades. At full capacity, the SPR holds about 714 million barrels – roughly a month’s worth of US oil consumption, or several months of imports depending on demand.
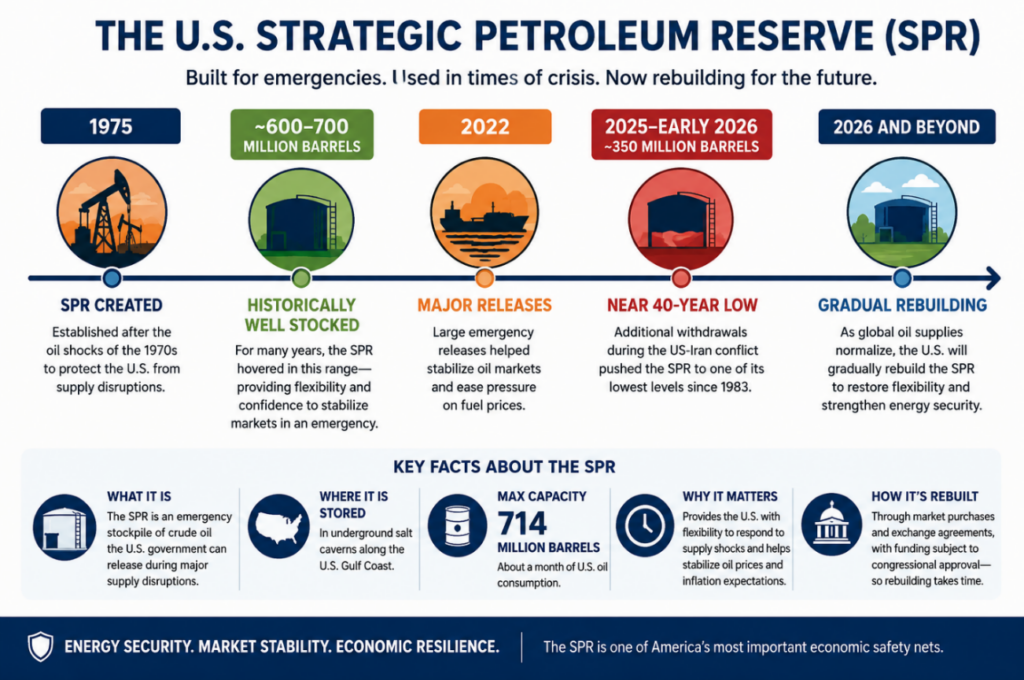
Although there is no official “normal” level, the reserve spent many years between 600 and 700 million barrels, giving the US plenty of flexibility to respond to supply shocks while reassuring markets that emergency reserves were readily available.
That changed over the past few years. Large emergency releases in 2022, followed by additional withdrawals during the recent US-Iran conflict, left the SPR near its lowest level since 1983. As the ceasefire takes hold and the Strait of Hormuz reopens, global oil supplies are expected to normalize, allowing the US to gradually rebuild the reserve. For us investors, that’s good news. A healthier SPR lowers the risk that future supply disruptions will lead to sharp spikes in oil prices and renewed inflation pressures.
Rebuilding the reserve won’t happen overnight. The US Department of Energy buys oil when prices are favourable or uses exchange agreements that require companies to return borrowed barrels over time. Funding also depends on congressional approval, so replenishing the SPR is a gradual process shaped by both policy and market conditions.
There is no magic number where the SPR suddenly becomes a problem. The real issue is flexibility. A smaller reserve leaves the US with less capacity to respond to future supply shocks, reducing confidence that it can stabilize markets during a crisis. That uncertainty can quietly add a risk premium to oil prices and, ultimately, inflation.
In short, the SPR is about much more than barrels sitting underground. It’s a measure of how much breathing room the global energy system has when the unexpected happens – and today, that breathing room is thinner than it has been for most of the past four decades.
Next week, we’ll take a look at Canada’s answer to the SPR. For now, let’s shift back to the markets, how they performed this week, and what that means for my three portfolios.
Items that may only interest or educate me ….
Canadian Economic news, US Economic news, ….
Canadian Economic news
This past week’s key economic data that the Bank of Canada (BoC) considers when deciding whether to raise or lower the interest rate.
Retail Sales
Canadian consumers kept spending in April, but momentum slowed. According to Statistics Canada, retail sales rose 0.5%, following a stronger 0.9% gain in March, marking the fifth consecutive month of positive sales growth. However, the result fell just short of economists’ expectations for a 0.6% increase. On a year-over-year basis, sales were up 3.7%, edging higher from 3.4% in March.
Looking beneath the headline, however, paints a more mixed picture. Gasoline stations and fuel vendors led the monthly gains, with sales climbing 5.1%, while food and beverage retailers saw sales fall 2.0%. Over the past year, gas station sales jumped 22.8%, reflecting higher fuel prices, while furniture, electronics, and home furnishings stores posted the largest decline, with sales down 5.7%. The contrast suggests Canadian consumers are becoming more selective about where they spend their money.
At first glance, the report appears encouraging. A closer look, however, tells a different story. Much of the strength came from higher gasoline prices rather than broad-based consumer spending. To get a better sense of underlying consumer spending, analysts also look at core retail sales, which exclude the more volatile gasoline, motor vehicle, and parts categories. On that measure, sales fell 0.7% in April after a 0.1% decline in March, marking the second consecutive monthly decrease. On an annual basis, core retail sales were up 3.4%, slowing from 4.1% in March.
Taken together, the data suggests Canadian households are still spending, but they’re increasingly prioritizing necessities over discretionary purchases. Higher gasoline prices are consuming a larger share of household budgets, leaving less money available for categories like clothing, furniture, and other discretionary items.
This report is a reminder that headline numbers don’t always tell the full story. While retail sales have increased for five consecutive months, weakness in core retail sales suggests underlying consumer demand continues to soften. That’s unlikely to materially change the BoC’s interest rate outlook.
Looking ahead, Statistics Canada’s advance estimate points to another 0.1% increase in retail sales for May, although that figure is preliminary and subject to revision.
Canadian Market Volatility
Canada’s version of the market “fear gauge” is the S&P/TSX 60 VIX Index (VIXC), often shown on trading platforms as VIXI.TO. Like its better known US counterpart, it measures expected volatility in Canadian equities over the next 30 days, with higher readings reflecting increased uncertainty.
The VIXC opened the week at 14.33 and traded in a relatively narrow range between 14 and 14.5 during the early part of the week. It briefly moved higher, rising above 15.5 as investors reacted to the Fed’s more hawkish tone, after officials signalled they expect to hold rates steady for the remainder of the year, while still leaving the possibility of an additional rate hike if inflation proves persistent. From there, the index settled back near the 15 level and ultimately closed the week at 14.72.
Overall, Canadian volatility stayed relatively steady, despite a brief spike in response to shifting US interest rate expectations.
US Economic news
This past week’s key data points that the Federal Reserve (Fed) considers when deciding whether to raise or lower the interest rate.
US Rate Decision
The Fed’s Federal Open Market Committee (FOMC) voted unanimously to leave the benchmark interest rate unchanged at 3.50% to 3.75%, where it has remained since the end of 2025. The decision was widely expected by financial markets.
Although the Fed left interest rates unchanged, investors were paying just as much attention to the accompanying policy statement. These statements help explain how officials view the economy and often provide clues about the future direction of interest rates.
The meeting also marked the beginning of a new era at the Fed. This was the first policy meeting chaired by Kevin Warsh, whose post-FOMC statement was noticeably shorter and more concise than those issued under Jerome Powell. Warsh has long been critical of extensive forward guidance, preferring to let incoming economic data shape expectations rather than signalling the Fed’s next move well in advance.
The meeting reinforced a familiar theme: economic strength is both a blessing and a challenge. Healthy consumer spending and a strong labour market support economic growth, corporate earnings, and reduce recession fears. At the same time, that resilience makes it more difficult for inflation to return to the Fed’s 2% target, giving policymakers little reason to lower interest rates anytime soon.
In short, the Fed delivered no surprises on interest rates, but its message was unmistakable: the fight against inflation isn’t over. Until inflation shows more convincing progress toward the Fed’s target, investors should expect interest rates to remain higher for longer.
Retail Sales
According to the US Census Bureau, May retail sales rose 0.9%, well above the expected 0.5% increase, following a downwardly revised 0.4% gain in April. This marked the fourth consecutive monthly increase, showing consumers continued opening their wallets despite higher inflation, elevated oil prices, and ongoing geopolitical uncertainty. On an annual basis, retail sales climbed 6.9%, up from 4.8% in April.
Sales at gasoline stations rose 3.4% in May, while electronics and appliance stores saw the largest monthly decline, falling 0.5%. Over the past year, gasoline stations have seen the strongest growth, with sales up 26.5%, reflecting higher fuel prices, while furniture retailers were the only sector to post a decline, with sales down 1.2%.
Because retail sales are reported in dollar terms rather than inflation-adjusted units, rising gasoline prices can, and often do, inflate the headline number. In other words, higher sales at the pump don’t necessarily mean consumers are buying more fuel – they’re often just paying higher prices.
To get a better sense of underlying consumer spending, analysts also look at core retail sales, which exclude vehicles, vehicle parts, and gasoline because those tend to be more volatile from month to month. In May, core retail sales rose 0.5%, matching both expectations and April’s increase. On an annual basis, core sales climbed 5.6%, up from an upwardly revised 5.0% in April.
Overall, the report suggests the US consumer is still the backbone of the economy. That’s encouraging for investors because consumer spending drives roughly two-thirds of US economic activity, supporting both growth and corporate earnings. However, continued resilience could also make it harder for inflation to cool, giving the Fed less urgency to lower interest rates.
American Market Volatility
The VIX, often called the market’s “fear gauge,” measures expected volatility in the S&P 500 over the next 30 days. In simple terms, it reflects how much uncertainty investors are pricing into markets. The VIX tends to rise when fear increases and fall when confidence improves. Readings above 20 are typically associated with elevated stress, while levels below that suggest calmer conditions.
The index opened the week at 16.81 and traded mostly around the 16 level for the first half of the week. It briefly spiked to 18.75 following the FOMC meeting, as investors reacted to the Fed’s cautious tone and its indication that rates are likely to remain higher for longer. However, the move was short-lived, with the VIX easing back toward 17 in the following session and ultimately closing the week at 16.78.
Overall, the VIX saw a brief mid-week increase in uncertainty before settling back near where it started. While volatility picked up around the Fed’s rate decision, the quick reversal suggests investors remained relatively comfortable with broader market conditions, even as they stayed alert to policy and geopolitical risks.
Weekly Market and Portfolio Review
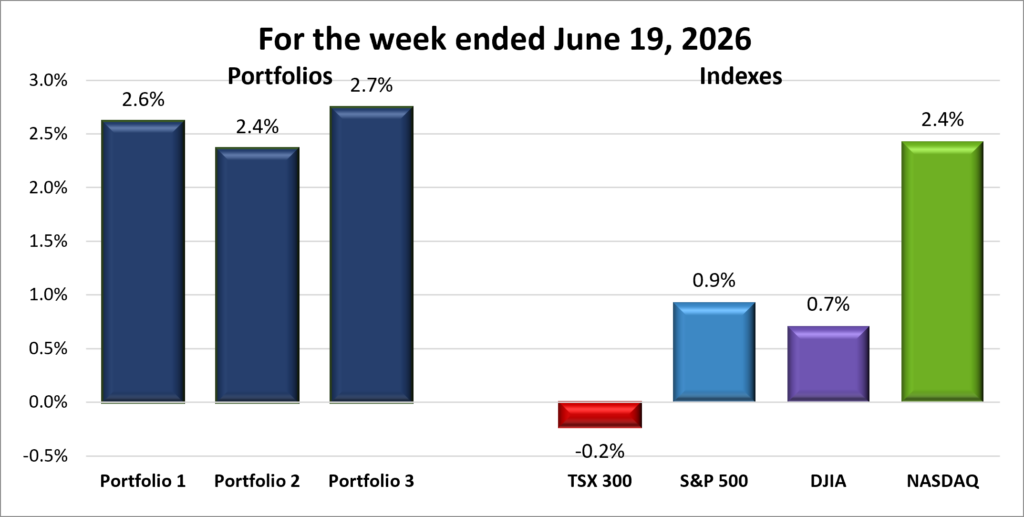
For the week, the TSX (SPTSX) dropped 0.2%, the S&P 500 (SPX) advanced 0.9%, the DJIA (INDU) added 0.7% and a last-minute surge lifted the Nasdaq (CCMP) 2.4%.
| Index | Weekly Streak |
| TSX: | 1 – week losing streak |
| S&P: | 2 – week winning streak |
| DJIA: | 2 – week winning streak |
| Nasdaq: | 2 – week winning streak |
![]() The week started with momentum carrying over from SpaceX’s (NASDAQ: SPCX) blockbuster market debut the previous Friday, helping extend the positive tone in markets. That optimism pushed the Dow Jones Industrial Average (DJIA) to consecutive record highs before a midweek pullback. By the end of the shortened trading week, US equities – including the S&P 500 Index (S&P), Nasdaq Composite Index (Nasdaq), and DJIA – had recovered those losses to finish in positive territory.
The week started with momentum carrying over from SpaceX’s (NASDAQ: SPCX) blockbuster market debut the previous Friday, helping extend the positive tone in markets. That optimism pushed the Dow Jones Industrial Average (DJIA) to consecutive record highs before a midweek pullback. By the end of the shortened trading week, US equities – including the S&P 500 Index (S&P), Nasdaq Composite Index (Nasdaq), and DJIA – had recovered those losses to finish in positive territory.
Across the US market, the main drivers were geopolitical developments in the Middle East and the Fed’s outlook on interest rates, with artificial intelligence (AI) in the background.
Early in the week, a preliminary US–Iran peace deal sent oil prices lower on expectations of reduced geopolitical risk and improved global supply conditions. Lower oil prices also tend to ease inflation concerns, which helped lift stocks. That optimism faded midweek after President Trump said the agreement had not been finalized and warned that hostilities could resume if talks broke down. Oil quickly rebounded, and stocks briefly pulled lower as uncertainty returned. Sentiment improved again once the agreement was formally signed, helping markets stabilize into the end of the week.
Attention then shifted to the Fed. As expected, officials left interest rates unchanged, but investors focused more on the outlook than the decision itself. The Fed reiterated that inflation remains a concern and signalled they are in no rush to cut rates, with the possibility of a hike still on the table. Higher rates tend to weigh on stocks by increasing borrowing costs and making bonds more attractive. Markets slipped after the announcement as investors focused on this more hawkish tone, before recovering the next day following the signing of the peace deal led to falling oil prices which helped ease inflation concerns.
AI also played its part. Early in the week, investors rotated out of some technology and AI-related stocks into more traditional sectors, helping lift the DJIA to new highs. By the end of the week, sentiment had improved and money flowed back into large AI and technology names, reigniting the broader AI-driven rally that has supported markets over the past two years.
While US markets were driven largely by shifting expectations around interest rates and technology, Canada’s market followed a different path due to its heavier exposure to energy and natural resources.
The Toronto Stock Exchange Composite Index (TSX) started the week strongly, reaching two consecutive record highs as oil, gold, and other commodity prices moved higher. That strength faded in the back half of the week as the index posted three straight declines, giving back much of its early gains.
Energy was the main driver of the reversal. By the end of the week, Brent crude and West Texas Intermediate (WTI) had fallen to their lowest levels since before the conflict began in late February, as expectations of improved global supply increased.
The basic materials sector also added to the volatility, with gold and other mining stocks reacting to shifting commodity prices and investor sentiment. Early gains faded as attention shifted toward the Fed’s more cautious outlook, contributing to further pressure on the TSX.
Overall, the week was another reminder that markets rarely move in a straight line. Geopolitics, oil prices, and interest rates drove much of the volatility, but improving sentiment helped US markets recover by the end of the week. It also highlighted how market composition matters, with Canada’s resource-heavy TSX closely tied to commodity prices, while US markets benefited from renewed strength in AI and technology stocks.
| Portfolio | Weekly Streak |
| Portfolio 1: | 2 – week winning streak |
| Portfolio 2: | 2 – week winning streak |
| Portfolio 3: | 2 – week winning streak |
![]() It was another strong week for all three portfolios, extending each of their winning streaks. After a brief mid week pause, investors poured back into AI and technology stocks, and that’s when these technology-heavy portfolios really shined. It’s one of the reasons I’m drawn to investing in the sector. Not only did I spend my career working in technology, but I also enjoy investing in companies that can benefit when innovation and investor optimism go hand in hand. The flip side, of course, is that when markets stumble, technology stocks often experience some of the biggest declines. 😊
It was another strong week for all three portfolios, extending each of their winning streaks. After a brief mid week pause, investors poured back into AI and technology stocks, and that’s when these technology-heavy portfolios really shined. It’s one of the reasons I’m drawn to investing in the sector. Not only did I spend my career working in technology, but I also enjoy investing in companies that can benefit when innovation and investor optimism go hand in hand. The flip side, of course, is that when markets stumble, technology stocks often experience some of the biggest declines. 😊
Financial companies also contributed solid gains, but it was the late-week rally in AI and technology stocks that really drove performance. As an added bonus, two of the three portfolios outperformed the Nasdaq, the week’s best-performing major index, which gained 2.4%.
Portfolio 1 gained 2.6%, despite fewer than half of its holdings (49%) finishing the week higher. The result was a reminder that not every holding needs to rise when your biggest winners carry significant weight. Nvidia (NASDAQ: NVDA), the portfolio’s largest position, was one of those winners. Hammond Power Solutions (TSE: HPS.A) also had an outstanding week, climbing 14%, while both TD Bank (TSE: TD) and Bank of Nova Scotia (TSE: BNS) reached new record highs.
Portfolio 2 was the week’s laggard, gaining 2.4%, essentially matching the Nasdaq. Weakness in the energy holdings and the fact that only 48% of the portfolio’s companies finished higher limited its overall return. Even so, strong gains from Hammond Power Solutions and Take-Two Interactive Software (NASDAQ: TTWO), up 10%, more than offset much of that weakness. iA Financial Group (TSE: IAG) and Bank of Nova Scotia also reached record highs during the week.
Portfolio 3 was the top performer with a 2.7% gain, helped by an impressive 65% of its holdings finishing the week in positive territory. I was especially pleased to see many of the portfolio’s newer additions recorded a weekly gain, including MDA Space (TSE: MDA) with a gain of 10%. Vertiv Holdings (NYSE: VRT) also had a strong week, climbing 11%, while TD Bank reached a record high.
Overall, it was another encouraging week. While a few standout performers led the way, it was the combined strength of many financial and technology holdings that helped all three portfolios finish comfortably in the green. That’s exactly how I want these portfolios to perform—not by relying on a single stock, but by giving a collection of quality companies time to grow. With that in mind, I’ll happily put another week of gains in the books and hope next week brings more of the same. 😊
Companies on the Radar
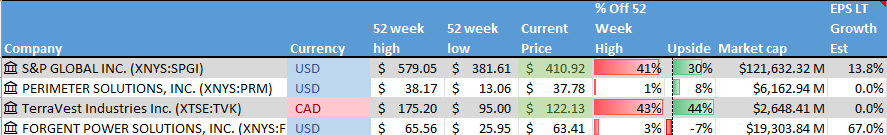
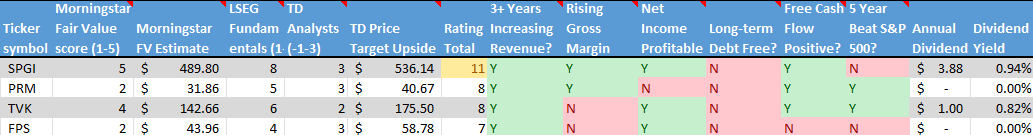
 With my radar list looking a little thin, I added three new companies this week. As I mentioned last week, all three portfolios have a technology tilt, particularly Portfolios 1 and 3, so I’m actively looking for opportunities outside the technology sector to improve diversification. With that in mind, the three newcomers are electrical infrastructure provider Forgent Power Solutions (NYSE: FPS), financial data and analytics giant S&P Global (NYSE: SPGI), and specialty chemicals company Perimeter Solutions (NYSE: PRM).
Forgent Power Solutions is an American large-cap industrial company that builds the electrical infrastructure needed to power data centres, factories, and other large facilities. In simple terms, it makes the equipment that helps move electricity from the grid to where it is needed. It’s not the company building AI models, but rather one of the companies supplying the critical infrastructure that helps keep the AI boom running.
S&P Global is a large cap American company and one of the world’s most important financial information companies. Most investors know it for the S&P 500 Index, but the business also provides credit ratings, market data, analytics, and research used by banks, corporations, governments, and investors worldwide. Think of it as one of the key information providers that helps global financial markets function, generating revenue through subscriptions, licensing fees, and rating services.
Perimeter Solutions is an American mid-cap company that produces specialty chemicals. Its best-known products are the fire retardants used to fight wildfires. If you’ve seen aircraft dropping bright red retardant over a wildfire, there’s a good chance it came from Perimeter. The company operates in a niche but essential market, supplying products and services that help protect communities, infrastructure, and natural resources during increasingly active wildfire seasons.
The addition of these three companies, alongside holdover TerraVest Industries (TSE: TVK), brings my radar list to four companies. While they operate in very different industries, all four share something I look for in potential investments: they provide products or services that play an important role behind the scenes and are difficult to replace.
- TerraVest Industries (TSE: TVK): A mid-cap Canadian industrial company that produces equipment for energy, storage, and transportation markets, including propane tanks, pressure vessels, and heating systems. It grows through a mix of organic expansion and acquisitions, serving steady, asset-heavy industrial niches across North America.
As always, these are not buy recommendations. Make sure to do your own research and choose investments that fit your personal financial goals.
The Radar Check was last updated June 19, 2026.
That’s a wrap for this week, thanks for reading – may your portfolio stay green and your dividends steady. See you next time!