
Canada’s Missing SPR
Last week we looked at America’s Strategic Petroleum Reserve (SPR) and how its shrinking stockpile can ripple through oil prices, inflation, and financial markets. That naturally raises a simple question: what about Canada? As one of the world’s largest oil producers, you’d expect it to have a similar emergency reserve ready to step in during supply shocks.
It doesn’t.
When tensions between the US and Iran escalated into open conflict earlier this year, oil prices jumped almost overnight. Investors worried that any disruption to Middle Eastern supply could ripple through the global economy, pushing up gasoline prices, fuelling inflation, and making it harder for central banks to bring interest rates down.
That kind of shock is exactly what strategic petroleum reserves are designed for. In the US, the SPR has been used during major disruptions such as Hurricane Katrina, the Libyan civil war, and Russia’s invasion of Ukraine to help ease supply shortages and calm markets.
Canada, despite being one of the world’s largest oil producers, has never built a SPR. One reason is its reliance on domestic production and commercial inventories rather than a government-owned emergency stockpile. Another is geography. As North America’s largest energy supplier, Canada benefits from an integrated energy market with the United States, reducing the perceived need for a separate reserve. There is also the cost factor – building and maintaining a large strategic reserve would require significant government spending, something policymakers have historically been reluctant to take on.
Unlike the US, that means there is no government-controlled reserve to release during supply shocks and no direct policy lever to “open the taps.” Instead, adjustments happen through the private market. Energy flows respond to price signals, with producers, refiners, and exporters shifting supply based on economics and logistics. In simple terms, when prices rise, existing barrels tend to flow toward the highest-paying markets as producers and distributors redirect supply to where it is most valuable. This helps absorb part of the shock through market reallocation rather than government action. The government can still influence conditions at the margins through regulation, infrastructure decisions, and coordination with industry during disruptions, but it doesn’t directly release barrels into the market the way the US SPR allows.
Recent geopolitical events – from Russia’s invasion of Ukraine to the US-Iran conflict – have reminded governments that energy security can’t be taken for granted. While Canada remains one of the world’s most energy-rich nations, these events have raised fresh questions about whether relying solely on commercial inventories is still the right approach.
Whether Canada should establish its own SPR remains an open debate. Supporters argue it would strengthen energy security and provide another tool during crises. Critics point to the cost, Canada’s strong domestic production, and its close integration with the US energy market. There may not be a clear answer, but the broader reality is that even energy-rich countries are not immune to global supply shocks.
Overall, Canada’s approach to energy security looks very different from the US, but both systems ultimately aim for the same goal: cushioning the impact of unexpected supply disruptions. With that in mind, let’s shift back to the broader market picture and take a look at what moved the markets this week, and how my three portfolios performed.
Items that may only interest or educate me ….
Canadian Economic news, US Economic news, …
Canadian Economic news
This past week’s key economic data that the Bank of Canada (BoC) considers when deciding whether to raise or lower the interest rate.
Consumer Price Index (CPI)
Statistics Canada’s May inflation report came in stronger than expected, but a closer look suggests the headline isn’t as concerning as it first appears. Prices rose 1.0% during the month, above expectations for a 0.8% increase and the largest monthly gain in 15 months. Annual inflation accelerated to 3.2% from 2.8%, the highest reading in 29 months. That pushed inflation back above the BoC’s 1%-3% target range and slightly above economists’ expectations of 3.0%.
The main driver was gasoline. The conflict in the Middle East continued to disrupt global oil supplies in May, pushing gas prices up 5.6% from April and 33.6% year over year. Higher fuel costs lifted overall inflation, while shelter – covering rent and mortgage costs – was the only major category to decline on a monthly basis. On an annual basis, household operations, furnishings and equipment was the only category to see lower prices.
The more encouraging news is that the BoC’s preferred core measures of inflation, which filter out unusually large price swings to better reflect underlying trends, remained close to the Bank’s 2% target. That suggests the increase was driven more by energy prices than broad-based inflation across the economy.
Normally, an upside inflation surprise would raise the odds of higher interest rates. However, there’s an important catch. Since the May data was collected, oil prices have already retreated as tensions in the Middle East eased and supply concerns faded. If gasoline prices continue to fall through June, this spike in headline inflation could prove temporary. That’s why many analysts expect the BoC to look through the report unless higher energy costs start spilling into other parts of the economy.
For us investors, this is a reminder to look beyond the headline. At first glance, 3.2% inflation sounds concerning. But much of the increase came from one source – higher oil prices driven by the US-Iran war. Underlying inflation remained relatively stable, suggesting broader price pressures haven’t meaningfully worsened.
Going forward, the key question is whether energy prices stay elevated. If oil continues to ease, inflation could cool again over the next few months. If energy prices rise or businesses begin passing higher costs on to consumers, inflation could stay stickier and keep interest rates higher for longer.
Overall, the report is less alarming than the headline suggests. While it shows how quickly geopolitical events can influence inflation, it also reinforces why investors should dig beneath the headline before drawing conclusions.
Canadian Market Volatility
Canada’s version of the market “fear gauge” is the S&P/TSX 60 VIX Index (often shown as VIXC or on the Toronto Stock Exchange under the ticker VIXI). It works much like the US’s VIX but instead tracks expected volatility in Canadian equities over the next 30 days, with higher readings signalling greater uncertainty in the Canadian market.
In general, Canada’s volatility gauge tends to run a bit lower than the US VIX. That’s largely because the TSX is more concentrated in sectors like financials, energy, and materials, which are less growth-driven and often less sensitive to sharp sentiment swings compared to high-growth tech-heavy segments in the US market. As a result, Canadian markets often experience fewer extreme price moves, which keeps implied volatility relatively subdued.
The VIXC opened the week at 15.05, slightly higher than the previous week’s close of 14.72, as stronger-than-expected inflation data briefly raised concerns about the possibility of tighter interest rate policy in both Canada and the US From there, volatility remained fairly contained, trading mostly in the 15–16 range, with only brief dips into the high 14s as markets reassessed the outlook.
By the end of the week, those early concerns had eased, and the index settled at 14.70 essentially back in line with the previous week’s levels. Overall, Canadian volatility remained steady, with only a short-lived reaction to shifting inflation and interest rate expectations.
US Economic news
This past week’s key data points that the Federal Reserve (Fed) considers when deciding whether to raise or lower the interest rate.
Inflation and Economic Growth
Personal Consumption Expenditures (PCE)
May’s Personal Consumption Expenditures (PCE) report came in largely as expected, but it reinforced a key theme: inflation is still running above the Fed’s comfort zone. The Bureau of Economic Analysis’ (BEA) PCE price index, the Fed’s preferred inflation gauge, showed consumer prices rising 0.4% in May. On an annual basis, inflation accelerated to 4.1% from 3.8% in April, marking its highest level since April 2023 and the first time in nearly three years that PCE inflation has moved above 4%.
Core PCE, which strips out food and energy to better capture underlying trends, rose 0.3% in May after a 0.2% increase in April. On an annual basis, core inflation edged up to 3.4% from 3.3%, remaining well above the Fed’s 2% target.
The main driver was energy. Oil prices surged during May as the US-Iran conflict raised concerns about potential disruptions to Middle Eastern supply. That pushed headline inflation higher, similar to the role gasoline prices played in Canada’s recent CPI report. The encouraging part is that oil prices have since fallen as tensions eased, meaning some of the inflation pressure in the report may already be reversing. Still, core inflation remains elevated, showing that underlying price pressures have not fully cooled.
The message from the report is that the headline inflation spike looks more energy-driven than broad-based. However, with core inflation still stuck above target, the Fed is unlikely to lower rates in the near term.
Gross Domestic Product (GDP)
The BEA’s third and final estimate of first quarter GDP showed the US economy grew at an annualized rate of 2.1%, up from the previous estimate of 1.6% and ahead of expectations. That also marks a clear step up from the 0.5% growth recorded in the fourth quarter of 2025, suggesting the economy regained momentum at the start of the year.
At first glance, this points to a stronger and more resilient economy than previously thought.
However, the details were less impressive. Much of the upward revision came from lower imports. Since imports are subtracted in GDP calculations, a decline can lift growth even if underlying demand hasn’t improved. At the same time, consumer spending – the main engine of the economy – was revised sharply lower to just 0.5%, its weakest pace in four years.
One area that did stand out was business investment, particularly spending on equipment and AI-related infrastructure, which continued to support growth. Overall, while the headline number improved, the underlying momentum looks more modest than it appears at first glance.
Combined Takeaway
Put together, the GDP and PCE reports tell a balanced but slightly uncomfortable story. The economy is still growing at a solid pace, suggesting resilience in overall activity, but inflation is moving further away from the Fed’s 2% target, even if much of the increase is tied to energy.
That combination leaves the Fed in a difficult position. Growth is not weak enough to justify cutting rates, while inflation is not low enough to declare victory. As a result, the Fed is likely to stay cautious and data-dependent in the months ahead, watching closely to see whether underlying inflation continues to ease.
For us investors, the takeaway is straightforward. Even if the inflation spike proves temporary, the broader picture still points to an environment where interest rates may stay higher for longer than many had expected.
Consumer Sentiment Index (CSI)
The University of Michigan’s June Consumer Sentiment Index came in at 49.5, slightly below expectations of 50. That still marked a 10.5% increase from May, but sentiment remains 18.5% lower than June 2025 levels.
Looking deeper, the improvement was fairly broad. The Current Economic Conditions Index – which reflects how consumers feel about their finances and job security today – rose 4.1% to 47.7, up from 45.8 in May, but still 26.4% lower than a year ago. Meanwhile, the Expectations Index, which measures how consumers feel about the economy over the next six months, climbed a stronger 15.0% to 50.7, though it remains 12.7% below June 2025 levels.
While the latest reading is a step in the right direction, consumer confidence remains unusually weak by historical standards. Many Americans continue to feel the strain of higher prices, even as inflation has cooled considerably from its 2022 peak. However, one of the more encouraging takeaways wasn’t just the sentiment reading itself – it was the continued easing in inflation expectations. Consumers now expect prices to rise 4.6% over the next year, down from 4.8% in May, while longer-term expectations also edged lower.
For us investors, this report largely reinforces what we saw earlier in the week from the PCE inflation data. Inflation pressures continue to ease, but consumers are still feeling the impact of elevated everyday costs. As a result, this report is unlikely to shift the Fed’s outlook on its own, but it adds another data point suggesting inflation expectations are slowly moving in the right direction.
American Market Volatility
The VIX, often referred to as the market’s “fear gauge,” measures expected volatility in the S&P 500 over the next 30 days. In simple terms, it reflects how much uncertainty investors are pricing into markets, rising when fear picks up and easing when conditions calm. Readings above 20 are generally associated with elevated volatility, while levels below that suggest more stable conditions.
The index began the week at 17.48, with markets initially focused on geopolitical headlines after renewed concerns that the Middle East peace agreement could face setbacks. Sentiment then shifted as a new wave of uncertainty around AI-related spending weighed on technology stocks, pushing volatility higher.
The VIX climbed into the 18–20 range, briefly breaking above 20 on several occasions, signalling short bursts of increased market anxiety. The week’s peak came in at 20.72, its highest level in more than two weeks.
However, those spikes proved short-lived. As markets stabilised into the end of the week, volatility cooled and the VIX finished at 18.41, still slightly above where it started, but well below the mid-week highs.
Weekly Market and Portfolio Review
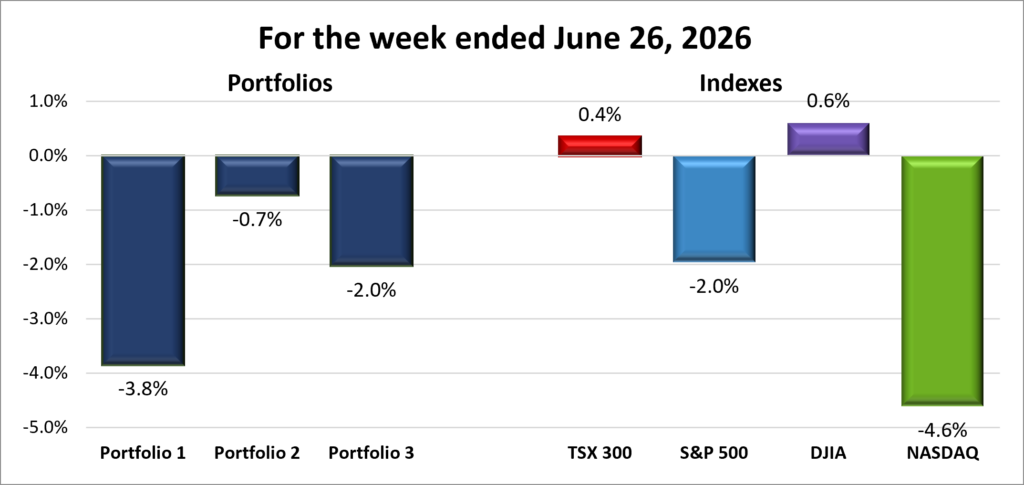
For the week, the TSX (SPTSX) gained 0.4%, the S&P 500 (SPX) dropped 2.0%, the DJIA (INDU) climbed 0.6% and the Nasdaq (CCMP) shed 4.6%.
| Index | Weekly Streak |
| TSX: | 1 – week winning streak |
| S&P: | 1 – week losing streak |
| DJIA: | 3 – week winning streak |
| Nasdaq: | 1 – week losing streak |
![]()
![]() This week, the markets never really got off the mark. The S&P 500 Index (S&P) and the Nasdaq Composite Index (Nasdaq) both lost ground from the start and spent most of the week moving lower. The Toronto Stock Exchange Composite Index (TSX) got off to a better start but slipped into negative territory mid-week before recovering to finish slightly higher. Meanwhile, the Dow Jones Industrial Average (DJIA) was the only major index to stay in positive territory all week.
This week, the markets never really got off the mark. The S&P 500 Index (S&P) and the Nasdaq Composite Index (Nasdaq) both lost ground from the start and spent most of the week moving lower. The Toronto Stock Exchange Composite Index (TSX) got off to a better start but slipped into negative territory mid-week before recovering to finish slightly higher. Meanwhile, the Dow Jones Industrial Average (DJIA) was the only major index to stay in positive territory all week.
In the US, the week began with renewed concerns about the Middle East after President Trump suggested strikes on Iran could resume if the peace agreement failed. Those worries faded as oil tankers resumed travelling through the Strait of Hormuz and oil prices fell back to where they were before the conflict began.
Investors quickly turned their attention back to artificial intelligence (AI). Growing concerns about how much money the largest technology companies are spending on AI, and whether those investments will generate enough profits, weighed on the market throughout the week. Those concerns came to a head on Tuesday, when a sharp selloff in semiconductor and AI-related companies sent the Nasdaq down 3.3% in a single day.
Because the S&P and Nasdaq are heavily weighted toward the largest technology companies, the weakness spread across both indexes for much of the week. Other sectors held up better, but they weren’t enough to overcome the drag from the technology sector.
By the end of the week, investors shifted their focus once again, this time to inflation and interest rates. Inflation data came in largely as expected, while GDP growth was stronger than economists had forecast. Together, the reports suggested the US economy remains in good shape, giving the Fed little reason to rush into changing interest rates.
In Canada, the TSX followed a different path. Rather than technology, the biggest story was the battle between lower oil prices and rising metal prices.
Energy stocks came under pressure as Brent and WTI crude oil prices fell throughout the week, returning to levels seen before the recent Middle East conflict. Lower oil prices weighed on many of Canada’s oil and gas producers which in turn weighed on the TSX because energy makes up such a large part of the index.
At the same time, the basic materials sector (mining and fertilizer companies) helped lift the market. Gold and other metal prices climbed as investors moved toward assets that have historically held their value during uncertain periods. Higher gold prices boosted many of Canada’s largest mining companies, helping offset much of the weakness in the energy sector and reinforcing the back-and-forth between rising metals and falling oil prices.
Outside of the resource sectors, there was little Canadian economic news that significantly influenced the market. Instead, the TSX was largely shaped by the balance between falling energy stocks and rising mining and materials companies.
Overall, the US and Canadian markets told two different stories. In the US, concerns about AI spending weighed heavily on technology stocks, while in Canada, the direction of oil and metal prices had the biggest influence on the TSX. Even so, both markets ended the week with the same underlying message: investors remained cautious but were encouraged by signs that inflation continues to cool and the economy remains resilient. That helped keep volatility relatively contained despite another week of shifting headlines.
| Portfolio | Weekly Streak |
| Portfolio 1: | 1 – week losing streak |
| Portfolio 2: | 1 – week losing streak |
| Portfolio 3: | 1 – week losing streak |
![]() With the Nasdaq and S&P 500 both finishing the week in the red, it wasn’t surprising that my growth-oriented portfolios also came under pressure. That weakness in the major indexes fed directly into portfolio performance, snapping each portfolio’s run of winning weeks at two.
With the Nasdaq and S&P 500 both finishing the week in the red, it wasn’t surprising that my growth-oriented portfolios also came under pressure. That weakness in the major indexes fed directly into portfolio performance, snapping each portfolio’s run of winning weeks at two.
The pullback was most concentrated in the AI and semiconductor space, which has been one of the key drivers of markets over the past couple of years. That created a challenging backdrop for portfolios with higher exposure to technology. Nvidia (NASDAQ: NVDA), the largest holding in Portfolios 1 and 3, fell about 9% on the week as concerns around AI-related spending weighed on the sector. Given its large weighting in both portfolios, that decline alone created a significant headwind before considering the weakness across other technology holdings.
Portfolio 1 took the biggest hit, finishing the week down 3.8%. Just 42% of holdings ended the week higher, with weakness spread across much of the portfolio. Technology companies were the biggest drag, particularly chipmakers. Navitas Semiconductor (NASDAQ: NVTS) fell 29%, Lattice Semiconductor (NASDAQ: LSCC) lost 11%, and Nvidia all had a tough week. Kraken Robotics (TSEV: PNG) added to the pressure, dropping 18%. Put it all together, and it wasn’t surprising that Portfolio 1 recorded the largest decline of the three portfolios.
Portfolio 2 had the ‘best’ week of the three portfolios thanks to its broader mix of companies, finishing the week down ‘only’ 0.7%. It had the lowest share of weekly winners at 41%, but losses were generally smaller in magnitude compared to the other portfolios. Gains from Alimentation Couche-Tard (TSE: ATD) and Guardant Health (NASDAQ: GH), both up 13%, and Mitek Systems (NASDAQ: MITK), up 12%, helped limit the decline. TC Energy (TSE: TRP) and iA Financial (TSE: IAG) also reached new highs during the week, adding some stability to the portfolio’s performance.
Portfolio 3 was also dragged lower by its heavier weight in technology, declining 2.0%. The biggest declines came in Rocket Lab (NASDAQ: RKLB), down 20%, 5N Plus (TSE: VNP), down 13%, MDA Space (TSE: MDA), down 12%, Vertiv Holdings (NYSE: VRT) and Broadcom (NASDAQ: AVGO), both down 11%. Corning (NYSE: GLW) stood out on the positive side, rising 10% and providing one of the few bright spots in an otherwise volatile week.
Overall, it was a weaker week across all three portfolios, driven mainly by short-term pressure in AI and technology stocks. As Trooper puts it, “every now and then a little rain must fall.” 😊 Even so, the longer-term investment themes remain unchanged, and this kind of volatility is a normal part of investing in higher-growth areas of the market. Hopefully, the sun shines a little brighter next week. 😊
Companies on the Radar
 There was very little activity on my radar this past week. No new companies caught my attention, and I was preparing to remove Perimeter Solutions (NYSE: PRM) from the list. However, after running my Quick Test on the company, I reconsidered.
My main concern is that Perimeter appears to be something of a one-trick pony, with roughly 75% of its revenue coming from specialty fire retardant and suppression products. If a larger chemical company decided to enter this niche market, Perimeter could potentially face pressure on both pricing and market share.
What changed my view was the strength of the company’s moat. My Quick Test revealed advantages built on brand recognition, cost competitiveness, and significant regulatory barriers. To be used by aerial firefighting agencies, retardants must spend years on the government’s Qualified Product List. Government agencies are understandably reluctant to switch to unproven products, especially when lives, property, and natural resources are at stake.
The company also benefits from a powerful, yet unfortunate, long-term tailwind. Wildfire seasons across North America and Europe are becoming longer, more severe, and increasingly unpredictable. As a result, governments continue to increase spending on aerial firefighting and preventative fire suppression efforts.
With this new perspective, I’ve decided to keep Perimeter on my radar for now. It doesn’t profile as a high-growth company, but its monopoly-like characteristics, combined with steady demand growth, could make it an attractive defensive investment.
As a result, the same four companies remain on my radar this week:
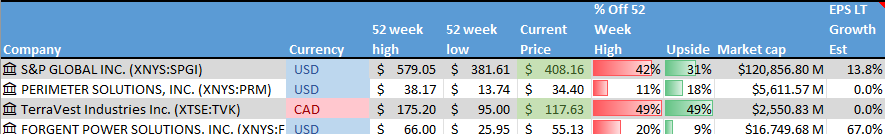
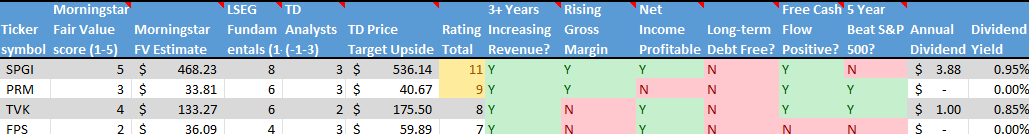
- S&P Global (NYSE: SPGI): A large cap American company and one of the world’s most important financial information companies. Most investors know it for the S&P 500 Index, but the business also provides credit ratings, market data, analytics, and research used by banks, corporations, governments, and investors worldwide. Think of it as one of the key information providers that helps global financial markets function, generating revenue through subscriptions, licensing fees, and rating services.
- Perimeter Solutions: An American mid-cap company that produces specialty chemicals. Its best-known products are the fire retardants used to fight wildfires. If you’ve seen aircraft dropping bright red retardant over a wildfire, there’s a good chance it came from Perimeter. The company operates in a niche but essential market, supplying products and services that help protect communities, infrastructure, and natural resources during increasingly active wildfire seasons.
- TerraVest Industries (TSE: TVK): A mid-cap Canadian industrial company that produces equipment for energy, storage, and transportation markets, including propane tanks, pressure vessels, and heating systems. It grows through a mix of organic expansion and acquisitions, serving steady, asset-heavy industrial niches across North America.
- Forgent Power Solutions (NYSE: FPS): An American large-cap industrial company that builds the electrical infrastructure needed to power data centres, factories, and other large facilities. In simple terms, it makes the equipment that helps move electricity from the grid to where it is needed. It’s not the company building AI models, but rather one of the companies supplying the critical infrastructure that helps keep the AI boom running.
As always, these are not buy recommendations. Make sure to do your own research and choose investments that fit your personal financial goals.
The Radar Check was last updated June 26, 2026.
That’s a wrap for this week, thanks for reading – may your portfolio stay green and your dividends steady. See you next time!