
The AI Revolution: Understanding the Technology Behind the Investment Boom?
Part 1: What Is Artificial Intelligence?
If you’ve been following the stock market over the past couple of years, you’ve probably noticed that artificial intelligence (AI) has become one of the hottest topics in investing. This week, I’d like to begin a short series exploring one of the biggest investment themes of the decade: AI.
Nearly every earnings call now mentions AI. Technology companies such as Microsoft (NASDAQ: MSFT) and Alphabet’s (NASDAQ: GOOGL) Google are spending hundreds of billions of dollars building AI infrastructure, while businesses across almost every industry are looking for ways to incorporate AI into their products and services. Yet despite all the attention, many people still aren’t sure what AI actually is or why it has become so important.
Before we can understand why companies are investing so heavily in AI, it helps to first understand what AI is – and what it isn’t.
So what exactly is artificial intelligence?
At its core, AI is computer software designed to perform tasks that normally require human intelligence. Unlike traditional software that follows a fixed set of instructions, AI is trained by showing it enormous amounts of information and allowing it to learn patterns from that information. The result is an AI model – the trained system that allows applications like ChatGPT, Gemini, and Claude to answer questions, solve problems, recognize images, write computer code, and make predictions.
You’ve probably used AI already, even if you didn’t realize it. When Netflix (NASDAQ: NFLX) recommends a movie, Google predicts what you’re searching for, or your email automatically filters out spam, AI is working behind the scenes. More recently, tools like ChatGPT, Gemini, and Claude have introduced millions of people to a new generation of AI by allowing them to have natural conversations, write documents, generate images, and even help write computer code.
Although AI can sometimes seem remarkably human, it doesn’t think the way people do.
Human intelligence is shaped by experience, common sense, emotions, curiosity, and an understanding of the world around us. AI has none of these qualities. It doesn’t have opinions, beliefs, or feelings, and it doesn’t truly understand the information it generates.
Instead, today’s AI works by identifying patterns learned from the vast amounts of data used during its training. When you ask it a question, it analyzes your request and predicts the response that is most likely to be helpful based on everything it has learned. In other words, AI isn’t reasoning like a person – it’s making incredibly sophisticated predictions at extraordinary speed.
That distinction is important because today’s AI is often better described as an extremely powerful assistant than an artificial brain. It can summarize reports in seconds, analyze large amounts of information, translate languages, write software, and help doctors, engineers, researchers, and even blog writers work more efficiently. However, it still makes mistakes, can misunderstand context, and requires human oversight for many important decisions.
For investors, understanding what AI is – and what it isn’t – helps separate reality from hype. AI has the potential to transform industries much like the internet did, but it’s not magic. Behind every AI-generated answer is an enormous amount of data, computing power, and infrastructure, which is why so many companies are investing heavily in this technology.
Next week, we’ll explore how an AI model is built – from the enormous datasets used to train it to the powerful computers that make it all possible. Understanding that process helps explain why companies like Microsoft, Alphabet, and Amazon (NASDAQ: AMZN) are investing hundreds of billions of dollars in AI infrastructure.
AI may be one of the biggest investment themes of the decade, and it continues to drive market sentiment, both up and down. However, markets don’t move based on one trend alone. With that in mind, let’s look at what happened in the markets this week and how my three portfolios performed.
Items that may only interest or educate me ….
Canadian Economic news, US Economic news, ….
Canadian Economic news
This past week’s key economic data that the Bank of Canada (BoC) considers when deciding whether to raise or lower the interest rate.
Consumer Price Index (CPI)
Statistics Canada’s June CPI report brought some welcome news, with inflation cooling more than expected and easing concerns that the BoC may need to keep interest rates higher for longer or possibly raise them. Consumer prices fell 0.4% from May, the largest monthly decline since December 2024, reversing much of the previous month’s 1.0% increase. On an annual basis, inflation slowed to 2.8% in June from 3.2% in May, largely because gasoline prices fell sharply as concerns over potential oil supply disruptions in the Middle East eased.
Beneath the headline, gasoline was by far the biggest contributor to the monthly decline, falling 10.2% and reversing much of its earlier surge. At the other end of the spectrum, alcoholic beverages, tobacco products, and recreational cannabis posted the largest monthly increase, rising 0.3%. Compared with a year ago, gasoline prices were still up 20.8%, while household operations, furnishings and equipment was the only major category to record an annual decline, slipping 0.2%. Shelter costs, which include rent and mortgage interest, continued to edge higher, rising 0.1% during the month and 1.5% over the past year.
The BoC’s preferred core inflation measures, which exclude volatile items such as food and energy to provide a clearer picture of underlying inflation, rose 0.3% during the month and were up just 1.8% from a year earlier. That marks the first time since 2020 that core inflation has fallen below the Bank’s 2% target, suggesting underlying price pressures are easing rather than the improvement being driven solely by lower gasoline prices.
For us investors, this report is modestly positive. Lower inflation reduces the likelihood that interest rates will need to remain elevated for longer and increases the chances of gradual rate cuts over time. That’s generally supportive for interest-rate-sensitive sectors such as technology, real estate, and utilities.
The encouraging news comes with one important caveat. Much of the improvement was driven by lower gasoline prices. If oil prices climb again because of renewed geopolitical tensions, inflation could reverse course in the coming months.
Retail Sales
Statistics Canada reported that retail sales rose 1.0% in May, matching expectations and accelerating from April’s 0.5% increase. It marked the fifth consecutive month of sales growth, suggesting consumer spending remained resilient despite higher interest rates. On a year-over-year basis, retail sales increased 5.9%, up from 3.7% in April.
Gasoline stations and fuel vendors led the monthly gains, with sales rising 3.1% as higher fuel prices pushed up spending at the pump – a factor that also boosted the headline retail sales figure. Food and beverage retailers posted the smallest increase, with sales edging up 0.5%. Over the past year, gasoline sales surged 28.2%, largely reflecting higher prices rather than greater fuel consumption. Meanwhile, furniture, electronics, and home furnishings stores remained the weakest major category, with sales falling 6.1%.
At first glance, the report looks strong. However, retail sales measure the dollar value of purchases, not the quantity of goods consumers buy. As a result, higher gasoline prices can make retail sales appear stronger than underlying consumer demand. That was the case in May: retail sales rose 1.0% in dollar terms, but after adjusting for price changes, sales volume increased just 0.3%.
For a clearer picture of underlying consumer spending, economists also look at core retail sales, which exclude the more volatile gasoline, motor vehicle, and parts categories. On that measure, sales rebounded 0.9% in May after falling 0.7% in April. Year over year, core retail sales increased 4.3%, up from 3.4% in April.
Overall, Canadian consumers continued to spend in May, although higher gasoline prices inflated the headline figure. Even so, the rebound in core retail sales and broad-based gains across most retail categories suggest household spending remained resilient despite higher interest rates – another sign the Canadian economy continues to show underlying strength.
Canadian Market Volatility
Canada’s equivalent of the VIX is the S&P/TSX 60 VIX Index (VIXC). Like its US counterpart, it measures how much volatility investors expect in the Canadian stock market over the next 30 days. Higher readings signal greater uncertainty, while lower readings suggest investors are feeling more confident.
Unlike the VIX, however, the VIXC typically trades at lower levels. One reason is that Canada’s market has less exposure to high-growth technology companies, which can experience larger swings in investor sentiment. Instead, the TSX has heavier weightings in financials, energy, and basic materials (such as gold) – sectors that are often more closely tied to economic conditions and commodity prices but generally experience less dramatic price movements.
The VIXC opened the week at 15.20, above the previous week’s close of 14.62, as renewed Middle East tensions increased uncertainty. The fear gauge remained close to the 15 level for most of the week, briefly dipping below 14 midweek as strength in commodity prices supported Canadian equities. However, a global market sell-off triggered by renewed oil price concerns pushed the VIXC back above 15 before it closed the week at 14.88.
Although Canadian markets faced many of the same challenges as their US counterparts – including geopolitical tensions, inflation concerns, and an AI-related sell-off – the VIXC remained well below the US VIX throughout the week. Despite the uncertainty, Canadian investors appeared considerably calmer than their US counterparts.
US Economic news
This past week’s key data points that the Federal Reserve (Fed) considers when deciding whether to raise or lower the interest rate.
American Market Volatility
The VIX – often called the market’s “fear gauge” – measures expected volatility in the S&P 500 over the next 30 days. In simple terms, it reflects how much uncertainty investors expect in the market. The index typically rises when investors become more cautious and falls as confidence returns. Readings above 20 are generally associated with elevated volatility, while levels below 20 usually indicate a calmer market environment.
The VIX opened the week at 18.92, slightly above the previous week’s close of 18.74, as ongoing Middle East tensions kept investors cautious. However, optimism surrounding AI and anticipation of upcoming technology earnings helped ease concerns during the first half of the week, pushing the VIX below 17. That calm proved temporary as renewed worries about AI infrastructure spending and oil supply disruptions triggered a market pullback, briefly sending the VIX above 20 before it settled back and closed the week at 18.58.
Weekly Market and Portfolio Review
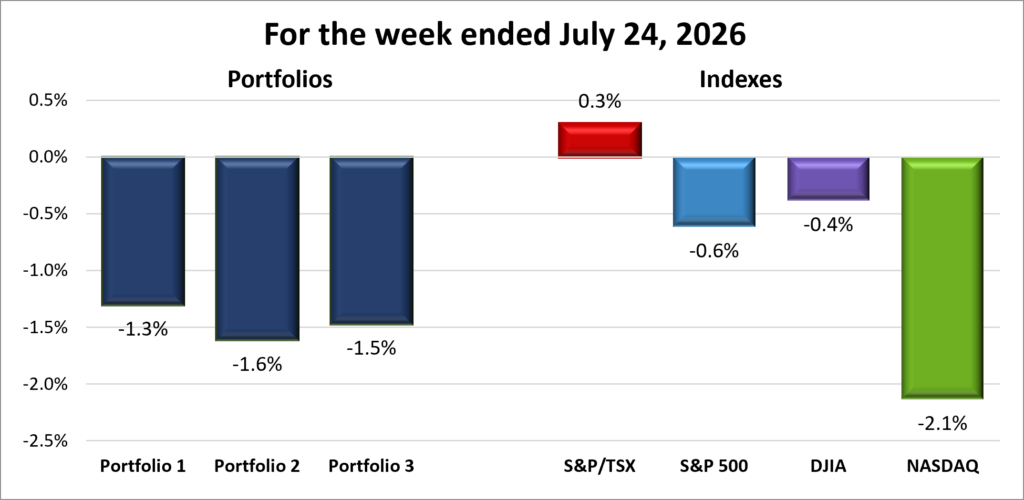
For the week, the TSX (SPTSX) was the sole index to advance with a gain of 0.3%, while the S&P 500 (SPX) lost 0.6%, the DJIA (INDU) dipped 0.4% and the Nasdaq (CCMP) sunk 2.1%.
| Index | Weekly Streak |
| TSX: | 1 – week winning streak |
| S&P: | 2 – week losing streak |
| DJIA: | 3 – week losing streak |
| Nasdaq: | 2 – week losing streak |

 Investors endured another volatile week as North American markets swung between record highs and sharp reversals. The Toronto Stock Exchange Composite Index (TSX) briefly reached another record high before falling sharply alongside US markets, but a late-week rebound helped it finish slightly higher. In contrast, US markets remained under pressure as the Nasdaq Composite Index (Nasdaq) fell more than 2%, while both the S&P 500 Index (S&P) and the Dow Jones Industrial Average (DJIA) lost more than 1%. The technology-heavy Magnificent 7 stocks alone shed roughly US$797 billion in market value, their steepest one-day decline since the tariff-driven sell-off in April 2025. It was a reminder of how quickly investor sentiment can change.
With little economic data to guide markets, attention shifted to corporate earnings, AI, and geopolitics. After months of gains driven by AI enthusiasm, investors wanted evidence that the massive investments in AI infrastructure were beginning to generate meaningful returns. Instead, they found themselves questioning whether spending was rising faster than the benefits.
That concern intensified as several technology giants reported earnings. While demand for AI products and services remained strong, investors questioned whether the enormous spending would translate into profits quickly enough. Alphabet delivered another quarter of solid revenue growth and highlighted strong demand for its AI services but plans to further increase AI-related capital spending disappointed investors. The reaction reflected a broader shift in expectations: strong AI growth alone was no longer enough. Investors wanted proof that today’s investments would lead to tomorrow’s profits.
Adding to investor concerns, renewed tensions in the Middle East pushed energy markets back into focus. A fragile ceasefire between the U.S. and Iran collapsed, while attacks involving Iran and its allies raised concerns about disruptions to global oil supplies. The Strait of Hormuz, which normally carries about one-fifth of the world’s oil, once again became a key flashpoint. Concerns grew further after Iran-backed Houthi forces in Yemen targeted shipping through the Bab el-Mandeb Strait in the Red Sea, another critical trade route connecting Europe and Asia. With two of the world’s most important energy corridors facing potential disruption and global inventories already low, fears of supply shortages pushed Brent crude above US$100 a barrel before easing to finish the week above US$96.
Concerns extended beyond higher energy costs. Rising oil prices threatened to reignite inflation just as price pressures had begun to ease, potentially making it harder for the Fed to lower interest rates. Combined with questions surrounding AI spending, renewed geopolitical uncertainty gave investors another reason to lock in profits after months of strong market gains.
Trade policy came back to the forefront after the US imposed a new round of tariffs on imports from 60 trading partners. While the announcement had little immediate impact on markets, it added another source of uncertainty by raising the prospect of higher import costs, renewed inflation pressures, and retaliatory measures.
In Canada, the TSX benefited from a very different set of market drivers. Its heavier weighting toward energy, financials, and mining companies helped shield it from the technology-led sell-off affecting the major US indexes. Higher oil prices supported Canadian producers, while mining companies benefited as investors sought the relative safety of gold and other precious metals. Together, these sectors helped push the TSX to another record high during the week and ultimately outperform the major US indexes.
Trade policy also provided support for Canadian investors after the US confirmed that Canadian energy exports and critical minerals would be excluded from its latest tariffs. This helped ease concerns that some of Canada’s most important industries would become caught up in the dispute.
The week was a good reminder that different markets can be driven by different forces. While the American markets were dominated by AI spending, the Middle East, and interest rates, Canada’s resource-heavy market benefited from higher prices for oil, gold, and other commodities. Investors should look beyond the headlines and understand the factors driving each market, as a selloff in one area does not mean opportunities have disappeared elsewhere.
| Portfolio | Weekly Streak |
| Portfolio 1: | 2 – week losing streak |
| Portfolio 2: | 3 – week losing streak |
| Portfolio 3: | 2 – week losing streak |
With AI volatility, rising oil prices, and renewed concerns that inflation and interest rates could remain higher for longer, it proved to be a difficult week for my technology-heavy portfolios. Fewer than 30% of the holdings in any portfolio finished the week higher. While there were no dramatic sell-offs, a steady stream of modest declines was enough to push all three portfolios lower. Fortunately, gains from several energy holdings helped soften the overall impact.
Portfolio 1 held up the best, slipping just 1.3%. Although only 27% of its holdings finished the week higher, CN Rail (TSE: CNR) reached a new record high and Nvidia (NASDAQ: NVDA) bucked the broader technology weakness with a modest gain, helping limit the overall decline.
Portfolio 2 recorded the largest loss, falling 1.6%. Ironically, it also had the highest percentage of weekly winners at 29%, but that is hardly a reason to celebrate. Like the other portfolios, there were no major blowups. Instead, the decline came from the sheer number of stocks that finished slightly lower, with those small losses gradually adding up over the course of the week.
Portfolio 3 declined 1.5% and had the fewest weekly winners, with just 19% of its holdings finishing higher. Fortunately, Nvidia, the portfolio’s largest holding, gained ground alongside several energy positions, helping cushion what could have been a steeper decline.
There weren’t many highlights this week, so this is one I’ll gladly put in the rear-view mirror. Fortunately, next week brings several potential market-moving events, including another round of mega-cap technology earnings, the Fed’s interest rate decision, key economic reports, and hopefully renewed peace talks in the Middle East. That should be plenty to move the markets and keep investors on their toes. 😊
Companies on the Radar
 My stock investing radar had a little more activity this past week with the addition of Mattr Corp. (TSE: MATR), while SK hynix (NASDAQ: SKHY) moved off my radar and onto the backburner.
Mattr is a Canadian industrial technology company that designs and manufactures specialized infrastructure products using advanced materials. The company may not be familiar to most investors, but its products support industries such as energy, electrification, communications, transportation, and water management. From composite pipes and underground storage tanks to specialized wire and cable solutions, Mattr creates products designed to be lighter, more durable, and resistant to harsh environments. Think of it as a behind-the-scenes supplier helping modern infrastructure operate more safely and efficiently, generating revenue by selling specialized products to industrial customers around the world.
I must admit, I was hesitant to move SK hynix to the backburner given its impressive performance over the past year. The company’s Korean-listed shares have gained more than 700% as AI demand created a powerful tailwind for memory chip manufacturers, helping drive investor interest and leading to its recent Nasdaq listing. However, Portfolios 1 and 3 are already heavily weighted toward AI and technology, and adding a cyclical semiconductor stock would increase their risk exposure even further. As for Portfolio 2, SK hynix doesn’t fit the portfolio’s more conservative profile of stable companies with reasonable growth and reliable dividends.
With these changes, my radar list remains at five companies, but with one new face added.
- Perimeter Solutions (NYSE: PRM): An American mid-cap company that produces specialty chemicals. Its best-known products are the fire retardants used to fight wildfires. If you’ve seen aircraft dropping bright red retardant over a wildfire, there’s a good chance it came from Perimeter. The company operates in a niche but essential market, supplying products and services that help protect communities, infrastructure, and natural resources during increasingly active wildfire seasons.
- TerraVest Industries (TSE: TVK): A mid-cap Canadian industrial company that produces equipment for energy, storage, and transportation markets, including propane tanks, pressure vessels, and heating systems. It grows through a mix of organic expansion and acquisitions, serving steady, asset-heavy industrial niches across North America.
- Forgent Power Solutions (NYSE: FPS): An American large-cap industrial company that builds the electrical infrastructure needed to power data centres, factories, and other large facilities. In simple terms, it makes the equipment that helps move electricity from the grid to where it is needed. It’s not the company building AI models, but rather one of the companies supplying the critical infrastructure that helps keep the AI boom running.
- S&P Global (NYSE: SPGI): A large cap American company and one of the world’s most important financial information companies. Most investors know it for the S&P 500 Index, but the business also provides credit ratings, market data, analytics, and research used by banks, corporations, governments, and investors worldwide. Think of it as one of the key information providers that helps global financial markets function, generating revenue through subscriptions, licensing fees, and rating services.
As always, these are not buy recommendations. Make sure to do your own research and choose investments that fit your personal financial goals.
The Radar Check was last updated July 24, 2026.


Portfolio Update
Portfolio 2
Sold: Brookfield Renewables Corporation (TSE: BIPC) As an owner of Brookfield Infrastructure Partners (TSE: BIP.UN), I received BIPC shares in 2020 when Brookfield introduced a traditional corporate share class alongside its existing limited partnership units. The goal wasn’t to create a new business. Instead, Brookfield wanted to make its infrastructure business easier for more investors to own, including index funds and institutions that couldn’t or preferred not to invest in partnership units.
Although BIPC and BIP.UN trade under different ticker symbols, they’re designed to provide the same economic exposure. They own the same underlying assets, generate the same cash flows, and pay the same distributions.
Since both securities provide essentially the same economic exposure, I didn’t see a reason to own both in my TFSA. BIPC had been trading at a premium to BIP.UN, despite representing the same business. By selling my BIPC shares and reinvesting the proceeds into BIP.UN on a dip, I will be able to own more units of Brookfield Infrastructure without adding any new capital.
This wasn’t a decision based on growth potential or income, as both securities are designed to deliver the same long-term results. It was simply a valuation decision. When two securities represent essentially the same business but one trades at a higher price, I generally prefer to own the cheaper one. As a bonus, it also reduces the number of holdings I need to monitor. 😊
Sold: South Bow (TSE: SOBO) When TC Energy (TSE: TRP) spun off its liquids pipeline business into South Bow in October 2024, I automatically received shares of the new company as an existing TC Energy shareholder. Spin-offs like this are fairly common and give investors the opportunity to own shares in both the original company and the newly independent business.
I held onto my SOBO shares because of its reliable dividend, but recently I’ve been working to consolidate the number of companies in Portfolio 2. Since my position was relatively small and my conviction wasn’t particularly high, I decided to sell my SOBO shares and redeploy the proceeds into an investment opportunity where I have greater long-term conviction.
South Bow is a well-run pipeline company with stable cash flows and may appeal to investors looking for reliable dividend income. However, with limited capital to invest, I want to focus on the companies that offer the best combination of quality, opportunity, and long-term potential. The proceeds from the sale will likely be used to increase my exposure to another holding in the portfolio where I see a stronger opportunity for future returns.
This decision wasn’t a reflection of South Bow being a poor investment. Rather, it was a portfolio management decision – reducing the number of holdings I need to monitor and making sure each position has a meaningful role in my portfolio.
That’s a wrap for this week, thanks for reading – may your portfolio stay green and your dividends steady. See you next time!