
November has a reputation for being a standout month for the stock market, and the numbers back it up. Over the past 30 years, the S&P 500 has posted gains in 23 Novembers, with a solid median return of 2.8%. But when it is an election year, there is always a little more drama. While pre-election uncertainty can cause some bumps, markets tend to rally once the results are in and stability returns.
This year is no different: we are not only dealing with a closely contested election, but also a key Federal Reserve (Fed) decision on US interest rates. On top of that, November kicks off the “best three months” for stocks—alongside December and January—adding to its seasonal strength.
Canadian markets also tend to fare well in November. Historically, the Toronto Stock Exchange has seen positive performance, driven by rising commodity prices (especially oil and gold) and strong corporate earnings reports. The energy sector, in particular, often benefits from increased seasonal demand and geopolitical factors affecting oil prices.
With so many factors at play, November shines bright on the financial calendar. But as always, the market’s unpredictability means nothing is ever a sure bet. It is a fascinating blend of historical trends, market psychology, and real-time events all coming together in this action-packed month.
That said, it is important to remember that past performance does not guarantee future results. Current economic conditions, corporate earnings, and global events can all shape how the market performs, so it is always wise to stay informed and prepared.
Before we turn our attention to next week’s election, the Fed’s next move, and key economic indicators, let’s take a look at what unfolded over the past week.
Items that may only interest or educate me ….
Canadian Economic news, US Economic news, ….
Canadian Economic news
This past week’s key economic data that the Bank of Canada (BoC) considers when deciding whether to raise or lower the interest rate.
Gross Domestic Product (GDP)
Statistics Canada reported that GDP for August remained flat, following a revised 0.1% growth in July (down from the initial 0.2%), matching analysts’ expectations. On an annual basis, GDP has grown by 1.3%.
Digging deeper, the “Goods-producing sector’ declined by 0.4% in August. The biggest gainer was ‘Agriculture, forestry, fishing, and hunting,’ up 0.4%, while ‘Utilities’ saw a sharp 1.9% drop. On the services side, the sector posted a slight 0.1% increase, with ‘Finance and insurance’ and ‘Public administration’ leading at 0.5%. ‘Management of companies and enterprises’ was the hardest hit, down 3.7%.
Year-over-year, the ‘Goods-producing industries’ shrank by 0.5%, with ‘Agriculture, forestry, fishing, and hunting’ growing by an impressive 8.2%, though it could not offset declines led by a 4.0% drop in ‘Manufacturing’. Meanwhile, ‘Services-producing industries’ grew 1.9%, driven by a 3.5% rise in ‘Finance and insurance,’ while the much smaller ‘Management of companies and enterprises’ category continued its steep decline, dropping 32.5%.
August’s sluggish performance puts Canada’s economy on track for just 1.0% growth in the third quarter, falling well short of the BoC’s 1.5% forecast. High interest rates, which continue to weigh on consumers and businesses, alongside work stoppages at Canada’s two largest rail companies, were key contributors to the weaker-than-expected GDP. While the recent 0.5% rate cut may provide some relief, this latest data will likely grab the BoC’s attention and leave the door open for another potential jumbo sized 0.5% cut at their December 11 meeting. Before making any decisions, the central bank will have time to assess the final third-quarter GDP figures, as well as upcoming inflation and labour reports.
Preliminary data suggests GDP grew by 0.3% in September, with a finalized estimate set to be released on November 29, 2024.
Canadian market volatility
Canada’s Volatility Index (CVIX) opened the week at 11.28 and was relatively stable throughout, rising to 12.17 at Friday’s close. This late surge was likely the result of uncertainty over next week’s US presidential election and the Fed’s upcoming interest rate decision.
Tracked under the ticker VIXI on the Toronto Stock Exchange (TSE), the CVIX gauges anticipated market volatility. A reading below 10 suggests calm and stable market conditions, while values between 10 and 20 indicate moderate volatility with typical market fluctuations. When the index climbs above 20, it signals heightened uncertainty and the likelihood of more turbulent market conditions.
US Economic news
This past week’s key data points that the Fed considers when deciding whether to raise or lower the interest rate.
Personal Consumption Expenditures (PCE)
The Commerce Department’s Bureau of Economic Analysis reported that the PCE price index rose 0.2% in September, slightly higher than the 0.1% gain in August. Annually, inflation as measured by the PCE grew 2.1%, down from 2.3% in August.
Excluding food and energy, the core PCE price index, the Fed’s preferred inflation gauge, increased by 0.3%, up from August’s 0.2% rise. Year-over-year, core PCE inflation held steady at 2.7%, just above forecasts of a 2.6% increase.
Other than the slight dip in annual PCE, the figures either matched or slightly exceeded August’s numbers. This report mirrors the recent Consumer Price Index data, which showed inflation climbing at its slowest pace since early 2021. While the Fed is progressing toward its 2% inflation target, the journey remains bumpy. Still, this data is unlikely to affect the size of the Fed’s upcoming rate cut.
Gross Domestic Product (GDP)
The Bureau of Economic Analysis also released its initial estimate of third-quarter GDP, showing that the American economy grew at an annualized rate of 2.8%. This marks a slight slowdown from the second quarter’s 3.0% growth and falls short of analysts’ expectations for the same 3.0% growth. The decline was primarily due to decreases in private inventory investment and residential fixed investment; however, it was somewhat offset by higher consumer spending, exports, and government spending.
The data suggests that the economy is still expanding but at a slower-than-expected pace. Strong consumer and government spending continue to fuel growth, signaling that both households and businesses remain active despite current economic headwinds. Nevertheless, the drop in inventory investment and signs of a softening housing market hint that businesses may be more cautious about stocking up, indicating potential challenges for the real estate sector.
For investors, this mixed picture suggests that while the economy remains resilient, certain sectors are cooling down. That said, the 2.8% growth rate indicates that the economy is still on solid ground.
Labour data
Recent reports on US labour conditions from the Labor Department’s Job Openings and Labor Turnover Survey (JOLTS), the Bureau of Labor Statistics’ Employment Situation Summary (ESS), and the ADP Employment Report (ADP) offer valuable insights into the current state of the labour market and broader economy.
JOLTS
The JOLTS report offers a snapshot of labour demand by revealing how many positions are available on the last business day of the month and whether companies are actively hiring or pulling back. Job openings fell to 7.4 million in September, down from 7.9 million in August—marking the lowest level since January 2021 and falling short of the expected 7.9 million. Despite this decline, the ratio of job openings to unemployed workers held steady at 1.1, signalling that the labour market remains tight, even as employers are showing more caution in their hiring strategies.
ADP
In contrast, the ADP report exceeded expectations, showing private-sector job growth of 233,000 in October, more than double the forecast of 115,000. This is the strongest job growth since July 2023, when the economy faced disruptions from hurricanes. The report highlights that sectors such as services and construction continue to experience strong labour demand, reflecting resilience in key parts of the economy.
ESS
The ESS wrapped up the week with a sharp slowdown in job creation, reporting only 12,000 jobs added in October, far below expectations of 113,000. This steep decline from September’s downwardly revised figure of 223,000 is largely attributed to disruptions caused by hurricanes Helene and Milton, along with the Boeing (NYSE: BA) strike, which sidelined many workers.
On a positive note, the unemployment rate held steady at 4.1%, as expected, though it remains slightly elevated compared to last year’s 3.8%. Wage growth also provided some relief, with average hourly earnings rising by 0.4% in October, up from 0.3% in September. Year-over-year, wages increased by 4%, showing a modest gain from the 3.9% growth in the prior month.
The takeaway for investors is mixed. While the sharp drop in job creation is widely seen as a temporary result of hurricane disruptions and strikes, the slower pace of gains could signal that the economy is cooling. However, stable unemployment and rising wages suggest that the labour market remains healthy enough to support moderate economic growth. This report is particularly significant as it is the final major piece of data the Fed will review before their post-election meeting next week, likely shaping their future rate decisions.
Conclusion
The US labour market remains resilient but is showing signs of transition. Job openings are declining, while private sector hiring continues to show strength in key sectors. The sharp drop in job creation seen in the ESS, coupled with the downward revision of September’s numbers, suggests that the broader economy may be starting to slow down. Rising wages, while providing relief, could also lead to inflationary pressures, complicating the Fed’s upcoming decision on interest rates.
Consumer Confidence Index (CCI)
The Conference Board’s Consumer Confidence Index (CCI) for October exceeded expectations, coming in at 108.7, up from 98.7 in September. Analysts had predicted a more modest increase to 99.3.
Breaking down the CCI’s key components, the Present Situation Index surged by 14.2 points to 138.0, signalling a more optimistic view of current business and labour market conditions. Meanwhile, the Expectations Index rose by 6.3 points to 89.1, comfortably above the recession-warning threshold of 80. The Present Situation Index reflects how consumers feel about today’s economic conditions, while the Expectations Index gauges their outlook for income, business, and jobs in the near term.
This marks the largest monthly gain since March 2021, with all components showing improvement. The data suggest that consumers are feeling upbeat not only about their current situation but also about what lies ahead. This points to a strong short-term outlook for the economy, which is encouraging for the markets and us investors. 😊
American market volatility
The CBOE Volatility Index (VIX), often referred to as the market’s “fear gauge,” opened the week at 19.11 and gradually climbed above the 20-point threshold by midweek. Following the PCE announcement on Thursday morning, the VIX spiked above 23 before settling at 21.88 at the close of the market on Friday. This increase in volatility was influenced not only by the latest PCE inflation news but also by the jobs report, corporate earnings results, the upcoming US presidential election, and the Fed’s impending rate-setting meeting. Investors should brace for further volatility next week as these significant events unfold.
For context, the VIX measures expected market volatility over the next 30 days. Readings below 12 suggest calm conditions, while levels between 12 and 20 reflect typical market fluctuations. When the index moves into the 20-30 range, it indicates increasing uncertainty, and anything above 30 points to elevated market stress, often signaling a looming crisis or major market disruption.
Weekly Market Review
Monday: after taking a breather for most of last week, the markets got off to a good start with all four indexes – the Toronto Stock Exchange Composite Index (TSX), the S&P 500 Index (S&P), the Dow Jones Industrial Average (DJIA), and the Nasdaq Composite Index (Nasdaq) – ending the session in the green. Oil price took a tumble and were down sharply after Israel’s retaliatory air strikes were confined to Iranian military targets and avoided their energy producing facilities.
In Canada, despite lower oil prices, the TSX still managed to eke out a gain as investors have become confident are moving back into the market. In trading, Consumer Cyclicals posted the biggest gain, while the Energy sector dipped the most.
In the US, investors were optimistic of about upcoming economic data and earnings from the heavyweight technology companies. In trading, the Financials sector lead a day of widespread advances, the Technology and Energy sectors were the only sectors to lose ground.
Tuesday: it was a mixed day for the indexes with the S&P and Nasdaq ending in the green, the TSX was essentially flat, while the DJIA ended in the red.
In Canada, falling oil prices weighed on the TSX. In trading, the Basic Materials (miners and fertilizer manufacturers) sector posted the biggest gain, the Utilities sector declined the most.
In the USA, Nasdaq set a record high as investors prepared for earnings from the heavyweight technology companies. In trading, Communication Services rose the most of the sectors, while the Utilities sector declined the most.
Wednesday: all four indexes went for a tumble today as the latest US GDP data showed consumers continue to spend at a healthy rate and private payrolls expanded much more than anticipated. Oil prices rose on news of an unexpected drop in US inventories.
In Canada, the TSX ended lower for the seventh day in the last eight sessions as investors took some profits from mining companies that had benefitted from the run up in higher commodity prices. In trading, Consumer Staples was the top performer, while the Basic Materials sector fell the farthest.
In the USA, investors digested the latest economic news to look for clues about the Fed’s next rate announcement. In trading, Communication Services advanced the most, while the Technology sector declined the most.
Thursday: three of the four indexes fell over 1%, with the DJIA falling almost 1% as investors have become concerned about growth prospects for the heavyweight technology companies and mounting AI costs. Oil prices moved higher on news of possible Iranian retaliation against Israel following airstrikes on Iranian military installations.
In Canada, the TSX fell to a three-week low, driven by a broader market pullback following a downturn in US markets. In trading, the Healthcare sector was the only one to post a gain, while Technology had the biggest drop.
In the US, investors reacted negatively to news that both Microsoft (NASD: MSFT) and Meta (NASD: META) plan to ramp up AI spending at the expense of short-term profits, sending their stocks – and other heavyweight tech companies – lower, which in turn pulled down the major indexes. In trading, only the Utilities and Energy sectors ended in the green, while Technology was the deepest in the red.
Friday: the markets staged a comeback as investors capitalized on Thursday’s sell-off. Meanwhile, oil prices continued to climb, fueled by expectations of escalating retaliation between Iran and Israel.
In Canada, investors shrugged off losses from the past three days, marking the start of November – a historically positive month for the markets. In trading on Bay Street, Consumer Cyclicals advanced the most while the Utilities sector declined the most.
In the US, strong earnings from Amazon (NASD: AMZN) buoyed indexes, offsetting a disappointing jobs report. On Wall Street, Amazon’s surge propelled the Consumer Cyclicals sector to the top performer spot, whereas Utilities recorded the largest losses.
Weekly Market and Portfolio Review
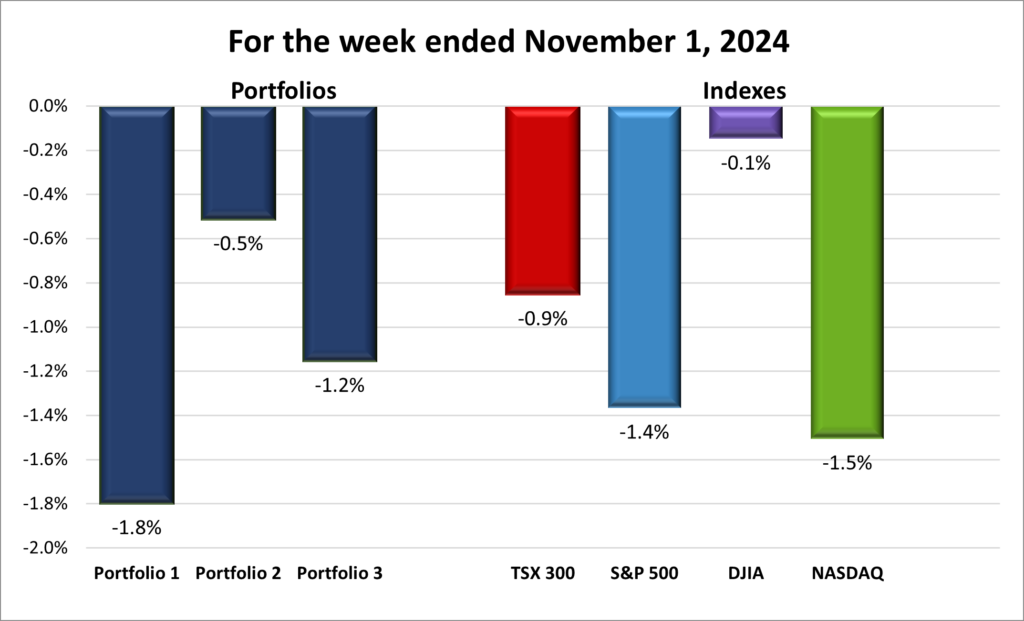
For the week, the TSX (SPTSX) lost 0.9%, the S&P 500 (SPX) dropped 1.4%, the DJIA (INDU) slipped 0.1% and the Nasdaq (CCMP) fell 1.5%.
| Index | Weekly Streak |
| TSX: | 2 – week losing streak |
| S&P: | 2 – week losing streak |
| DJIA: | 2 – week losing streak |
| Nasdaq: | 1 – week losing streak |
![]() The markets were on track for a strong end to the month, with all four major indexes moving higher midweek. However, the rally ran into turbulence in the final days, erasing earlier gains and leaving the indexes in the red by week’s end, as shown in the progress chart above. The Nasdaq, in particular, saw its seven-week winning streak come to an abrupt halt.
The markets were on track for a strong end to the month, with all four major indexes moving higher midweek. However, the rally ran into turbulence in the final days, erasing earlier gains and leaving the indexes in the red by week’s end, as shown in the progress chart above. The Nasdaq, in particular, saw its seven-week winning streak come to an abrupt halt.
Several key factors drove the markets this week, including three crucial economic indicators: GDP (productivity), PCE (inflation), and the jobs report (labour). It was also the busiest week for third-quarter earnings, with some of America’s most valuable companies reporting.
In the US, productivity slowed, inflation continued to ease, and the jobs report presented a mixed picture, with a sharp drop in new jobs—potentially due to incomplete data.
Earnings season had a major impact, especially with reports from the Magnificent 7 tech giants. These companies make up nearly 25% of the S&P 500 and have driven much of its 36% gain over the past year, with the index hitting record highs earlier this month. Five of these tech giants reported earnings, each announcing increased spending on datacentres to meet soaring demand for AI and cloud services. Despite solid financials, the market reacted cautiously as investors focused on the hefty spending, which could delay near-term revenue gains. While Apple (NASD: AAPL), Microsoft and Meta stumbled, Alphabet (Google) (NASD: GOOGL) and Amazon surged, with Amazon’s report driving the late-week rebound.
In Canada, the TSX initially rallied on renewed investor confidence as interest rates continued to fall. However, declining oil prices and profit-taking after a run-up in commodity stocks weighed down the index. Canadian GDP growth remains sluggish, trailing the BoC’s third-quarter growth estimates. While US GDP posted a solid 2.8% gain, Canadian GDP is expected to come in at a more modest 1%. Good news for our neighbours to the south, but less so for us Canadians.
Despite October’s rocky finish, there’s still reason for cautious optimism ahead. November, known for its historically strong market performance, holds the potential for a rebound that could lift all four indexes back into positive territory. That said, it is likely to be a volatile month. With the hotly contested US election and an upcoming Fed meeting, where another rate cut is expected, we might be in for some turbulence—so fasten your seat belt and prepare for a bit of rough weather. 😊
| Portfolio | Weekly Streak |
| Portfolio 1: | 1 – week losing streak |
| Portfolio 2: | 2 – week losing streak |
| Portfolio 3: | 2 – week losing streak |
![]() It was a tough week for the three portfolios, with all of them ending lower. Mixed earnings from heavyweight tech stocks weighed heavily on the markets and the portfolios—especially Portfolio 1, which saw its seven-week winning streak come to an end. Meanwhile, the other two portfolios extended their losing streaks to two weeks. ☹
It was a tough week for the three portfolios, with all of them ending lower. Mixed earnings from heavyweight tech stocks weighed heavily on the markets and the portfolios—especially Portfolio 1, which saw its seven-week winning streak come to an end. Meanwhile, the other two portfolios extended their losing streaks to two weeks. ☹
Portfolio 1 had a rough week, with only 26% of its holdings increasing in value. The bright spots were all-time highs from The Trade Desk (NASD: TTD) and TMX Group (TSE: X). On the downside, Hammond Power Solutions (TSE: HPS.A) dropped 11%, and, most significantly, Nvidia – the largest holding – posted a slight weekly loss. ☹
Portfolio 2 fared the best, though that is not saying much. It declined the least, with 42% of its companies posting gains. Dollarama (TSE: DOL) reached an all-time high, offering some relief. But like Portfolio 1, Hammond Power Solutions also dragged things down with its 11% drop.
Portfolio 3 had a rough ride, with only 18% of holdings gaining value, making it the second worst performer of the week. While there were not any major losses, the bright spot came from Lithium Americas Corp (TSE: LAC), which surged 15% – its second consecutive week of double-digit gains. Too bad its share price was not higher to begin with! 😊
All in all, it was not a great week. Whether you measure by percentage loss or the number of companies gaining, either Portfolio 1 or Portfolio 3 had the worst performance. Let us hope November’s historically positive trends kick in and bring all three portfolios get back on the winning side next week.
Monthly Market and Portfolio Review
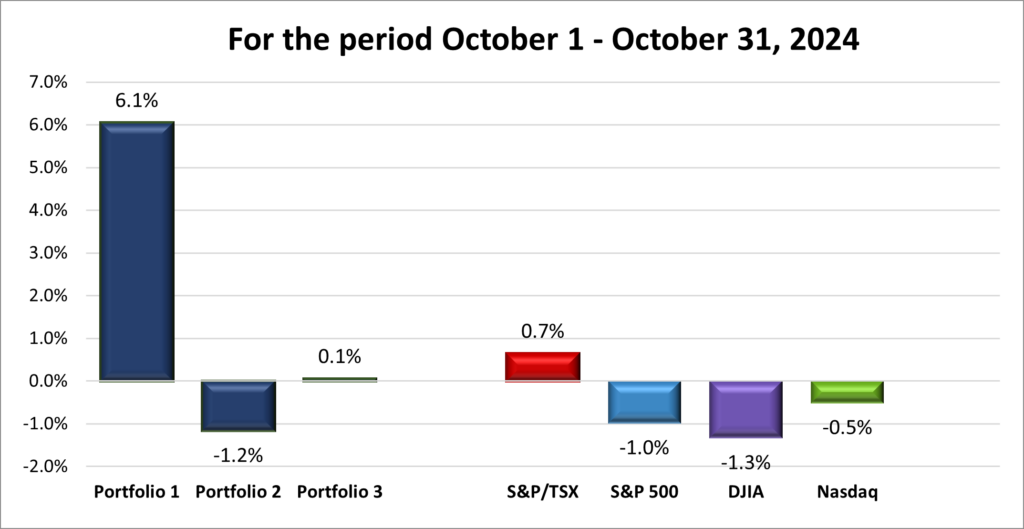
For the month of October, the TSX (SPTSX) rose 0.7%, the S&P 500 (SPX) fell 1.0%, the DJIA (INDU) dropped 1.3% and the Nasdaq (CCMP) declined 0.5%.
![]() October was a bit of a rollercoaster for the markets. As shown in the monthly progress chart above, the month started slow, rallied mid-month, but ultimately ended on a down note. All four major North American indexes posted monthly losses, snapping a five-month winning streak for both the S&P and the DJIA.
October was a bit of a rollercoaster for the markets. As shown in the monthly progress chart above, the month started slow, rallied mid-month, but ultimately ended on a down note. All four major North American indexes posted monthly losses, snapping a five-month winning streak for both the S&P and the DJIA.
It felt like two different months rolled into one. In the first half, markets surged on optimism and positive momentum carried over from a strong September. Economic news initially drove the gains, with a blowout jobs report signaling a robust economy. This fueled investor confidence but also raised concerns about rising inflation, which could prompt the Fed to pause its rate cuts. Adding to the unease was a higher-than-expected CPI inflation report that spooked the markets and shifted sentiment.
Earnings season played a significant role in shaping market movements as well. Strong reports from major US banks, along with a better-than-expected performance from Taiwan Semiconductor (NYSE: TSM), the world’s largest chipmaker, helped propel the S&P and DJIA to record highs during the month. However, as October progressed, the initial optimism began to wane, ultimately pushing all three American indexes into negative territory by month’s end.
In Canada, rising commodity prices—particularly oil—propelled the TSX to record highs. Lower interest rates also began to make an impact, with the Bank of Canada signaling the possibility of further cuts ahead. However, similar to their US counterparts, the TSX relinquished many of its early gains. Unlike the American indexes, though, the TSX managed to end October with a minor gain.
As we close the book on October, it is evident that the markets were pulled in different directions by a mix of strong economic data, inflation fears, and corporate earnings. While the early gains offered a glimpse of optimism, the subsequent volatility serves as a reminder that the markets are always unpredictable. Now that we have turned the calendar to November—traditionally one of the best months for stocks—there is plenty of potential for markets to resume their upward march, especially with major events like the US election and key economic reports on the horizon. Let us hope November lives up to its reputation as a great month for us investors! 😊
![]()
![]() October started off strong for the three portfolios, and I was optimistic it would be another stellar month. But as the markets reversed course toward the end, the gains began to fade. In the end, only Portfolio 1 managed to finish the month in positive territory, as you can see in the chart below.
October started off strong for the three portfolios, and I was optimistic it would be another stellar month. But as the markets reversed course toward the end, the gains began to fade. In the end, only Portfolio 1 managed to finish the month in positive territory, as you can see in the chart below.
Portfolio 1 was the clear standout, posting gains in four out of the five weeks. The major driver? Nvidia, which hit an all-time high in October before slipping back slightly by month’s end. While companies like The Trade Desk and Celestica (TSE: CLS) also had solid performances, it was Nvidia leading the charge this month.
Portfolio 2 had a more turbulent ride. It kicked off with a loss, bounced back with two consecutive weekly gains, but ended the month on a sour note with two straight weekly declines. Despite a few bright spots, no single or group of stocks stood out enough to push the portfolio into the green for the month.
Portfolio 3 was off to a great start with three straight weeks of gains. Unfortunately, it could not hold onto the momentum and ended the month just barely in positive territory. Still, there were impressive performances along the way, especially from Lithium Americas (TSE: LAC), which posted back-to-back gains of 18% and 15% in the last two weeks, helping the portfolio finish in the black.
Despite October’s ups and downs, Portfolio 1’s strength and a few standout gains helped prevent things from turning too negative. As we roll into November, I am cautiously optimistic heading into one of the best months of the year. Let us hope the markets build on the solid start and deliver a strong performance, lifting all three portfolios into positive territory and making November a winning month! 😊
Companies on the Radar
 Once again, no new additions to my radar list, but I removed Coca-Cola (NYSE: KO) from the list. As much as I like the company, it is my favourite soft drink, it did not have a big enough dividend end yield to go with a relatively minor future growth estimate. In addition, the stock seems expensive at the current price and the share price has been falling since peaking in early September. If it drops to a more attractive range, around $55, I would consider becoming an owner of the company. But for now, I will pass on becoming a co-owner with one the world’s greatest investors – Warren Buffett. 😊
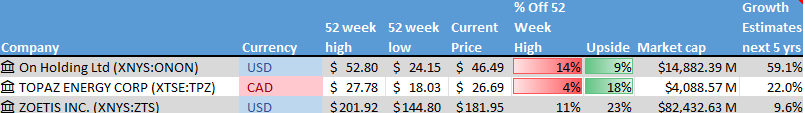
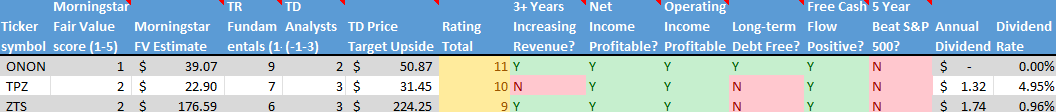
For now, my radar list stays focused on the three companies listed below:
- On Holding AG (NYSE: ONON), a medium cap Swiss company, founder-run, sports products company.
- Topaz Energy Corp. (TSE: TPZ), a mid-cap Canadian energy investment firm that focuses on strategic investments in premium energy assets operated by top-tier Canadian companies, and currently pays a 4.95% dividend.
- Zoetis Inc. (NYSE: ZTS), a leading animal health company that discovers, develops, manufactures, and commercializes vaccines, medicines, diagnostics, and other technologies for both companion animals and livestock.
As always, these are not buy recommendations – be sure to do your own research and make decisions that align with your personal financial goals!
The Radar Check was last updated November 1, 2024.
Portfolio Update
Portfolio 1
Portfolio 1 for the week ended November 1, 2024: DOWN ![]()
- CrowdStrike (NASD: CRWD) is being sued by Delta Air Lines (NYSE: DAL) for a global outage of Delta’s technology systems in the summer which resulted in mass flight cancellations that disrupted over 1.3 million customers and cost the airline over US$500 million.
- Celsius Holdings (NASD: CELH) has acquired Big Beverages Contract Manufacturing for US$75 million in cash, a strategic move to enhance its supply chain and product development. This acquisition includes a large manufacturing and warehouse facility focused on Celsius-branded products, while Big Beverages will keep its existing management and workforce intact.
- Nvidia (NASD: NVDA) is set to replace Intel (NASD: INTC) in the DJIA to better reflect the semiconductor industry’s influence. This change will take effect before the market opens on November 8.
Activity
No significant activity to report this week.
Dividends
Dividends Received this week for the following companies:
Companies followed by DRIP (Dividend Re-Investment Plan) indicate additional shares were purchased with the dividend. Any cash leftover was added to the cash balance.
Canadian $
Toronto-Dominion Bank (TSE: TD) DRIP
Bank of Nova Scotia (TSE: BNS) DRIP
US $
No US$ dividends this past week.
Quarterly Reports
Alphabet Inc.
Third quarter 2024 financial results on October 29, 2024
PayPal Holdings, Inc.
Third quarter 2024 financial results on October 29, 2024
Visa Inc.
Fourth quarter 2024 financial results on October 29, 2024
TMX Group Limited
Third quarter 2024 financial results on October 30, 2024
Amazon.com, Inc.
Third quarter 2024 financial results on October 31, 2024
Apple Inc.
Fourth quarter 2024 financial results on October 31, 2024
Portfolio 2
Portfolio 2 for the week ended November 1, 2024: DOWN ![]()
- Magnite (NASD: MGNI) announced they have extended their relationship with Disney (NYSE: DIS) to provide them with ad technology services for another two years.
Activity
No significant activity to report this week.
Dividends
Dividends Received this week for the following companies:
Companies followed by DRIP (Dividend Re-Investment Plan) indicate additional shares were purchased with the dividend. Any cash leftover was added to the cash balance.
Canadian $
Tourmaline Oil Corp (Alberta) (TSE: TOU)
Bank of Nova Scotia (TSE: BNS) DRIP
Dollarama Inc (TSE: DOL)
US $
No US$ dividends this past week.
Quarterly Reports
Hammond Power Solutions Inc.
Third quarter 2024 financial results on October 29, 2024
Microsoft Corp.
First quarter 2025 financial results on October 30, 2024
Canadian Natural Resources Limited
Fourth quarter 2024 financial results on October 31, 2024
Portfolio 3
Portfolio 3 for the week ended November 1, 2024: DOWN ![]()
- Lithium Americas announced the US Department of Energy has finalized a US$2.26 billion loan to build their Thacker Pass lithium mine. The mine is one of the US’s largest mining investments as the government attempts to secure and increase the domestic production of critical minerals used in the production of electric batteries used in electric vehicles.
- Brookfield Asset Management (TSE: BAM) and Brookfield Corporation (TSE: BN) announced plans to improve BAM’s corporate structure, including moving its head office from Toronto to New York, aiming to position the company for broader equity index inclusion, especially in the US markets.
Activity
No significant activity to report this week.
Dividends
Dividends Received this week for the following companies:
Canadian $
Toronto-Dominion Bank (TSE: TD)
US $
No US$ dividends this past week.
Quarterly Reports
Vertiv Holdings Co
Third quarter 2024 financial results on October 23, 2024
Microsoft Corp.
See report under Portfolio 2.