
The AI Revolution: Understanding the Technology Behind the Investment Boom
Part 6: Why Are Companies Racing to Build AI?
Over the past five weeks, we’ve explored what artificial intelligence (AI) is, how it learns, the infrastructure required to build it, why it costs so much, and what AI is increasingly capable of doing. But if building AI is so expensive, why are companies around the world racing to develop and adopt it?
The AI Revolution Series
- Part 1: What Is Artificial Intelligence? – What AI is, how it differs from human intelligence, and why today’s AI doesn’t think like people do.
- Part 2: How Does AI Learn? – What training means, how AI models learn from data, and why training requires enormous computing power.
- Part 3: What Does It Take to Build AI? – The chips, memory, networking, data centres, and electricity that make AI possible.
- Part 4: Why Does AI Cost So Much? – Why building and operating AI requires enormous investment, and why companies are willing to spend hundreds of billions to avoid falling behind.
- Part 5: What Are AI Capabilities? – The things AI can increasingly do, from understanding language and recognizing images to generating content, solving problems, and taking actions.
- Part 6: Why Are Companies Racing to Build AI? – How AI can improve productivity, reduce costs, create new revenue, and give companies a competitive advantage—and why businesses fear falling behind.
- Part 7: Investing in the AI Ecosystem
The answer comes down to one word: competition.
Companies don’t invest in technology simply because it’s interesting. They invest because they believe it can make them more productive, reduce costs, create new revenue, or give them an advantage over their competitors. AI has the potential to do all four.
One of the biggest opportunities is productivity. AI can help employees complete tasks faster and handle work that previously required significant amounts of time. A software developer can use AI to write and debug code, while a researcher can sift through thousands of documents instead of reading them one at a time.
Alphabet’s (NASDAQ: GOOGL) Google provides a good example. Its AI chatbot Gemini is being integrated throughout Google’s products, including Search, YouTube, and Google Cloud. In Search, AI Overviews and AI Mode can handle more complex questions, while AI-powered advertising tools can help businesses create more relevant ads. If AI makes Search more useful, people may use it more often. If it helps advertisers reach customers more effectively, Google can potentially generate more revenue.
But AI isn’t just changing the technology industry. By automating routine work, it can help businesses in almost any industry improve productivity and reduce costs. Walmart (NASDAQ: WMT) provides a good example. The retailer is using AI to improve operations, increase employee productivity, and make shopping easier. Its AI shopping assistant, Sparky, can help customers find and compare products and make personalized recommendations. Walmart says customers who use Sparky currently have an average order value about 35% higher than those who don’t.
The potential benefits go beyond a better shopping experience. If AI allows Walmart employees to spend less time on routine tasks, helps manage its enormous retail operation more efficiently, and encourages customers to buy more, it could ultimately improve the company’s bottom line.
This is why companies that ignore AI risk falling behind. If Walmart’s rivals can use AI to reduce costs or provide a better shopping experience, they will have an incentive to do so. If Google’s rivals can develop better AI-powered search, advertising, or cloud services, Google can’t simply sit back and wait to see what happens.
This creates a kind of AI arms race. Companies aren’t necessarily investing because they know exactly how much money AI will make. They’re investing because they don’t want to discover several years from now that their competitors gained an advantage while they were waiting for the technology to mature.
For investors, this helps explain why AI spending has grown so rapidly. The enormous investment we’ve discussed throughout this series isn’t being driven by one company or one industry. Businesses across the economy are trying to determine how AI can improve their operations – and trying to make sure their competitors don’t get there first.
The big question is whether all this spending will ultimately create enough economic value to justify the cost. If it does, the AI revolution could benefit not only the companies building the technology, but businesses across almost every industry.
Next week, we’ll bring everything together and look at how investors can participate in the AI ecosystem – from the companies building AI chips and data centres to those developing the software and applications that could ultimately turn AI’s capabilities into profits. For now, let’s take a look at what happened in the markets this week and how it impacted my three portfolios.
Items that may only interest or educate me ….
Canadian Economic news, US Economic news, ….
Canadian Economic news
This past week’s key economic data that the Bank of Canada (BoC) considers when deciding whether to raise or lower the interest rate.
Gross Domestic Product (GDP)
Statistics Canada released its latest GDP figures for the second quarter and June, with the economy growing 0.8% in the second quarter, or 3.3% on an annualized basis. That matched economists’ expectations and marked a welcome turnaround after Canada’s economy contracted slightly in both the final quarter of 2025 and the first quarter of 2026, putting it into a technical recession.
A technical recession occurs when an economy records two consecutive quarters of negative GDP growth. However, a technical recession doesn’t necessarily mean the economy is experiencing a broad or severe downturn. Economists also consider factors such as employment, consumer spending and the overall breadth of economic weakness when assessing whether an economy is in a full-fledged recession.
After contracting slightly in the first quarter, Canada’s economy bounced back in the second, with exports, household spending and business investment all contributing to growth. Business investment was particularly encouraging, rising 1.3% after several weak quarters. Still, one strong quarter isn’t enough to conclude that Canada’s underlying growth problems have disappeared. And with second-quarter growth rebounding while July inflation accelerated to 3.0%, the economic case for another rate cut has become less straightforward. The BoC now must balance a stronger economy against renewed inflation pressure.
In June, the economy grew another 0.3%, matching May’s increase and exceeding economists’ expectations for 0.2% growth. That marked the third consecutive monthly increase in GDP, providing some momentum heading into the third quarter.
Services-producing industries grew 0.4% from May, while goods-producing industries declined 0.1%. Wholesale trade led the monthly gains, rising 1.7%, while utilities posted the largest decline, falling 1.1%.
Looking back over the past year, goods-producing industries are up 2.3%, led by mining, quarrying, and oil and gas extraction, which grew 5.3%. Agriculture, forestry, fishing and hunting was the weakest performer, declining 3.1%. Services-producing industries are up 1.9% year over year, with transportation and warehousing leading the gains at 4.6%, while educational services was the weakest, falling 2.0%.
Overall, Canada’s economy continued to build momentum through the second quarter, with June marking a third consecutive monthly increase. However, the year-over-year figures show that growth remains uneven across sectors.
Canadian Market Volatility
Canada’s equivalent of the US volatility index (VIX) is the S&P/TSX 60 VIX Index (VIXC). Like its American counterpart, it measures how much volatility investors expect in the Canadian stock market over the next 30 days. Higher readings signal greater uncertainty, while lower readings suggest investors expect calmer market conditions.
The VIXC opened the week at 14.24, up from the previous week’s close of 13.56 as trade tensions with Canada’s largest trading partner, the US, resurfaced. However, the increase was short-lived, with the fear gauge quickly falling into the 13.0 range as investors largely looked past the dispute. It finished the week at 13.24, suggesting investors were slightly more calm at the end of the week than at the start.
Overall, the VIXC remained relatively subdued, suggesting investors weren’t overly concerned about broader market uncertainty. Even renewed trade tensions failed to generate much lasting anxiety, a sign that investors remain relatively comfortable with the current market environment.
Note: The VIXC typically trades at lower levels than the VIX, partly because of the different makeup of the Canadian and US markets. The S&P 500 has a much larger weighting in technology companies, while the TSX has greater exposure to financials, energy and materials. Because these sectors respond differently to economic conditions and commodity prices, the two indexes can have different levels of expected volatility.
US Economic news
This past week’s key data points that the Federal Reserve (Fed) considers when deciding whether to raise or lower the interest rate.
Consumer Confidence Index (CCI)
The Conference Board’s CCI edged down to 89.4 in August from a downward revised 90.2 in July, marking its fifth consecutive monthly decline and its lowest level since January. Economists had expected a reading of 90.1.
The headline number, however, doesn’t tell the whole story. The Present Situation Index, which measures how consumers view current business conditions and employment, rose to 121.2, its first increase in four months. The Expectations Index, which reflects consumers’ outlook for the next six months, moved in the opposite direction, falling to 68.2. A reading below 80 has historically been associated with an increased risk of recession.
Inflation remains another concern. Consumers now expect prices to rise 5.8% over the next year, up from 5.6% in July. Respondents continued to mention prices, particularly oil and gasoline, along with food, trade, jobs and geopolitical conflicts.
In other words, consumers feel reasonably good about the economy today, but they’re becoming increasingly nervous about where it’s headed. That growing gap between current conditions and future expectations is worth watching.
Inflation and Economic Growth
Personal Consumption Expenditures (PCE)
According to the Commerce Department’s Bureau of Economic Analysis (BEA), the PCE price index rose 0.2% in July, reversing a 0.1% decline in June. Economists had expected a more modest 0.1% increase. On an annual basis, headline inflation held steady at 3.7%, slightly above expectations of 3.6%.
Meanwhile, Core PCE – which excludes the often-volatile food and energy categories to provide a clearer picture of underlying inflation – also rose 0.2% during the month, following a 0.1% increase in June. The annual core inflation rate held steady at 3.3%.
Inflation remains stubbornly above the Fed’s 2% target, with neither headline nor core inflation showing improvement from June. The slightly hotter-than-expected headline reading and persistent core inflation suggest that inflationary pressures remain a concern.
Gross Domestic Product (GDP)
The BEA’s second estimate of second-quarter GDP confirmed that the American economy grew at an annualized rate of 1.5%, unchanged from its initial estimate and in line with economists’ expectations. That was a noticeable slowdown from the 2.1% growth recorded in the first quarter.
Consumer spending, exports and business investment all contributed to the growth. On the other side of the ledger, a decline in government spending and an increase in imports weighed on GDP. Imports are subtracted when calculating GDP because they represent spending on goods and services produced outside the United States.
Analysis
Taken together, these reports leave the Fed in a difficult position. Inflation remains too high, while economic growth is slowing. Normally, weaker economic growth would give the Fed a reason to lower interest rates and provide some support to the economy. But with inflation still well above its 2% target, cutting rates too quickly could risk reigniting price pressures.
For investors, the big question is which problem will win out: slowing growth or stubborn inflation? A weakening economy could encourage the Fed to lower interest rates, which would generally be good news for stocks. Lower rates reduce borrowing costs and make future corporate profits more valuable today. But if inflation remains too high, the Fed may have to keep rates elevated for longer or even raise them, putting pressure on stocks and making it more difficult for the economy to regain momentum.
For now, the latest data suggests the Fed is likely to remain cautious. The economy isn’t weak enough to demand an immediate rate cut, but inflation isn’t low enough to make one comfortable either. That leaves investors watching closely for signs that inflation is finally moving lower – or that the economy is weakening enough to force the Fed’s hand.
Consumer Sentiment Index (CSI)
The final August University of Michigan CSI came in at 51.7, slightly above the preliminary reading of 51.0 but still well below July’s 55.2. That represents a 6.3% decline from the previous month and leaves sentiment 11.2% lower than a year ago.
The weakness was broad-based. The Current Economic Conditions Index, which measures views of finances and the job market today, fell to 51.9 from 54.8 in July and is down 15.9% from a year ago. The Expectations Index, which reflects the outlook for the economy over the next six months, slipped to 51.5 from 55.4 and is down 7.9% from August 2025.
The decline was also more pronounced among groups less able to absorb higher living costs. Sentiment fell particularly sharply among older consumers, lower- and middle-income households, and those without stock holdings, suggesting that rising prices are weighing more heavily on Americans with less financial flexibility.
There was, however, a small piece of good news on inflation. Consumers now expect inflation to run at 4.0% over the next year, down from 4.2% in July. Long-term inflation expectations held at 3.3% for a third consecutive month. While an improvement from earlier this year, that remains elevated compared with much of 2024.
Overall, the report paints a fairly gloomy picture. Consumers are less confident about the economy, but their inflation expectations moved in the right direction. That’s encouraging for the Fed, as it reduces the risk of higher inflation becoming entrenched.
American Market Volatility
The VIX – often called the market’s “fear gauge” – measures how much volatility investors expect from the S&P 500 over the next 30 days. Higher readings generally indicate greater uncertainty and caution, while lower readings suggest a calmer market. Readings above 20 are typically associated with elevated volatility, while levels below 20 point to a relatively settled market.
The VIX opened the week at 15.90, up slightly from the previous week’s close of 15.13. Investors remained relatively calm despite the start of a tit-for-tat trade war between the US and Canada that could push prices higher in both countries. The US also increased economic pressure on Iran, potentially sending oil prices higher and adding to inflation concerns. However, late in the week, the VIX dropped below 15.0 and continued moving lower before finishing at 14.43. For the most part, investors looked past persistent inflation, signs of a slowing economy and comments from Fed Chair Kevin Warsh that inflation remains too high.
Overall, the VIX remained comfortably below 20 throughout the week, suggesting investors were far from signalling widespread fear. Despite trade tensions, potential pressure on oil prices, inflation concerns and uncertainty over interest rates, the market’s fear gauge remained firmly in calm territory.
Weekly Market and Portfolio Review
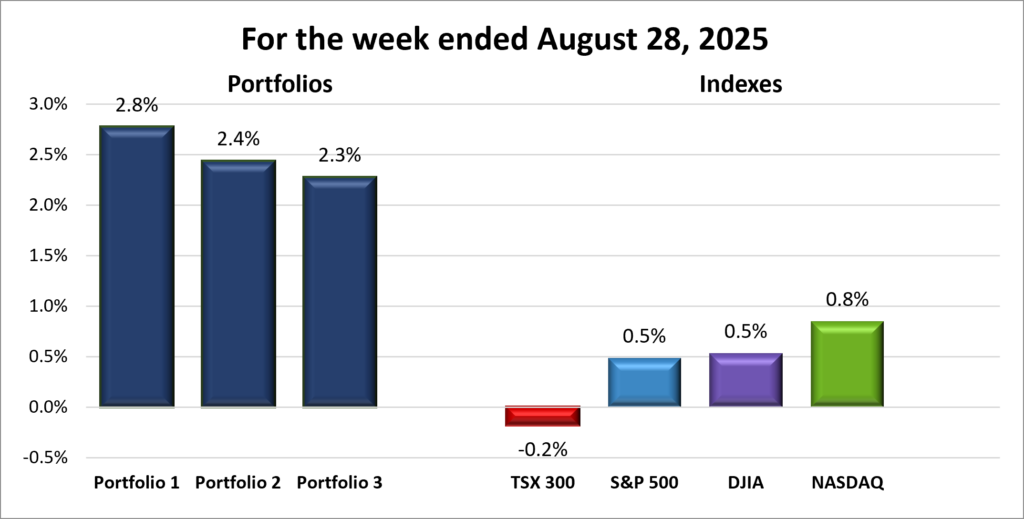
For the week, the TSX (SPTSX) dipped 0.2%, the S&P 500 (SPX) and the DJIA (INDU) both gained 0.5%, and the Nasdaq (CCMP) climbed 0.8%.
| Index | Weekly Streak |
| TSX: | 2 – week losing streak |
| S&P: | 1 – week winning streak |
| DJIA: | 1 – week winning streak |
| Nasdaq: | 1 – week winning streak |
 After last week’s weakness, North American markets entered the new week cautiously, with mixed results early on. However, they found their footing as the week progressed. The Toronto Stock Exchange Composite Index (TSX) set a record high close on Tuesday, while the S&P 500 Index (S&P), Dow Jones Industrial Average (DJIA) and Nasdaq Composite Index (Nasdaq) also moved higher. A midweek rally helped the American indexes get back in the win column, while the TSX extended its losing streak for another week as trade tensions weighed on the Canadian market later in the week.
The dominant themes in the American markets were geopolitical tensions and a tug-of-war between enthusiasm over AI and concerns about the economy, with Nvidia ultimately providing the biggest pull.
Iran and Oman said they had reached an agreement on sharing revenue from ships transiting the Strait of Hormuz, raising hopes that the Strait could reopen. Oil prices initially fell on the news but quickly reversed course after President Trump said he had no interest in returning to the terms of the recently ended Memorandum of Understanding between Iran and the US. By week’s end, however, oil prices had fallen sharply amid renewed hopes for an agreement. Lower oil prices could eventually ease some of the inflation pressure worrying investors and the Fed.
At the same time, negotiations between Canada and the US fell apart, with both sides blaming the other. The two countries now appear to be heading towards a trade war that could make goods and services more expensive for consumers in both countries.
Technology and semiconductor stocks weighed on the S&P and Nasdaq early in the week as investors questioned whether the AI rally could continue. Attention quickly turned to Nvidia’s (NASDAQ: NVDA) earnings, which had become an important test for the broader AI industry. Given the enormous amounts being spent on AI infrastructure, investors wanted evidence that demand remained strong enough to justify those investments.
Nvidia provided that reassurance. And boy, did it deliver. The company acknowledged that competition could cause it to lose some market share but expects the overall AI market to grow rapidly enough to continue driving strong revenue growth. It also raised its outlook, easing fears that the AI boom was losing momentum.
The week’s economic data provided a counterweight. Consumer confidence continued to decline, inflation remained stubbornly above the Fed’s 2% target, and economic growth slowed during the second quarter. Slower growth could eventually argue for lower interest rates, but persistent inflation makes cutting rates more difficult.
Comments from Fed Chair Kevin Warsh renewed those concerns at the end of the week, sending the major indexes modestly lower. Even so, all three finished with weekly gains. Friday’s pullback showed that while confidence in the AI growth story remains strong, it has not made concerns about inflation, interest rates and a slowing economy disappear.
North of the border, Canada’s major banks provided the biggest boost to the TSX. All six of the country’s largest banks reported strong quarterly results despite uncertainty over US trade policy and volatile oil prices. The banks’ better-than-expected earnings reinforced the resilience of Canada’s banking sector and helped push the TSX to its record close.
Gold also provided support as geopolitical and trade uncertainty lifted demand for the precious metal. Energy stocks, however, moved in the opposite direction as oil prices fell during much of the week, weighing on the energy sector.
The latest GDP report showed Canada’s economy was stronger than expected, growing at an annualized rate of 3.3% in the second quarter, its fastest pace since 2023. However, the collapse of Canada-US trade negotiations and fresh tariff concerns gave investors reason to question whether that strength can continue.
Overall, the week highlighted the different forces driving the two markets. US stocks were lifted primarily by renewed confidence in AI, while Canadian stocks benefited from strong bank earnings and strength in gold. For now, investors appear willing to look past concerns about inflation, interest rates, slowing growth and geopolitical tensions when corporate results continue to support the market’s growth expectations.
| Portfolio | Weekly Streak |
| Portfolio 1: | 1 – week winning streak |
| Portfolio 2: | 1 – week winning streak |
| Portfolio 3: | 1 – week winning streak |
After the previous week’s debacle, it was great to see all three portfolios bounce back so strongly and get back in the win column. Last week, all three fell more than the indexes, with Portfolio 3 shedding more than all four indexes combined. This week, the tables turned, with all three portfolios outperforming the indexes. In fact, the combined gains of the three indexes that finished higher were still less than the gain of my weakest-performing portfolio.
All three portfolios got a lift from Nvidia’s impressive earnings report – directly in the case of Portfolios 1 and 3, and indirectly through the AI rally that followed in Portfolio 2. Despite reporting impressive earnings and raising its guidance, Nvidia gained just 1% for the week. While I would have happily taken a bigger gain – who wouldn’t? – it was encouraging that much of the strength in Portfolios 1 and 3 came from other holdings rather than Nvidia doing all the heavy lifting.
Nvidia and the broader AI rally weren’t the only sources of strength. Strong earnings from Canada’s big six banks also helped lift the portfolios, with each one holding at least one of the country’s major banks.
Portfolio 1 was the week’s top performer, gaining 2.8%, with 56% of its holdings ending higher. Most of its heavyweight technology stocks finished in the green. Nvidia provided a solid boost, but the breadth of the gains was equally important. CrowdStrike (NASDAQ: CRWD) surged 14%, while Kelly Partners (OTCM: KPGHF) gained 12%, helping vault Portfolio 1 into the top spot.
Other highlights included Visa (NYSE: V) reaching an all-time high and the Bank of Nova Scotia (TSE: BNS) setting a record high following a strong third-quarter earnings report.
Portfolio 2 gained 2.4%, finishing just behind Portfolio 1 despite only 40% of its holdings gaining ground. The Bank of Nova Scotia, its largest holding, performed strongly enough to help offset weekly losses by a majority of the holdings.
Portfolio 3 posted the smallest gain at 2.3%, but that was still almost three times the Nasdaq’s 0.8% increase, the best performance among the four indexes. The portfolio was helped by 53% of its holdings ending the week higher, including its four largest positions. Three of those four are technology companies, including Nvidia and Microsoft (NASDAQ: MSFT), two members of the Magnificent 7.
I keep reading that the Magnificent 7 have lost some of their momentum compared with the past few years. That may be true as a group, but companies such as Nvidia and Microsoft continue to demonstrate why I am comfortable owning them. Their established businesses, strong earnings and dominant market positions give me greater confidence than some of the smaller, high-growth companies currently attracting the most attention. That’s why I have at least one Magnificent 7 company in each of my portfolios.
After last week’s disappointing performance, this was a welcome reminder that one bad week doesn’t define the longer-term picture and doesn’t mean I need to alter my investment strategy. The strong rebound was particularly encouraging because the gains came from several areas rather than relying on a single stock or sector. There will undoubtedly be more bumps along the way, but the portfolios head into the new week with some positive momentum.
Companies on the Radar
 It was a quiet week for my stock radar, with no new companies catching my attention. That leaves five companies currently on my radar.
- Mattr Corp. (TSE: MATR): A small cap Canadian industrial technology company that designs and manufactures specialized infrastructure products using advanced materials. The company may not be familiar to most investors, but its products support industries such as energy, electrification, communications, transportation, and water management. From composite pipes and underground storage tanks to specialized wire and cable solutions, Mattr creates products designed to be lighter, more durable, and resistant to harsh environments. Think of it as a behind-the-scenes supplier helping modern infrastructure operate more safely and efficiently, generating revenue by selling specialized products to industrial customers around the world.
- Capital Power Corporation (TSX: CPX): A mid cap Canadian power producer that generates electricity from a mix of natural gas, wind, solar and battery storage across North America. With electricity demand rising rapidly from AI data centres, industrial growth and electrification, Capital Power is expanding its natural-gas generation while adding renewable and storage capacity. Its recent agreement to supply 250 MW of power to a new Meta (NASDAQ: META) data centre in Alberta for more than 10 years highlights how the AI boom is creating opportunities beyond the technology companies building the data centres themselves.
- Emera Incorporated (TSX: EMA): A large cap Canadian energy company that owns regulated electric and natural gas utilities serving about 2.6 million customers across Canada, the US and the Caribbean. Its utilities provide a relatively stable source of revenue while Emera invests billions in expanding and modernizing its power networks. With electricity demand expected to grow as AI data centres, industrial activity and electrification increase, Emera could benefit from the long-term need for more reliable power.
- S&P Global (NYSE: SPGI): A large cap American company and one of the world’s most important financial information companies. Most investors know it for the S&P 500 Index, but the business also provides credit ratings, market data, analytics, and research used by banks, corporations, governments, and investors worldwide. Think of it as one of the key information providers that helps global financial markets function, generating revenue through subscriptions, licensing fees, and rating services.
- TerraVest Industries (TSE: TVK): A mid cap Canadian industrial company that produces equipment for energy, storage, and transportation markets, including propane tanks, pressure vessels, and heating systems. It grows through a mix of organic expansion and acquisitions, serving steady, asset-heavy industrial niches across North America.
As always, these are not buy recommendations. Make sure to do your own research and choose investments that fit your personal financial goals.
The Radar Check was last updated August 28, 2026.


That’s a wrap for this week, thanks for reading – may your portfolio stay green and your dividends steady. See you next time!