
The AI Revolution: Understanding the Technology Behind the Investment Boom?
Part 2: How Does AI Learn?
Last week, we explored what artificial intelligence (AI) is and how it differs from human intelligence. We learned that AI doesn’t think like people do – it identifies patterns in enormous amounts of information to generate useful responses.
The AI Revolution Series
- Part 1: What Is Artificial Intelligence? – What AI is, how it differs from human intelligence, and why today’s AI doesn’t think like people do.
- Part 2: How Does AI Learn? – What training means, how AI models learn from data, and why training requires enormous computing power.
- Part 3: What Does It Take to Build AI? – The chips, memory, networking, data centres, and electricity that make AI possible.
- Part 4: Why Does AI Cost So Much? – Why building and operating AI requires enormous investment, and why companies are willing to spend hundreds of billions to avoid falling behind.
- Part 5: What Are AI Capabilities? – The things AI can increasingly do, from understanding language and recognizing images to generating content, solving problems, and taking actions.
- Part 6: Why Are Companies Racing to Build AI? – How AI can improve productivity, reduce costs, create new revenue, and give companies a competitive advantage—and why businesses fear falling behind.
- Part 7: Investing in the AI Ecosystem – How investors can participate in the AI revolution, where companies fit into the ecosystem, and why AI exposure alone doesn’t make a stock a good investment.
But that raises an obvious question: if AI isn’t programmed with every possible answer, how does it learn?
The answer is a process known as training.
Think of training like teaching a student. A child doesn’t become an expert by reading a single book. Instead, they spend years learning from textbooks, teachers, examples, and experience. Over time, they begin to recognize patterns, understand concepts, and apply that knowledge to new situations.
AI learns in a similar way – but on a much larger scale.
Instead of attending school, an AI system is trained using enormous amounts of information known as training data. This data can include books, articles, websites, computer code, scientific papers, images, audio, and many other types of information. By processing these examples repeatedly, AI begins to recognize patterns and relationships within the data.
The result of this training process is called an AI model. You can think of the model as the “brain” of an AI application. It’s the trained system that has learned to recognize patterns and generate responses. Popular AI applications such as ChatGPT, Gemini, and Claude are built around these AI models, allowing users to interact with them through a simple chat interface.
So why does training an AI model require so much computing power?
Imagine asking someone to read a few dozen books. That’s a manageable task. Now imagine asking them to read billions of pages, identify patterns across all of them, and repeat the process over and over until they become increasingly accurate. That’s much closer to what happens during AI training.
Modern AI models perform trillions of calculations as they learn from their training data, requiring enormous amounts of computing power. Every adjustment requires enormous amounts of computation, which is why companies rely on thousands of specialized processors called Graphics Processing Units, or GPUs. These processors work together in massive data centres, often training a single AI model for weeks or even months.
Fortunately, this intensive training only needs to happen once for each new version of the model.
Once training is complete, the AI moves to a stage known as inference. This is simply the process of using the trained model to answer questions, write documents, generate images, or perform other tasks. Every time you ask ChatGPT a question or use Gemini to summarize an email, you’re using inference – not training.
An easy way to think about it is this: training is like studying for an exam, while inference is writing the exam. The studying takes weeks or months, but answering each question only takes a few seconds.
For investors, understanding the difference between training and inference helps explain why companies such as Alphabet (NASDAQ: GOOGL) and Microsoft (NASDAQ: MSFT) continue to spend hundreds of billions of dollars expanding their AI infrastructure. Building a smarter AI model requires immense computing power, while serving millions of users every day requires fast, reliable systems capable of answering questions almost instantly.
Next week, we’ll look at the infrastructure that makes all of this possible – from Nvidia’s (NASDAQ: NVDA) powerful AI chips to the data centres, networking equipment, and memory technologies that power today’s AI revolution.
For now, let’s turn our attention back to the markets. This week, investors digested the latest interest rate decision from the US Federal Reserve, along with a busy week of economic data, corporate earnings, and geopolitical developments. Let’s take a look at how these events affected the markets and my three portfolios.
Items that may only interest or educate me ….
What is Circular Financing, Canadian Economic news, US Economic news, ….
What is Circular Financing
Lately, you’ve probably seen the term “circular financing” appearing in financial headlines, especially in discussions about the AI industry. It’s not a formal accounting term, but rather a way of describing a situation where money circulates within an industry, raising questions about how sustainable demand really is.
Here’s the basic idea.
Imagine an AI chip maker invests in an AI startup. The startup then uses some of that funding to rent computing capacity from an AI cloud provider, which in turn buys more chips from the original supplier. Everyone involved reports higher revenue, and the strong results attract even more investment.
The sales are real, but investors begin to ask an important question: Would those purchases still happen if the investment funding disappeared?
That’s the concern behind circular financing. Rather than being driven entirely by profitable customers, some demand may be supported by a continuous flow of investment capital within the AI ecosystem.
A simple way to think about it is:
- Healthy demand: Companies buy AI hardware because paying customers are generating enough revenue to justify expanding their businesses.
- Funding-driven demand: Companies buy AI hardware because they’ve recently raised investment capital. If that funding slows, future purchases may slow as well.
This doesn’t mean the AI boom is built on “fake” demand. AI adoption is growing rapidly, and demand for computing power is very real. The concern is whether some of today’s exceptional spending is being pulled forward by abundant financing rather than by long-term, self-sustaining customer demand.
That’s why headlines about circular financing can weigh on AI stocks. Investors aren’t questioning whether AI has a future – they’re asking whether today’s pace of spending can continue if access to funding becomes more limited.
It’s important to remember that circular financing is a concern investors are watching for – not proof that companies are inflating demand or doing anything improper.
Canadian Economic news
This past week’s key economic data that the Bank of Canada (BoC) considers when deciding whether to raise or lower the interest rate.
Gross Domestic Product (GDP)
Statistics Canada reported that the Canadian economy grew 0.3% in May, beating economists’ expectations of 0.2%. April’s growth was also revised higher to 0.6%, marking the strongest monthly increase since July 2025. On an annual basis, the economy expanded 1.7%, up from 1.1% a year earlier.
With Statistics Canada’s preliminary estimate pointing to another 0.2% increase in June, the Canadian economy appears to have grown at an annualized rate of about 3.4% during the second quarter. That’s well above the BoC’s July forecast of 2.5% and stronger than the US economy’s 1.5% annualized growth over the same period.
Growth was broad-based across both goods-producing and service-producing industries. The energy sector was one of the strongest contributors, supported by gains in mining, quarrying, and oil and gas extraction. Construction and several service industries also posted solid growth, highlighting the resilience of the Canadian economy despite higher interest rates and ongoing trade uncertainty.
The stronger-than-expected GDP report reinforces the BoC’s decision to leave the benchmark interest rate unchanged at 2.25%. While inflation has moderated, stronger economic growth reduces the urgency for additional interest rate cuts, as BoC officials continue to balance supporting the economy with keeping inflation under control.
Canadian Market Volatility
Canada’s equivalent of the VIX is the S&P/TSX 60 VIX Index (VIXC). Like its American counterpart, it measures expected volatility in the Canadian stock market over the next 30 days. Higher readings signal greater uncertainty, while lower readings suggest a calmer market.
The VIXC typically trades at lower levels than the VIX, partly because of the different composition of the two markets. The US market has a much larger weighting in technology companies, where investor sentiment can shift quickly and lead to larger price swings. The TSX has heavier weightings in financials, energy, and materials such as gold, which tend to be more closely tied to economic conditions and commodity prices.
The VIXC opened the week at 15.28, up from the previous week’s close of 14.88, and remained relatively subdued despite renewed tensions in the Middle East and concerns about oil prices and inflation. It traded mostly between 14.50 and 15.25 before closing at 14.97, close to where it had finished the previous week.
Although Canadian markets faced many of the same challenges as their US counterparts – including geopolitical tensions, inflation concerns, and weakness in technology stocks – the VIXC remained well below the VIX throughout the week. While investors in both markets remained cautious, the VIXC suggested that the Canadian market was pricing in considerably less volatility.
US Economic news
This past week’s key data points that the Federal Reserve (Fed) considers when deciding whether to raise or lower the interest rate.
Consumer Confidence Index (CCI)
One of the most closely watched measures of consumer confidence, The Conference Board’s CCI, declined for a third consecutive month in July, suggesting that US consumers are becoming increasingly cautious about the economy. The index fell to 90.8, below economists’ expectations of 92.3 and down from June’s upwardly revised 92.2. While the decline was modest, it marks a notable shift from late 2024 and early 2025, when consumer confidence consistently remained above 100.
The decline reflected a combination of factors, including higher gasoline prices following renewed tensions in the US-Iran conflict, along with growing concerns about business conditions and the job market.
The weakness was concentrated in consumers’ assessment of current economic conditions rather than their outlook for the future. The Present Situation Index, which measures how consumers view current business conditions and employment, fell to 114.9, its third consecutive monthly decline. In contrast, the Expectations Index, which reflects consumers’ outlook over the next six months, held steady at 74.4. Although unchanged, it is still well below the 80 level that has historically been associated with an increased risk of recession.
Consumer spending accounts for roughly two-thirds of US economic activity, making confidence surveys an important barometer of future economic growth. When consumers become less confident, they often reduce discretionary spending, which can slow economic growth. At the same time, weaker spending can ease inflationary pressures, potentially giving the Fed more room to lower interest rates if inflation continues to moderate.
On its own, this report is unlikely to move markets, but it adds to the growing body of evidence that the US economy is gradually cooling rather than overheating.
Fed Rate Decision
The US Federal Reserve did exactly what investors expected this week, leaving its benchmark interest rate unchanged at 3.50% to 3.75% for the fifth consecutive meeting. While the decision itself wasn’t a surprise, the details behind it were far more interesting.
The overall message was slightly hawkish – a term investors use to describe a central bank that remains focused on fighting inflation, even if that means keeping interest rates higher for longer. The biggest surprise came from within the committee itself. Three voting members favoured raising interest rates by another 0.25%, reflecting growing concern that inflation remains above the Fed’s 2% target. Disagreements of this size are relatively uncommon and suggest policymakers are becoming less united on the path forward.
The Fed acknowledged that the US economy is still resilient but emphasized that inflation is still too high. Rather than signalling what it plans to do next, Chair Kevin Warsh and the committee stressed that future interest rate decisions will depend on upcoming economic data, particularly inflation and employment reports.
For us investors, that means every major inflation and jobs report between now and the Fed’s next meeting could influence expectations for future interest rates – and, in turn, the direction of the stock market.
Inflation and Economic Growth
Personal Consumption Expenditures (PCE)
The Fed’s preferred inflation measure showed further signs of cooling in June, providing another encouraging sign that inflationary pressures are easing. According to the Commerce Department’s Bureau of Economic Analysis (BEA), the PCE Price Index fell 0.1% during the month after rising 0.4% in May. On an annual basis, headline inflation slowed to 3.7% from 4.1%, matching economists’ expectations.
Meanwhile, Core PCE – which excludes the often-volatile food and energy categories to provide a clearer picture of underlying inflation – rose just 0.1% in June after increasing 0.3% in May. The annual core inflation rate eased to 3.3% from 3.4%. While this was another step in the right direction, it is still well above the Fed’s 2% inflation target.
Lower gasoline prices were the biggest factor behind the improvement, while underlying inflation also remained relatively subdued. However, because this report only covers June, it doesn’t reflect the recent rebound in oil prices following renewed tensions in the Middle East. If higher energy prices persist, they could put renewed upward pressure on inflation in the months ahead.
Gross Domestic Product (GDP)
The BEA announced that its advance estimate of second-quarter (April through June) GDP showed the US economy grew at an annualized pace of 1.5%, slowing from 2.1% growth in the first quarter and falling short of economists’ expectations.
However, the headline figure did not fully capture the economy’s underlying strength. Consumer spending – the largest driver of US economic activity – accelerated during the quarter as households continued spending on both goods and services. Business investment also remained strong, particularly in areas tied to AI, including data centres, semiconductor equipment, and other technology infrastructure.
Instead, much of the slowdown came from factors that reduced the GDP calculation rather than signalling a sharp drop in demand. A surge in imports, including AI-related components such as semiconductor chips and computer equipment, weighed on the headline number because imports are subtracted from GDP. Slower inventory growth also acted as a drag on overall growth.
Overall, the report suggests the US economy is gradually cooling, but the underlying data indicates it remains more resilient than the headline growth rate suggests.
Consumer Sentiment Index (CSI)
The University of Michigan’s final CSI for July provided a more encouraging view of the US consumer than earlier surveys this week. The index rose to 55.2, its highest level in five months, from 49.5 in June and above economists’ expectations of 54.0. Although sentiment improved significantly during the month, it remained 10.5% below its level a year ago, suggesting consumers are feeling better but are still far from optimistic.
The improvement was evident across both current conditions and future expectations. The Current Economic Conditions Index, which measures how consumers view their finances and the job market today, increased to 54.8 from 47.7 in June. Meanwhile, the Expectations Index, which reflects consumers’ outlook for the economy over the next six months, climbed to 55.4. While both measures improved, they remain below their levels from a year ago.
The report also showed that short-term inflation expectations eased, while sentiment improved across income groups, age groups, education levels, and political affiliations. Together, these results suggest consumers became somewhat more optimistic about the economy and their personal finances as inflation concerns moderated.
American Market Volatility
The VIX – often called the market’s “fear gauge” – measures expected volatility in the S&P 500 over the next 30 days. In simple terms, it reflects how much uncertainty investors expect in the market. The index typically rises when investors become more cautious and falls as confidence returns. Readings above 20 are generally associated with elevated volatility, while levels below 20 usually indicate a calmer market environment.
The VIX opened the week at 17.62, down slightly from the previous week’s close of 18.58, as a pause in Middle East hostilities helped ease concerns about oil prices and inflation. That calm didn’t last long. As hostilities resumed and concerns about excessive AI spending resurfaced ahead of several major technology earnings reports, the VIX climbed above 20 by midweek.
Investor sentiment improved following a strong earnings report from Microsoft, which maintained its planned AI spending. The results helped ease concerns that major technology companies may be overspending on AI, allowing the VIX to retreat below 18 before ending the week at 15.99.
Weekly Market and Portfolio Review
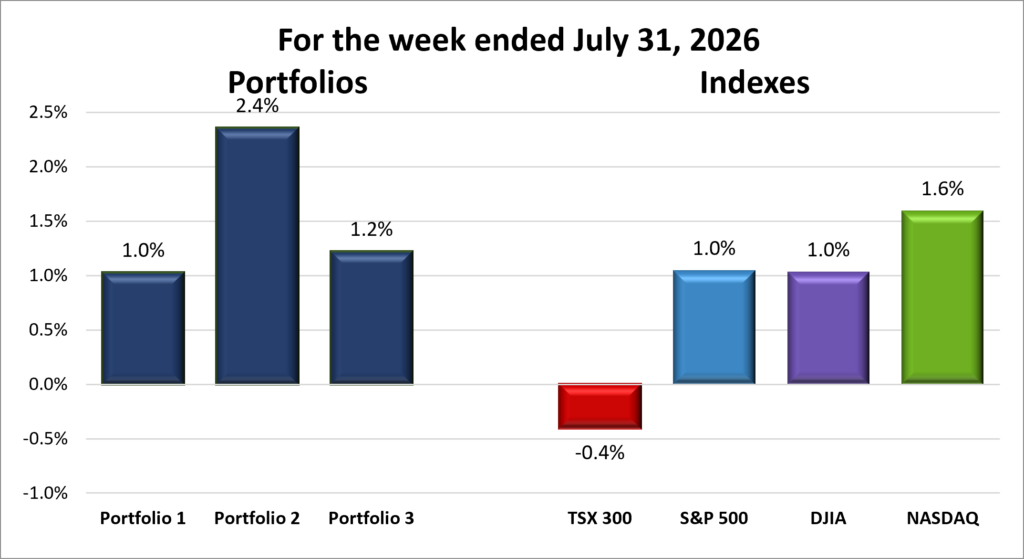
For the week, the TSX (SPTSX) dipped 0.4%, the S&P 500 (SPX) gained 1.0%, the DJIA (INDU) rose 1.0% and the Nasdaq (CCMP) jumped 1.6%.
| Index | Weekly Streak |
| TSX: | 1 – week losing streak |
| S&P: | 1 – week winning streak |
| DJIA: | 1 – week winning streak |
| Nasdaq: | 1 – week winning streak |

 The markets experienced another volatile week as investors balanced strong corporate earnings against renewed concerns over AI spending, interest rates, and geopolitical risks. The TSX started the week on a strong note, closing at record highs on Monday and Tuesday, while the S&P 500 (S&P) and Dow Jones Industrial Average (DJIA) also reached new highs. The Nasdaq Composite (NASDAQ) moved in the opposite direction as investors reassessed whether massive AI investments will generate sufficient returns. Despite taking different paths, all four indexes experienced a sharp midweek sell-off before rebounding the following day. By Friday’s close, however, the TSX had slipped into negative territory while all three major US indexes finished the week higher.
Corporate earnings remained the week’s biggest market driver, with investors focused on the largest technology companies. Last week, Alphabet reported the biggest quarterly profit in its history, yet its shares still fell more than 7% after announcing a US$205 billion capital spending plan. The reaction signalled a shift in investor expectations: strong earnings alone are no longer enough. Investors now want evidence that the billions being invested in AI will translate into meaningful revenue and profits.
That made this week’s technology earnings especially important. Concerns over rising AI infrastructure costs, competition from Chinese AI developers, and “circular” financing arrangements within the AI ecosystem weighed on semiconductor stocks and the broader Nasdaq early in the week. Sentiment improved, however, after Microsoft delivered better-than-expected results and an optimistic outlook, suggesting its AI investments are starting to generate meaningful returns. Amazon (NASDAQ: AMZN) followed with its strongest revenue growth in more than four years, while accelerating AWS growth helped ease concerns about excessive AI spending. Together, the two earnings reports reinforced the view that leading technology companies are beginning to convert massive AI investments into profitable growth rather than simply higher costs.
The Fed also played a part, leaving interest rates unchanged, as expected. However, investors were surprised by the meeting’s more hawkish tone, as three voting members dissented in favour of raising interest rates by another 0.25%, highlighting that inflation concerns remain within the committee.
Economic data also painted a constructive picture. Second-quarter GDP showed the US economy continued to expand, supported by resilient consumer spending and business investment, while the Fed’s preferred inflation measure cooled modestly from the previous month. Together, the reports suggested the economy remains resilient, although inflation has not fallen far enough for policymakers to shift their focus toward supporting growth.
Renewed tensions in the Middle East added another layer of uncertainty. Investors remained concerned that potential disruptions to key shipping routes could constrain global oil supplies. Ukraine’s continued strikes against Russian oil refineries added to those concerns. Although oil prices remained below their recent highs, the risk of another supply shock kept inflation concerns alive.
In Canada, the TSX followed a different path than the major US indexes, with its heavier weighting in energy, financials, and basic materials shaping the week’s performance. Unlike the technology-heavy American indexes, the TSX did not benefit from the late-week rally in AI-related stocks.
Energy stocks remained one of the TSX’s strongest pillars as oil prices held above earlier monthly levels. While renewed geopolitical tensions supported crude prices, investors also continued to reward Canadian energy companies for their strong cash generation and disciplined capital spending. Financials provided additional support, with Canada’s major banks attracting investors seeking stable earnings and reliable dividends amid ongoing market uncertainty. Meanwhile, basic materials stocks, which include gold miners and other resource companies, benefited from continued demand for defensive sectors, helping offset weakness in the TSX’s comparatively small technology sector.
The week’s performance was another reminder that markets don’t all respond the same way to global events. While American investors focused on whether massive AI investments would generate sufficient returns, the TSX was influenced more by energy producers, gold miners and other resource companies, and Canada’s major banks and insurers. Because these sectors respond to different economic drivers than high-growth technology companies, the TSX and US indexes can react differently to the same global events.
| Portfolio | Weekly Streak |
| Portfolio 1: | 1 – week winning streak |
| Portfolio 2: | 1 – week winning streak |
| Portfolio 3: | 1 – week winning streak |
The week’s AI-driven volatility also carried into my portfolios, producing some surprising results. The portfolio I expected to benefit most from the AI rally delivered the weakest performance, while the one I expected to benefit the least turned in the strongest weekly gain. Despite those unexpected results, all three portfolios finished higher, snapping their recent losing streaks.
Portfolio 1 had an interesting week. After a slow start, it rebounded with a 1.0% gain despite continued volatility among its largest technology holdings. One of the week’s biggest stories involved Apple (NASDAQ: AAPL), which briefly overtook Nvidia as the world’s most valuable publicly traded company after investors rewarded strong iPhone sales and its disciplined approach to AI spending. The rally pushed Apple’s market capitalization above US$5 trillion – less than a year after surpassing US$4 trillion – but the celebration was short-lived. Apple shares finished the week down 8% after issuing a disappointing outlook and warning that global supply constraints could weigh on future results.
Elsewhere in the portfolio, Amazon jumped 15% after reporting better-than-expected earnings, while Constellation Software gained 12%. Those gains helped offset weakness from Apple and Telus (TSE: T), which fell 11% after cutting its dividend by more than half following a quarterly loss.
Portfolio 2 was the week’s top performer, gaining 2.4% and easily outperforming the week’s best-performing major index, the Nasdaq, which rose 1.6%. The portfolio also had the highest percentage of weekly winners, with 59% of its holdings finishing higher. MongoDB (NASDAQ: MDB) advanced 10%, but the biggest contributor was Microsoft, which surged 18% following its earnings report. The company reported strong sales and cloud growth forecasts, while lower-than-expected capital expenditures eased concerns about excessive AI spending. Investors responded enthusiastically, viewing the results as further evidence that AI investments are beginning to translate into profitable growth.
Portfolio 3 also delivered a solid week, gaining 1.2% even though just 38% of its holdings finished higher. Microsoft’s 18% gain accounted for most of the portfolio’s return, more than offsetting losses elsewhere, including Vertiv Holdings (NYSE: VRT), which fell 17% after missing revenue expectations.
Overall, it was an encouraging week. Strong earnings from Microsoft and Amazon helped restore confidence in parts of the AI sector, which bodes well for my technology-heavy portfolios over the long term. At the same time, the wide range of individual stock performances showed that investors are becoming far more selective, rewarding companies that can demonstrate sustainable earnings growth and create long-term value for shareholders, whether through AI investments or strong execution in their core business.
Companies on the Radar
 This week, there were no new additions to my stock radar list, but I did remove one company. After comparing Forgent Power Solutions (NYSE: FPS) with Mattr Corp. (TSE: MATR), I decided to drop Forgent from consideration.
The decision wasn’t because I thought Forgent was a poor company. Quite the opposite. As I dug deeper into the business, I realized it was very similar to Hammond Power Solutions (TSE: HPS.A), an exceptional electrical equipment manufacturer that is already done very well in two of my portfolios. Buying Forgent would have concentrated more of my capital in a single investment theme – electrical equipment companies benefiting from the rapid expansion of AI infrastructure.
Mattr, on the other hand, offers something different. The company manufactures products such as wire and cable solutions, composite materials, and water infrastructure products. These businesses complement Hammond Power Solutions rather than compete with it, giving me broader exposure to North America’s long-term infrastructure and industrial growth trends.
With that change, my radar list is down to the four companies shown below.
- Mattr Corp. (TSE: MATR): A Canadian industrial technology company that designs and manufactures specialized infrastructure products using advanced materials. The company may not be familiar to most investors, but its products support industries such as energy, electrification, communications, transportation, and water management. From composite pipes and underground storage tanks to specialized wire and cable solutions, Mattr creates products designed to be lighter, more durable, and resistant to harsh environments. Think of it as a behind-the-scenes supplier helping modern infrastructure operate more safely and efficiently, generating revenue by selling specialized products to industrial customers around the world.
- Perimeter Solutions (NYSE: PRM): An American mid-cap company that produces specialty chemicals. Its best-known products are the fire retardants used to fight wildfires. If you’ve seen aircraft dropping bright red retardant over a wildfire, there’s a good chance it came from Perimeter. The company operates in a niche but essential market, supplying products and services that help protect communities, infrastructure, and natural resources during increasingly active wildfire seasons.
- S&P Global (NYSE: SPGI): A large cap American company and one of the world’s most important financial information companies. Most investors know it for the S&P 500 Index, but the business also provides credit ratings, market data, analytics, and research used by banks, corporations, governments, and investors worldwide. Think of it as one of the key information providers that helps global financial markets function, generating revenue through subscriptions, licensing fees, and rating services.
- TerraVest Industries (TSE: TVK): A mid-cap Canadian industrial company that produces equipment for energy, storage, and transportation markets, including propane tanks, pressure vessels, and heating systems. It grows through a mix of organic expansion and acquisitions, serving steady, asset-heavy industrial niches across North America.
As always, these are not buy recommendations. Make sure to do your own research and choose investments that fit your personal financial goals.
The Radar Check was last updated July 31, 2026.


Portfolio Update
Portfolio 1
Sold: The Trade Desk (NASDAQ: TTD) I made my initial investment in The Trade Desk back in May 2021, when I was still relatively new to investing. At the time, the company was one of the market’s hottest growth stocks and a leader in the fast-growing programmatic advertising industry. After the share price experienced a sharp pullback, I saw an opportunity to invest in a high-quality company at a more attractive price. Following the company’s 10-for-1 stock split, I added to my position in October 2021 as the business continued to perform well and investor enthusiasm remained strong.
Over the next few years, the company continued to execute, and the share price climbed to more than US$140 in October 2024. Since then, however, the story has changed. Revenue growth has slowed from more than 25% annually to the low teens, while competition has intensified. The company now faces increasing pressure from advertising giants such as Amazon and Google, both of which have enormous advertising ecosystems and access to vast amounts of customer data.
At the same time, advertising spending has softened as many large brands have become more cautious with their marketing budgets, creating a more challenging environment for the industry. Adding to investor concerns, the company experienced management turnover, including the unexpected departure of its CFO, while a dispute with a major advertising agency partner raised questions about competitive pressures.
The Trade Desk is still an innovative company with a strong position in programmatic advertising. However, after reassessing the business, I no longer believe it offers the same risk-reward opportunity that originally attracted me. I decided to exit my position and redeploy that capital into businesses where I have greater confidence in their ability to compound my wealth through investing. 😊
Portfolio 2
Bought: Brookfield Infrastructure Partners (TSE: BIP.UN) This week, I completed a portfolio change I discussed in my July 24 Update I sold my shares of Brookfield Infrastructure Corporation (TSE: BIPC) and purchased units of Brookfield Infrastructure Partners.
The two investments represent the same underlying infrastructure business. They give investors exposure to the same portfolio of assets, including utilities, transportation networks, energy infrastructure, and data infrastructure. The main difference is how they are structured. BIP.UN is a limited partnership, while BIPC was created as a corporate structure to provide investors with a simpler alternative.
Since both securities represented the same business, my decision was not about changing my exposure to Brookfield Infrastructure – it was about choosing the structure I believed offered the better value at the time.
Interestingly, I wasn’t the only one simplifying my Brookfield Infrastructure investment. While reviewing the company’s latest earnings, I discovered that Brookfield Infrastructure plans to restructure BIP.UN and BIPC into a single publicly traded corporation, Brookfield Infrastructure Partners Inc. (“BIP Inc.”). Subject to shareholder approval, this “simplification” (their term) is expected to be completed in the fourth quarter of 2026.
My original investment in BIP.UN dates back to February 2018. I was attracted to the company because it owns and operates essential infrastructure assets that people and businesses rely on every day, regardless of whether the economy is expanding or slowing.
Brookfield Infrastructure fits into the Income portion of this portfolio. It provides a growing distribution while giving me exposure to a global infrastructure company positioned to benefit from long-term trends such as rising energy demand, increased digital connectivity, and the continued expansion of data centres.
Bought: TC Energy (TSE: TRP) Last week, I mentioned that I sold my shares of South Bow (TSE: SOBO), the liquids pipeline business that was spun out of TC Energy in 2024. This week, I reinvested those funds in TC Energy, taking advantage of a pullback in the stock price following a decline in oil prices.
TC Energy owns and operates one of the largest natural gas pipeline networks in North America, along with power generation and other energy-related assets. Its pipelines provide essential services by transporting natural gas and energy products that homes, businesses, and industries rely on every day.
One of the things I like about TC Energy is that its revenue is generally based on long-term contracts and regulated rates rather than directly on the price of oil and natural gas. While energy prices can influence investor sentiment in the short term – as we saw this week with the sharp drop in oil prices – pipeline companies can continue generating relatively stable cash flows even when commodity prices fluctuate.
Like Brookfield Infrastructure, I originally invested in TC Energy back in February 2018. The company fits into the income part of this portfolio, providing a reliable dividend supported by predictable cash flows, while its continued expansion and modernization of its pipeline network provide opportunities for long-term growth.
The recent decline in TC Energy’s share price created an opportunity to increase my position in a company I have followed for many years. By moving capital from South Bow back into TC Energy, I am concentrating my portfolio around a business where I have greater long-term conviction.
Bought: iA Financial (TSE: IAG) This week, I also increased my position in iA Financial, a company I’ve owned since October 2021. Since my initial purchase, the stock has gained approximately 180%, making it one of the strongest performers in this portfolio.
At first glance, adding to a stock after a 180% gain might seem counterintuitive. Many investors feel more comfortable buying companies whose share prices have fallen, believing they are getting a better bargain. However, I believe successful investing is about owning great businesses – not simply buying stocks that appear cheap. A rising share price is not a reason to sell if the underlying business continues to perform well. In iA Financial’s case, the company has continued to execute, and shareholders have been rewarded as the share price has grown higher, following the company’s success.
When I first invested in iA Financial, my thesis was straightforward. I was looking for a stable, well-managed financial company with consistent earnings growth, an attractive dividend, and the potential to compound shareholder value over the long term. Over the past several years, the company has continued to deliver on those expectations.
Rather than viewing the higher share price as a reason to stay away, I see it as evidence that my original investment thesis continues to play out. By increasing my ownership position (still extremely small 😊), I’m simply investing more alongside a company that continues to execute and deliver on the reasons I bought it in the first place.
That’s a wrap for this week, thanks for reading – may your portfolio stay green and your dividends steady. See you next time!