
The AI Revolution: Understanding the Technology Behind the Investment Boom
Part 4: Why Does AI Cost So Much?
Over the past three weeks, we’ve explored what artificial intelligence (AI) is, how AI models learn, and the infrastructure required to build and operate them. We now know that AI depends on specialized chips, advanced memory, high-speed networking, massive data centres, and enormous amounts of electricity. But all of that raises another question: Why does AI cost so much?
The AI Revolution Series
- Part 1: What Is Artificial Intelligence? – What AI is, how it differs from human intelligence, and why today’s AI doesn’t think like people do.
- Part 2: How Does AI Learn? – What training means, how AI models learn from data, and why training requires enormous computing power.
- Part 3: What Does It Take to Build AI? – The chips, memory, networking, data centres, and electricity that make AI possible.
- Part 4: Why Does AI Cost So Much? – Why building and operating AI requires enormous investment, and why companies are willing to spend hundreds of billions to avoid falling behind.
- Part 5: What Are AI Capabilities? – The things AI can increasingly do, from understanding language and recognizing images to generating content, solving problems, and taking actions.
- Part 6: Why Are Companies Racing to Build AI? – How AI can improve productivity, reduce costs, create new revenue, and give companies a competitive advantage—and why businesses fear falling behind.
- Part 7: Investing in the AI Ecosystem – How investors can participate in the AI revolution, where companies fit into the ecosystem, and why AI exposure alone doesn’t make a stock a good investment.
The answer starts with scale.
Building an AI system isn’t like buying a new computer and installing some software. Companies developing the most advanced AI models need thousands of specialized chips, massive data centres to house them, sophisticated networking equipment to connect them, and enough electricity to keep everything running. These investments are known as capital expenditures, or CapEx – money spent on assets that are expected to provide value for years rather than being used up immediately.
The biggest expense is often the computing power itself. Training an advanced AI model can require thousands of powerful GPUs working together for weeks or even months. But the spending doesn’t stop once the model has been trained.
This brings us back to something we discussed in Part 2: training and inference are two different things. Training is the process of creating the model; inference is what happens every time someone uses it. When millions of people ask an AI chatbot questions, generate images, write computer code, or use AI-powered applications, computers have to process all of those requests. The more people use AI, the more computing power companies need to provide.
That creates two enormous costs: building the AI infrastructure and operating it.
And the operating costs don’t end with computing. Data centres need electricity to run the computers and sophisticated cooling systems to prevent them from overheating. Networking equipment and memory need to be maintained and eventually replaced. As AI models become more capable, companies often need to expand their infrastructure simply to keep up with demand.
So why are companies willing to spend hundreds of billions of dollars on all of this?
The answer is simple: they believe AI could fundamentally change how businesses operate.
AI could help companies increase employee productivity, automate routine tasks, reduce operating costs, improve existing products, and create entirely new products and services. For technology companies in particular, AI could become a major source of future revenue.
There’s also another powerful incentive: the fear of being left behind.
If AI becomes as transformative as many companies expect, a business that waits several years to invest could find itself at a significant competitive disadvantage. That helps explain why companies are investing aggressively today, even though the financial benefits may not appear for years.
This spending creates a massive cycle throughout the AI ecosystem. Companies such as Microsoft (NASDAQ: MSFT), Amazon (NASDAQ: AMZN), and Alphabet (NASDAQ: GOOGL) spend billions building AI infrastructure. That money flows to companies supplying the chips, memory, networking equipment, data centres, and electricity needed to operate it. Those companies, in turn, invest to expand their own capacity to meet growing demand.
For investors, however, there’s an important question behind all this spending: Will the economic benefits of AI eventually justify the enormous investment being made today?
The answer isn’t guaranteed. Some companies may turn their AI investments into powerful new products and significant profits. Others may spend heavily without generating sufficient returns. That’s why the AI boom isn’t simply a story about how much companies are spending – it’s also about whether that spending ultimately creates enough value to justify the cost.
Next week, we’ll look at what all this investment is actually designed to produce: AI capabilities – the things AI can increasingly do for businesses and consumers, and why those capabilities could be so valuable. For now, let’s see which way the winds were blowing in the markets and how they impacted my three portfolios.
Items that may only interest or educate me ….
Canadian Economic news, US Economic news, ….
Canadian Economic news
This past week’s key economic data that the Bank of Canada (BoC) considers when deciding whether to raise or lower the interest rate.
Canadian Market Volatility
Canada’s equivalent of the US’s volatility index (VIX) is the S&P/TSX 60 VIX Index (VIXC). Like its American counterpart, it measures the level of volatility investors expect in the Canadian stock market over the next 30 days. Higher readings signal greater uncertainty, while lower readings suggest investors expect calmer market conditions.
The VIXC typically trades at lower levels than the VIX, partly because of the different composition of the Canadian and US markets. The US’s S&P 500 has a much larger weighting in technology companies, while Canada’s TSX has greater exposure to financials, energy and materials. These sectors tend to respond differently to economic conditions and commodity prices, which can result in different levels of expected volatility.
The VIXC opened the week at 15.36, up from the previous week’s close of 14.37 as investors watched developments surrounding the uncertainty surrounding efforts to reopen the Strait of Hormuz, and awaited the US inflation reports. Following the release of the inflation data, the fear gauge slipped below 14 and continued to drift lower as strong corporate earnings boosted investor confidence. The VIXC finished the week at 13.58.
Despite facing many of the same concerns as US markets – including geopolitical tensions, inflation and volatile technology stocks – the VIXC remained below the VIX for most of the week. By Friday, however, the two gauges had moved much closer together. Both ultimately pointed to a relatively calm market, suggesting investors saw limited near-term risk despite the different makeup of the two markets.
US Economic news
This past week’s key data points that the Federal Reserve (Fed) considers when deciding whether to raise or lower the interest rate.
Consumer Price Index (CPI)
The Labor Department’s July CPI report delivered something investors were looking for: reassurance that inflation isn’t accelerating again. Annual inflation eased to 3.4%, down from 3.5% in June, marking the second consecutive month that headline inflation has fallen. On a monthly basis, consumer prices rose 0.1%, following a 0.4% decline in June. Both figures matched analysts’ expectations.
Core inflation, which excludes the more volatile food and energy categories, picked up slightly on a monthly basis, rising 0.2% after being flat in June. However, the annual core rate eased to 2.5% from 2.6%. Both the monthly and annual core readings matched expectations. So while prices increased a little faster during July, the broader trend still points to inflation gradually cooling rather than reaccelerating.
Gasoline prices provided some relief, falling 2.9% during the month and helping keep the overall CPI increase low. Shelter costs, the largest component of the CPI, rose just 0.1% for the second consecutive month, while annual shelter inflation eased slightly to 3.2% from 3.3%. These are encouraging signs because housing costs have been an important source of persistent inflation.
The July report gives the Fed little reason to become more concerned about inflation, but it also doesn’t provide a compelling reason to rush into lowering interest rates. Inflation at 3.4% remains well above the Fed’s 2% target, while core inflation is still at 2.5%. The July CPI didn’t necessarily deliver great news – it delivered reassuring news. The combination of moderating inflation and last week’s softer labour-market data is reducing pressure on the Fed to raise interest rates at its September meeting.
Retail Sales
The Commerce Department’s July retail sales report showed sales fell 0.6%, following a 0.2% gain in June. It was the first monthly decline in nine months and the largest drop since May 2025. Analysts had expected a 0.1% increase, making the decline a significant disappointment. Year over year, however, sales were still 5.0% higher than July 2025, down from June’s 6.7% gain.
Some of the weakness doesn’t necessarily mean consumers are pulling back. Gasoline sales fell as fuel prices declined, while non-store retailers, which include online sales, dropped 2.2%, likely influenced by Amazon (NASDAQ: AMZN) moving its Prime Day from July last year to June this year. That shifted some spending into the previous month. Meanwhile, clothing stores posted the largest monthly gain at 1.9%, while restaurant and bar sales rose 0.5% for a fourth consecutive monthly gain.
However, the weakness wasn’t confined to gasoline and online sales. Core retail sales, which exclude motor vehicles and parts and gasoline stations, fell 0.2% in July after rising 0.2% in June. On an annual basis, core sales climbed 4.8%, lower than June’s 5.7%, suggesting underlying consumer spending also softened.
This report is significant because it comes just two days after the CPI report. Inflation is cooling, the labour market is weakening, and now consumer spending has disappointed. Since consumer spending is a major driver of the American economy, the report adds to evidence that the economy is losing momentum. That reduces the case for another Fed rate hike in September while leaving the Fed to balance persistent inflation against a slowing economy.
Consumer Sentiment Index (CSI)
The University of Michigan’s preliminary August Consumer Sentiment Index fell to 51.0, down sharply from 55.2 in July and ending two consecutive months of improvement. Sentiment was also 12.4% lower than a year ago. Analysts had expected a reading of 54.5, making the decline a significant disappointment and another sign that consumers are becoming less confident about the economy.
The Current Economic Conditions Index, which measures how consumers view their financial situation and the economy today, fell 5.5% to 51.8 from 54.8 in July and was 16.0% below its level a year ago. The Expectations Index, which looks at how consumers view the economy over the coming six months, dropped 8.7% to 50.6 from 55.4 in July and was 9.5% below August 2025. In other words, consumers are feeling worse about both where the economy is today and where they think it is headed.
Inflation remains an important source of that concern. Although the latest CPI report showed inflation continuing to ease, consumers’ expectations for future inflation moved in the opposite direction. One-year inflation expectations increased to 4.3% from 4.2%, suggesting consumers are still worried about the cost of living. Ongoing Middle East tensions and the potential for higher energy prices are adding to those concerns.
The weaker sentiment comes on top of slowing hiring and a surprise decline in retail sales. While none of these indicators alone signals an economic downturn, together they suggest the US economy is losing momentum – a trend the Fed will be watching closely as it weighs its next move on interest rates.
American Market Volatility
The VIX – often called the market’s “fear gauge” – measures how much volatility investors expect from the S&P 500 over the next 30 days. Higher readings generally indicate greater uncertainty and caution, while lower readings suggest a calmer market. Readings above 20 are typically associated with elevated volatility, while levels below 20 point to a relatively settled market.
The VIX opened the week at 15.40, up from the previous week’s close of 14.90 as investors watched developments surrounding the reopening of the Strait of Hormuz and awaited the latest inflation data. Once the consumer and producer inflation reports revealed little sign of renewed price pressures, some of that uncertainty faded. The VIX slipped below 15 and finished the week at 14.25, continuing its downward trend.
Weekly Market and Portfolio Review
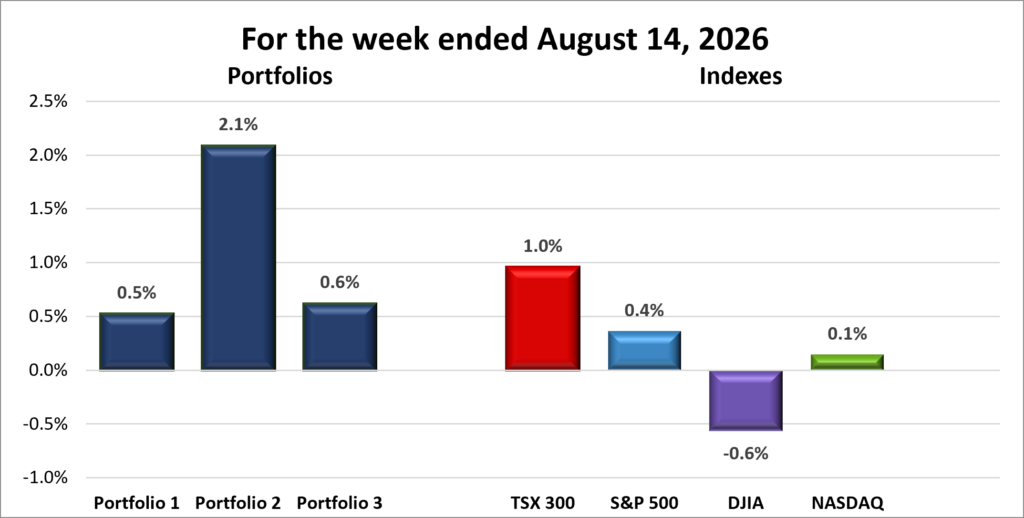
For the week, the TSX (SPTSX) advanced 1.0%, the S&P 500 (SPX) gained 0.4%, the DJIA (INDU) slipped 0.6% and the Nasdaq (CCMP) edged higher 0.1%.
| Index | Weekly Streak |
| TSX: | 2 – week winning streak |
| S&P: | 3 – week winning streak |
| DJIA: | 1 – week losing streak |
| Nasdaq: | 3 – week winning streak |

 The markets were largely positive this past week, although it was a mixed bag for the four indexes I follow: the Toronto Stock Exchange Composite Index (TSX), the S&P 500 Index (S&P), the Dow Jones Industrial Average (DJIA), and the Nasdaq Composite Index (Nasdaq). The TSX was the standout, recording five consecutive record closes before the streak was snapped Friday. The S&P also set a new record high close during the week, while the Nasdaq moved closer to a new high. The fly in the ointment was the DJIA, which ended the week lower.
After last week’s strong rally, investors took a more cautious approach as geopolitical uncertainty and inflation data competed for attention. The biggest source of early-week pressure came from the Middle East, where hopes for an agreement to reopen the Strait of Hormuz faded. Iranian officials said the Strait would remain closed unless the US accepted Iran’s conditions for ending the war, reinforcing concerns that the disruption could persist. Oil prices jumped roughly 5% on Monday and continued higher Tuesday, raising concerns that prolonged supply disruptions could push inflation higher and make it harder for the Fed to lower interest rates. Those concerns were enough to pull the major indexes lower early in the week.
The mood improved as the week progressed, largely because the latest inflation data offered little reason for the Fed to become more concerned. Consumer inflation was largely in line with expectations, while wholesale price inflation later in the week was weaker than expected. After last week’s weak labour-market data, the combination of slower employment growth and relatively contained inflation reduced concerns that the Fed would need to keep rates higher for longer. Friday brought a more complicated signal, however, as retail sales unexpectedly fell 0.6% in July. Weaker consumer spending could help contain inflation, but it also raised concerns that the economy may be losing momentum.
Technology stocks also regained momentum as investors continued to look for evidence that massive AI investments are translating into real business growth. Strong results from companies tied to AI infrastructure helped revive enthusiasm for the sector, although individual earnings reports continued to produce sharp reactions when companies fell short on margins or profitability. That’s an important distinction for investors to understand: the market isn’t simply rewarding companies because they are involved in AI. Investors are becoming more selective, looking for companies that can turn growing demand for AI into sustainable revenue and, eventually, profits.
In Canada, the TSX’s strength came from a broader mix of sectors than in the US, with energy, financials, mining and technology all contributing at different points during the week. Energy stocks provided an early boost as oil prices climbed on uncertainty surrounding the Strait of Hormuz. This matters more to the TSX because energy companies make up a much larger share of the Canadian index. Higher oil prices can increase the revenue and profits of Canadian producers, making energy stocks more attractive to investors. Oil prices eased later in the week before rebounding Friday, while rising gold prices supported Canadian miners and the country’s major banks also contributed to the TSX’s advance.
The TSX’s run is a good reminder that Canadian and US markets can respond differently to the same global events. While US investors were heavily focused on technology and AI, Canada’s greater exposure to energy, gold and financials provided additional sources of support. The TSX therefore remained near record levels even as the DJIA pulled back, showing how the sectors that make up an index can have a major influence on how it responds to the news.
| Portfolio | Weekly Streak |
| Portfolio 1: | 3 – week winning streak |
| Portfolio 2: | 3 – week winning streak |
| Portfolio 3: | 3 – week winning streak |
With relatively modest gains across the markets, I was pleased to see all three of my portfolios outperforming the three American indexes. All three portfolios benefited from strength in technology stocks, particularly those associated with AI. Nvidia (NASDAQ: NVDA), the largest position in both Portfolios 1 and 3, gained 0.7%. Higher oil prices benefited the energy companies, while the inflation data also helped financial stocks. Consumer inflation came in as expected and producer inflation was lower than expected, easing concerns about inflation and interest rates.
Portfolio 1 gained 0.5%, with a portfolio-best 65% of its holdings finishing higher for the week. The gains weren’t large, but they were broad-based, with Datadog (NASDAQ: DDOG) providing the biggest boost with a 10% gain. Despite its relatively modest 0.7% gain, Nvidia’s contribution helped keep the portfolio in positive territory.
Portfolio 2 was the top performer, gaining 2.1%. As with Portfolio 1, the gains were widespread, with 63% of its holdings finishing higher. All of the energy and financial companies posted gains, while MongoDB (NASDAQ: MDB) provided the biggest boost with a 13% gain, helping push the portfolio into the top spot.
Portfolio 3 gained just 0.6%, but that was enough to beat all three American indexes and make it my second-best-performing portfolio for the week. Unlike the other two portfolios, it had no big individual winners, but 53% of its holdings still finished higher. Seven of its ten largest holdings, including its two biggest, Nvidia and Shopify (TSX: SHOP), posted gains.
Overall, it was a solid week for my portfolios. While Portfolio 2 was the only one to outperform the TSX, all three beat the three U.S. indexes. Perhaps more encouraging was the breadth of the gains. Portfolio 3 showed that a portfolio doesn’t need a standout winner to produce a solid result when gains are spread across enough holdings.
Companies on the Radar
 While working on The AI Revolution Series, the opening comment in my recent ‘Weekly Update’ posts, I started thinking beyond the chips and data centres to something just as essential: the enormous amount of electricity needed to power them. That led me to take a closer look at power companies as another way to invest in the AI buildout.
I already own Fortis (TSX: FTS) and Brookfield Infrastructure (TSX: BIP.UN), both of which have exposure to the infrastructure needed to meet growing electricity demand. There are also several interesting US companies in this area, but because some can have different tax treatment for Canadian investors, I decided to focus my search closer to home. That led me to two new additions to my radar: Emera Incorporated (TSX: EMA) and Capital Power Corporation (TSX: CPX).
Emera is a Canadian energy company that owns regulated electricity and natural-gas utilities across North America, serving about 2.6 million customers. It makes money by providing reliable energy and earning regulated returns on the infrastructure it builds and operates. As AI data centres drive electricity demand higher, Emera could benefit from the need for more generation, transmission and distribution infrastructure. Its predictable cash flows and growing dividend make it an interesting way to invest in the power infrastructure behind the AI boom without investing directly in technology companies.
Capital Power is another Canadian electricity producer that generates power and sells it to businesses and other customers across North America. It has a more direct connection to the AI opportunity because data centres need enormous amounts of reliable electricity. Capital Power recently signed a long-term agreement to supply 250 megawatts of power to Meta’s new Alberta data centre. As AI drives the construction of more data centres – and therefore greater demand for electricity – Capital Power could benefit from supplying the power needed to keep them running.
With these two additions, the number of companies on my radar list has grown to six. More importantly, the list is starting to expand beyond the technology companies at the heart of the AI boom to include the businesses providing the infrastructure that makes the boom possible.
- Mattr Corp. (TSE: MATR): A Canadian industrial technology company that designs and manufactures specialized infrastructure products using advanced materials. The company may not be familiar to most investors, but its products support industries such as energy, electrification, communications, transportation, and water management. From composite pipes and underground storage tanks to specialized wire and cable solutions, Mattr creates products designed to be lighter, more durable, and resistant to harsh environments. Think of it as a behind-the-scenes supplier helping modern infrastructure operate more safely and efficiently, generating revenue by selling specialized products to industrial customers around the world.
- TerraVest Industries (TSE: TVK): A mid-cap Canadian industrial company that produces equipment for energy, storage, and transportation markets, including propane tanks, pressure vessels, and heating systems. It grows through a mix of organic expansion and acquisitions, serving steady, asset-heavy industrial niches across North America.
- S&P Global (NYSE: SPGI): A large cap American company and one of the world’s most important financial information companies. Most investors know it for the S&P 500 Index, but the business also provides credit ratings, market data, analytics, and research used by banks, corporations, governments, and investors worldwide. Think of it as one of the key information providers that helps global financial markets function, generating revenue through subscriptions, licensing fees, and rating services.
- Perimeter Solutions (NYSE: PRM): An American mid-cap company that produces specialty chemicals. Its best-known products are the fire retardants used to fight wildfires. If you’ve seen aircraft dropping bright red retardant over a wildfire, there’s a good chance it came from Perimeter. The company operates in a niche but essential market, supplying products and services that help protect communities, infrastructure, and natural resources during increasingly active wildfire seasons.
As always, these are not buy recommendations. Make sure to do your own research and choose investments that fit your personal financial goals.
The Radar Check was last updated August 14, 2026.


That’s a wrap for this week, thanks for reading – may your portfolio stay green and your dividends steady. See you next time!