
The AI Revolution: Understanding the Technology Behind the Investment Boom
Part 3: What Does It Take to Build AI?
Over the past two weeks, we’ve explored what artificial intelligence (AI) is and how AI models learn. In Part 2, we learned that training an AI model requires enormous amounts of data and incredible computing power.
The AI Revolution Series
- Part 1: What Is Artificial Intelligence? – What AI is, how it differs from human intelligence, and why today’s AI doesn’t think like people do.
- Part 2: How Does AI Learn? – What training means, how AI models learn from data, and why training requires enormous computing power.
- Part 3: What Does It Take to Build AI? – The chips, memory, networking, data centres, and electricity that make AI possible.
- Part 4: Why Does AI Cost So Much? – Why building and operating AI requires enormous investment, and why companies are willing to spend hundreds of billions to avoid falling behind.
- Part 5: What Are AI Capabilities? – The things AI can increasingly do, from understanding language and recognizing images to generating content, solving problems, and taking actions.
- Part 6: Why Are Companies Racing to Build AI? – How AI can improve productivity, reduce costs, create new revenue, and give companies a competitive advantage—and why businesses fear falling behind.
- Part 7: Investing in the AI Ecosystem – How investors can participate in the AI revolution, where companies fit into the ecosystem, and why AI exposure alone doesn’t make a stock a good investment.
But what does it actually take to build an AI system capable of doing all this?
Many people think of AI as software like ChatGPT, Gemini, or Claude.
AI is not just software running in the cloud. It requires a massive physical ecosystem of chips, memory, networking equipment, data centres, and energy.
Let’s take a closer look at the infrastructure that makes today’s AI revolution possible.
It all begins with AI chips.
Unlike the processor inside your laptop, which is designed to handle many different tasks one at a time, AI relies on specialized chips called Graphics Processing Units (GPUs). These chips can perform thousands of calculations simultaneously, making them far more efficient than traditional processors for training AI models and answering millions of questions every day. Nvidia (NASDAQ: NVDA) has become the industry leader by designing GPUs specifically for these demanding AI workloads.
Powerful chips alone aren’t enough.
Imagine trying to solve a puzzle while someone hands you one piece every few seconds. Even the fastest thinker would spend most of their time waiting. AI systems faces the same challenge. To keep thousands of GPUs working efficiently, they need immediate access to enormous amounts of information. That’s where high-speed memory comes in. Companies such as SK hynix (NASDAQ: SKHY), Samsung (KRX: 005930), and Micron (NYSE: MU) manufacture advanced memory that allows AI chips to retrieve data at incredible speeds, preventing costly bottlenecks.
The next challenge is communication.
Training today’s most advanced AI models requires thousands of GPUs working together rather than independently. They must constantly communicate information, much like members of a team collaborating on a massive project. This requires an incredibly fast networking infrastructure capable of moving enormous amounts of data with almost no delay. Companies such as Broadcom (NASDAQ: AVGO), Arista Networks (NYSE: ANET), Amphenol (NYSE: AMPH), and Corning (NYSE: GLW) supply many of the networking chips, switches, cables, and fibre-optic components that make this communication possible.
All of this hardware must be housed somewhere.
AI models are trained, stored, and operated inside specialized data centres—large facilities filled with servers, networking equipment, storage systems, and cooling equipment. Technology companies such as Microsoft (NASDAQ: MSFT), Amazon (NASDAQ: AMZN), and Alphabet (NASDAQ: GOOGL) are investing hundreds of billions of dollars building new AI data centres to support the growing demand for artificial intelligence.
Finally, there’s one requirement that often receives far less attention: electricity.
Training AI models and serving millions of users around the world requires enormous amounts of power, making electricity one of the most important resources in the AI ecosystem. As AI adoption accelerates, utilities and energy infrastructure companies are becoming increasingly important because they provide the power needed to keep these massive data centres operating around the clock.
For investors, the key takeaway is that AI is creating opportunities far beyond software. Semiconductor manufacturers, memory suppliers, networking companies, data-centre operators, utilities, and many others are all benefiting as businesses invest in the infrastructure needed to support the AI revolution.
Next week, we’ll explore why building this infrastructure costs hundreds of billions of dollars and why companies continue to invest at such an extraordinary pace.
While AI continues to be one of the biggest long-term investment themes, it is only one of many factors influencing markets in the short term. This week, investors weighed the latest employment data, a busy week of corporate earnings, and ongoing geopolitical developments. Let’s take a look at what happened in the markets and how my three portfolios performed.
Items that may only interest or educate me ….
Canadian Economic news, US Economic news, ….
Canadian Economic news
This past week’s key economic data that the Bank of Canada (BoC) considers when deciding whether to raise or lower the interest rate.
Labour Force Survey (LFS)
Canada’s labour market delivered a surprisingly strong July. According to Statistics Canada’s latest LFS employment report, the economy added 75,000 jobs – five times the number analysts had expected. Economists had been looking for an increase of just 15,000 jobs.
The unemployment rate also improved, falling to 6.4% from 6.5%. That was its lowest level in two years and marked the third consecutive monthly decline after unemployment reached 6.9% in April. Analysts had expected the rate to remain at 6.5%.
The job gains were broad-based and concentrated in the private sector, suggesting employers continued to add workers despite ongoing economic uncertainty. Even more encouraging, the stronger employment picture was accompanied by slower wage growth. Average hourly wages increased 2.8% year over year in July, down from 3.3% in June and below the 3.4% increase analysts had expected.
For the BoC, this is a favourable combination: the labour market is gaining momentum while wage pressures are easing. The stronger employment numbers reduce the need for the Bank to cut interest rates to support the economy, while slower wage growth provides less reason to worry about renewed inflationary pressure. As a result, the report makes it easier for the Bank to keep interest rates on hold while it waits to see whether the improvement in the labour market is sustained.
Canadian Market Volatility
Canada’s equivalent of the VIX is the S&P/TSX 60 VIX Index (VIXC). Like its American counterpart, it measures the level of volatility investors expect in the Canadian stock market over the next 30 days. Higher readings signal greater uncertainty, while lower readings suggest investors expect relatively calm market conditions.
The VIXC typically trades at lower levels than the VIX, reflecting differences between the Canadian and US stock markets. While the US market is heavily weighted toward high-growth technology companies that often experience larger price swings, the TSX has greater exposure to financials, energy, and materials, sectors whose performance is more closely tied to economic conditions and commodity prices.
The VIXC opened the week at 15.13, up slightly from the previous week’s close of 14.97. It hovered around the 15 level for most of the week as optimism grew that the Strait of Hormuz would remain open, easing fears of a major disruption to global oil supplies, and commodity prices strengthened. By Friday, the index had returned to 14.37.
Although Canadian markets faced many of the same headwinds as their US counterparts – including geopolitical tensions, inflation concerns, and weakness in technology stocks – the VIXC remained slightly below the VIX for most of the week. By Friday, however, the two gauges were very close. In other words, investors were expecting relatively calm conditions in both markets, despite the differences in their sector mix.
US Economic news
This past week’s key data points that the Federal Reserve (Fed) considers when deciding whether to raise or lower the interest rate.
Labour data
This week’s labour data comes from three key reports: the Job Openings and Labor Turnover Survey (JOLTS), the ADP Employment Report, and the Employment Situation Summary (ESS). Each measures a different part of the US labour market, helping investors build a more complete picture of employment conditions.
JOLTS tracks employer demand through job openings, hiring, and quits. ADP provides an early snapshot of private-sector hiring, while the ESS brings the broader picture together with job creation, the unemployment rate, and wage growth. Combined, these reports help investors determine whether the labour market remains resilient or is beginning to lose momentum.
Labor Department’s Job Openings and Labor Turnover Survey
The Bureau of Labor Statistics’ (BLS) JOLTS report showed job openings declined slightly to 7.4 million in June, down from 7.6 million in May. The report suggests the labour market remains in a “slow hire, slow fire” environment, with companies becoming more cautious about adding workers but not yet making significant workforce reductions. While demand for workers has moderated from earlier in the recovery, hiring conditions remain relatively stable.
ADP Employment Report
The ADP Employment Report showed US private-sector employers added just 44,000 jobs in July, down from June’s downwardly revised 95,000 and well below analysts’ expectations of 70,000. It was the weakest monthly increase in private-sector employment in six months.
The report reinforces the view that employers are becoming more cautious about adding workers. However, with layoffs remaining low and wage growth still relatively strong, the data points to a labour market that is cooling gradually rather than experiencing a broad-based deterioration.
The Bureau of Labor Statistics’ Employment Situation Summary (ESS).
The latest jobs report showed the U.S. economy lost 23,000 jobs in July, falling well short of analysts’ expectations for an 80,000-job gain. The result also represented a sharp slowdown from June’s downwardly revised gain of 20,000 jobs and the average monthly increase of 34,000 jobs over the previous 12 months. Adding to the signs of a cooling labour market, May’s initially strong job growth was revised sharply lower, from 129,000 jobs added to 63,000.
The unemployment rate dipped slightly to 4.1% from 4.2% in June, better than analysts’ expectations of an unchanged reading. However, the improvement was not driven by stronger employment growth. Instead, the decline partly reflected lower labour force participation, suggesting the headline unemployment rate may overstate the underlying strength of the labour market.
Wage growth remained steady in July, with average hourly earnings flat for the month. On a year-over-year basis, wage growth slowed to 3.2% from 3.5%.
Overall Labour Takeaway
Taken together, this week’s labour reports show that the US labour market is gradually losing momentum. JOLTS indicates that employer demand is easing, while ADP and the ESS show that actual hiring is slowing. The US labour market is cooling, but the slowdown is occurring through weaker hiring rather than widespread layoffs. Employers are becoming more cautious about adding workers, with job openings declining, private-sector job growth slowing, and overall payroll growth coming in below expectations.
For the Fed, the combination of slower hiring and moderating wage pressures creates a more balanced policy environment. It reduces the need for further rate increases while giving the Fed more flexibility to support the labour market if economic conditions continue to weaken.
For investors, the latest data shifts the conversation from whether the labour market is too strong to whether it is cooling at a manageable pace. The next challenge for the Fed will be determining whether this slowdown represents a normal return to a more balanced labour market or an early warning sign of a broader economic downturn.
American Market Volatility
The VIX – often called the market’s “fear gauge” – measures expected volatility in the S&P 500 over the next 30 days. In simple terms, it reflects how much uncertainty investors expect in the market. The index typically rises when investors become more cautious and falls as confidence returns. Readings above 20 are generally associated with elevated volatility, while levels below 20 usually indicate a calmer market environment.
The VIX opened the week at 16.03, virtually unchanged from the previous week’s close of 15.99, and remained relatively steady throughout the week. Growing confidence that the Strait of Hormuz would remain open eased fears of a major disruption to global oil supplies, while corporate earnings generally met expectations. With no major surprises to rattle investors or increase fears of a sharp market decline, the VIX finished the week at 14.90.
Weekly Market and Portfolio Review
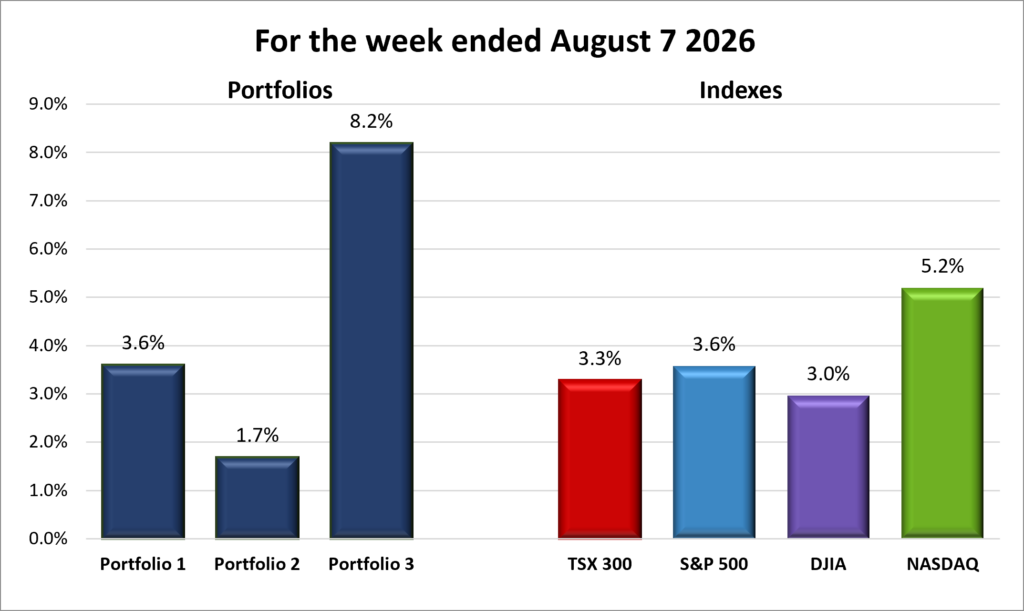
For the week, the TSX (SPTSX) gained 3.3%, the S&P 500 (SPX) climbed 3.6%, the DJIA (INDU) advanced 3.0% and the Nasdaq (CCMP) surged 5.2%.
| Index | Weekly Streak |
| TSX: | 1 – week winning streak |
| S&P: | 2 – week winning streak |
| DJIA: | 2 – week winning streak |
| Nasdaq: | 2 – week winning streak |
 In what was a busy week of earnings, the markets started on a strong note before facing a late-week pullback. However, investors quickly regained their footing, and all four indexes bounced back on Friday to extend their weekly gains and finish in positive territory. The Dow Jones Industrial Average (DJIA) led the way with three consecutive record high closes to start the week, followed by the Toronto Stock Exchange Composite Index (TSX) with its own two-day streak of record closes. The S&P 500 Index (S&P) also reached a new record high, while the Nasdaq Composite Index (Nasdaq) was the strongest performer among the major indexes despite not setting a new record.
The US markets were driven by a combination of strong corporate earnings, evolving expectations around AI spending, and the latest labour market data. Optimism that shipping through the Strait of Hormuz could remain uninterrupted also helped reduce geopolitical concerns. Although markets moved higher, investors continued to look beyond the headline numbers and focus on whether companies could justify elevated valuations through sustainable growth.
Corporate earnings remained the biggest influence on trading. Results from many large US companies exceeded expectations, reinforcing the view that businesses continue to deliver solid profit growth despite an uncertain economic environment. However, earnings beats alone were no longer enough to guarantee a positive market reaction. Investors also wanted to see convincing guidance and evidence that companies could sustain growth. Companies with strong results and positive outlooks were rewarded, while those facing valuation concerns or slowing growth expectations were punished.
AI remained another major market theme, but investor expectations continued to evolve. Earlier in the AI rally, announcements of increased spending on chips, data centres, and infrastructure were often enough to lift stock prices. Investors are now asking whether these massive investments are generating meaningful revenue and profits. Companies showing clear benefits from AI adoption continued to attract interest, while those increasing spending without a clear path to returns faced greater scrutiny.
Labour market data became the final major focus of the week as investors assessed whether the US economy was experiencing a healthy slowdown or something more concerning. Job growth slowed, previous months were revised lower, and wage growth moderated, creating a more balanced environment for the Fed. Slower hiring reduces the need for further rate increases while giving the Fed more flexibility to support the labour market with lower rates if economic conditions weaken further.
In Canada, it was a short week due to a civic holiday, but the TSX still posted a strong gain and returned to the weekly win column. The TSX benefited from strength in some of its largest sectors, including financials, energy, and basic materials.
Financial stocks were among the biggest contributors to the TSX’s strength, reflecting the sector’s outsized influence on Canada’s benchmark index. Financials are now the largest sector on the TSX, with Canada’s major banks and insurers playing a significant role in overall market performance. Investors continued to favour the sector due to attractive valuations and expectations that the interest rate environment will remain supportive.
Energy stocks also contributed to the TSX’s gains as oil prices stabilized following recent volatility. Easing concerns around global supply disruptions reduced uncertainty in energy markets, while Canadian producers continued to benefit from strong balance sheets and disciplined spending. Basic materials stocks provided additional support as investors continued to seek exposure to commodities, particularly gold, with expectations for lower interest rates supporting precious metals.
Overall, the week showed that market performance is often determined by which sectors are leading at any given time. Investors continued to focus on earnings growth and whether companies could translate current investments into future profits. In the US, attention remained on technology companies benefiting from the AI investment cycle, while the TSX benefited from strength in financials, oil producers, and gold miners.
| Portfolio | Weekly Streak |
| Portfolio 1: | 2 – week winning streak |
| Portfolio 2: | 2 – week winning streak |
| Portfolio 3: | 2 – week winning streak |
With oil prices stabilizing this past week, energy stocks gave back some of their recent strength. Technology stocks, however, had a much better week as several companies reported stronger-than-expected earnings and provided encouraging outlooks. With technology stocks making up an outsized portion of all three portfolios – more heavily weighted in some than others – the sector’s strong performance provided a significant boost to my portfolios.
One of the more interesting earnings stories was Shopify (TSE: SHOP). Some analysts had viewed AI as a potential headwind for the e-commerce company, but its latest results suggested the opposite. Shopify shares jumped after the company reported better-than-expected results and a strong outlook for the third quarter, with its AI initiatives helping attract more merchants to its suite of e-commerce services. The stock finished the week up 24%.
Portfolio 1 had a strong week, gaining 5.0%. It was a great result, but not enough to take the top spot this week. With 58% of its holdings finishing the week higher, the portfolio benefited from strong performances by Navitas Semiconductor (NASDAQ: NVTS), which climbed 32%, Magnite (NASDAQ: MGNI), up 27%, the iShares S&P/TSX Global Gold Index ETF (TSE: XGD), up 19%, and Nvidia, which gained 12%.
The biggest drags were Datadog (NASDAQ: DDOG), which fell 13% after warning that one of its largest customers had reduced its use of the company’s services, leading to a weaker-than-expected revenue outlook, and Celestica (TSE: CLS), which declined 13%.
Portfolio 2 was the laggard, gaining 2.6% and trailing both my other portfolios and all four indexes. The energy stocks that had helped support the portfolio through the volatility of the past few months became a drag this week, while 51% of its holdings finished higher. Airbnb (NASDAQ: ABNB) jumped 16% following its latest quarterly results, while MongoDB (NASDAQ: MDB) gained 14% and Napco Security (NASDAQ: NSSC) rose 11%.
Portfolio 3 was the standout performer, surging 9.3% and comfortably beating the Nasdaq’s 5.2% gain. It also had the highest percentage of winners, with 73% of its holdings finishing the week higher. Rocket Lab (NASDAQ: RKLB) and Magnite both climbed 27% or more, while Shopify and Corning each gained 24%. Vertiv Holdings (NYSE: VRT) added 14%, while Nvidia and Broadcom both rose 12%. MDA Space (TSE: MDA) also had a strong week, gaining 10%.
The portfolio’s biggest blemish was Canada Packers (TSE: CPKR), which fell 10%, but its decline was easily overshadowed by the broad strength across the rest of the portfolio.
One other milestone caught my attention this week. Amazon crossed the US$3 trillion market-cap threshold, becoming the fifth company ever to reach that milestone. That puts it in an exclusive club alongside Nvidia, Apple (NASDAQ: AAPL), Alphabet, and Microsoft. Even more interesting from my perspective, all five companies are held in at least one of my three portfolios. 😊
That was certainly a great way to start August. 😊
Companies on the Radar
 With most of my recent buying focused on increasing existing positions, it was a relatively quiet week on my stock radar. No new companies stood out, so the same four businesses remain on my watchlist.
- Mattr Corp. (TSE: MATR): A Canadian industrial technology company that designs and manufactures specialized infrastructure products using advanced materials. The company may not be familiar to most investors, but its products support industries such as energy, electrification, communications, transportation, and water management. From composite pipes and underground storage tanks to specialized wire and cable solutions, Mattr creates products designed to be lighter, more durable, and resistant to harsh environments. Think of it as a behind-the-scenes supplier helping modern infrastructure operate more safely and efficiently, generating revenue by selling specialized products to industrial customers around the world.
- TerraVest Industries (TSE: TVK): A mid-cap Canadian industrial company that produces equipment for energy, storage, and transportation markets, including propane tanks, pressure vessels, and heating systems. It grows through a mix of organic expansion and acquisitions, serving steady, asset-heavy industrial niches across North America.
- S&P Global (NYSE: SPGI): A large cap American company and one of the world’s most important financial information companies. Most investors know it for the S&P 500 Index, but the business also provides credit ratings, market data, analytics, and research used by banks, corporations, governments, and investors worldwide. Think of it as one of the key information providers that helps global financial markets function, generating revenue through subscriptions, licensing fees, and rating services.
- Perimeter Solutions (NYSE: PRM): An American mid-cap company that produces specialty chemicals. Its best-known products are the fire retardants used to fight wildfires. If you’ve seen aircraft dropping bright red retardant over a wildfire, there’s a good chance it came from Perimeter. The company operates in a niche but essential market, supplying products and services that help protect communities, infrastructure, and natural resources during increasingly active wildfire seasons.
As always, these are not buy recommendations. Make sure to do your own research and choose investments that fit your personal financial goals.
The Radar Check was last updated August 7, 2026.


Portfolio Update
Portfolio 2
Bought: Aritzia (TSE: ATZ): This is my third investment in the fast-growing Canadian fashion retailer since my initial investment back in November 2025. Since then, the underlying business has continued to grow rapidly, while becoming increasingly profitable. That’s exactly what I like to see in the companies I invest in. 😊
What I find particularly interesting is the runway ahead. Aritzia has already established a strong brand in Canada and is successfully building that presence across the much larger US market. At the same time, the company is expanding its digital business, which complements its growing network of stores. New stores introduce the brand to more customers, while digital sales allow Aritzia to reach those customers without needing a physical location in every market. Management’s decision to raise its fiscal 2027 outlook following the latest results suggests that the momentum is continuing.
With revenue growing rapidly, profitability improving, and the company expanding into new markets, I believe Aritzia is a better business today than when I first took an ownership position. That’s why I’m comfortable increasing my ownership position. I’m not buying Aritzia simply because it has been a winner, though that helps; I’m adding because I believe the underlying business still has plenty of room to grow. And, as a bonus, I was able to make the purchase on a dip.
That’s a wrap for this week, thanks for reading – may your portfolio stay green and your dividends steady. See you next time!