For the last few months, I have been trying to ignore the share price fluctuations, er, downwards trend, and instead, focus on the companies I own. Sometimes that is easier said than done. This week is no exception. It was almost like shooting fish in a barrel when it came to selecting technology companies in 2020 -2021 (much like it was in the late 1990s). However, 2022 has been a whole different investing environment. Now is when doing your homework is more important than ever. Performing due diligence is key to identifying the companies that can survive this downturn and thrive when the markets turn around. In that vein ….
…. Its time for another discussion of the process I follow when researching companies. 😊
The last two weeks, I have been discussing my process for identifying companies I would like to own, even though it would be a very, very, small piece of the company. To that end, I have created a 4-stage process to quickly eliminate companies from consideration as I work my way through the process. These stages are:
- Stage 1 – Radar Check
- Stage 2 – Multibagger Analysis
- Stage 3 – Financial Analysis
- Stage 4 – Scorecard
The previous 2 weeks I explained stages 1 and 2 of my 4-part process. This is where companies go through an initial 5-minute, high level look at a company (Radar Check). If the company passes the Radar Check, the company moves on to a much deeper analysis (Multibagger Analysis). If the company passes this stage, I am confident in the company, but I want to take a look at the numbers to verify my impression of the company and identify any areas of concern. This stage is called Financial Analysis (sorry, no fancy name like in the previous two stages) and is what I am going to describe this week.
Financial Analysis
Before your eyes start to glaze over at the mention of financial analysis, hear me out. This is probably the fastest section to complete of the entire process. I am not a numbers person, but I realize they have value. It is easy to tell a good story, but numbers do not lie. After getting familiar with a company from the previous two stages, I am expecting to see numbers consistent with the story. If I do not see the numbers I expect, this raises a yellow flag. I will take a quick look to see if I can figure out why the discrepancy but if I cannot determine why the numbers do not match my impression, I will consider the company as either ‘too hard’ or ‘suspicious.’ Either way, I will move on to another company.
As with the previous two stages, I use an Excel spreadsheet. On the left of the spreadsheet is the data entry section and on the right are the numerous calculations (15 to be exact) that I created. Currently, I have all the financial information I want, but if I come across another useful financial metric, I would build the formula in the Calculations side of the spreadsheet. If the required data is not already collected in the Data section, I would insert a column in the Data section to collect the necessary information to complete the calculation. The calculations are fairly straightforward, they can be found on various websites, then it is just a matter of creating the formulas in Excel.
Data section
For this section, I get the information from either Microsoft or Yahoo! Finance. The data supplied by Microsoft is automatically generated thanks to Excel’s built in Stocks data type which is linked to an online data source (Refinitiv). Using this data saves me from having to manually enter it and constantly updating it.
The data I get from Yahoo! Finance I must look up and enter manually. The bulk of the information can be found under the Financials tab, with the numbers in the Income Statement, Balance Sheet, or Cash Flow statements. Other information from Yahoo! Finance can be found under the Analysis, Statistics, and Summary tabs. I have organized the columns so I all information from one section is together, then I move to the next section and collect all the information from that page before moving to the next section. It is tedious but it only takes a few minutes to collect all the information for a company.
Calculations section
All the work was done creating the formulas back when I originally created this spreadsheet so there is not much, if anything, to do in this section. Once all the data has been entered, all the calculations occur automatically, and I have all the information I need.
At this point I do a quick review of the numbers to see if anything odd has shown up, such as a typo when I was entering the data. If any mistakes occurred, I correct them and then I am done.
A lot of the information can be found on various web sites, but I chose to perform the calculations for myself for a few reasons. First, I felt if I did the calculations myself, I would better understand the numbers and how they were related. If I just saw the result, I would not learn how the different pieces of information were related. Second, now that the all the formulas are created, its faster for me to go to Yahoo! Finance and enter the numbers rather than visiting numerous sites to find the information, especially for companies that are only listed on the Toronto Stock Exchange. Finally, it gave me chance to utilize my Excel skills (which had gone rusty) 😊.
If you are a numbers person, then check out the numbers of companies you are interested in to see if the company’s ‘story’ matches with what the numbers are telling you. Either build your own spreadsheet or check the numbers at Yahoo! Finance, MSN Money, or Google Finance. If you are not a numbers person, do not worry about it. However, you should at least be aware of the company’s revenues (sales) and net income (you want them improving, or at least an explanation why they are not), as well as their Cash & Cash Equivalents (the more the better) and long-term debt (the less the better). The more debt, the more cash required to service that debt, therefore less cash to grow the company or pay you a dividend.
That is it for financial analysis. If you made it this far, thank you! 😊 Next week, I will go over the final stage of my process. For now, lets take a look at what happened this past week in the markets and the Portfolios…
Weekly Market Review
Monday: A good day as all four major North American Indexes made it into the black, but barely. In Canada, the Toronto Stock Exchange Composite Index (TSX), was dragged upward by the Technology and Energy sectors.
In the US, the big news was Amazon (NASD:AMZN) splitting their shares 20 for 1, sparking a surge in mega cap companies. The mega cap rally lifted the S&P 500 Index (S&P) and the Nasdaq Composite Index (Nasdaq). The Dow Jones Industrial Average (DJIA) had a late afternoon rally to complete the sweep of Indexes ending the day in positive territory.
Tuesday: With a second consecutive day with all four Indexes finishing higher, a streak has begun, but how long will it last. And which Index will be the first to falter?
All four Indexes were led upward by the Energy (oil prices rose again) and the Technology sector. In Canada, Shopify’s (TSX:SHOP) rise drove the Technology sector, while the gain of mega cap companies drove the Technology sector on the US Indexes.
Wednesday: The winning streak ended today with all four Indexes falling back. The TSX was led lower by the Financial and Technology sectors. In the US, it was a broad-based selloff as only the S&P Energy sector ended the day higher. It appears that investors got the jitters in anticipation of the release of US consumer price index on Friday. If the data shows inflation has creeped higher, it all but guarantees a 0.5% interest rate hike later in June, followed by similar interest rate hikes in July and September. As you know, higher interest rates do not bode well for technology and other growth stocks.
Thursday: The spectre of looming interest rate increases in both Canada and the US dragged all four Indexes lower today. Of the Canadian sectors, only the Utilities sector posted a gain, a meager one at that. In the US, all the S&P sectors declined as investors await the release of the US consumer price report on Friday.
Friday: Inflation in the US hit a 40 year – 8.6%, all but guaranteeing a summer of aggressive interest rate hikes. The inflation rate was higher than expected so naturally this sent the stock markets into a sharp decline. The resource heavy TSX was the ‘best’ of the four Indexes, only falling 1.4%. The technology heavy Nasdaq and S&P bore the brunt of todays news, the falling 3.75% and 2.91%, respectively. The DJIA’s ‘only’ fell 2.73%.
In Canada, the Technology sector fell the hardest as higher interest rates reduce the future cash flows that high growth, technology companies are expected to generate.
In the US it was a similar story, the technology and other high growth companies took it in on the chin thanks to the higher-than-expected rise in inflation. After another bad week, the S&P 500 is down 18.2% for the year so far and the Nasdaq is down about 25%.
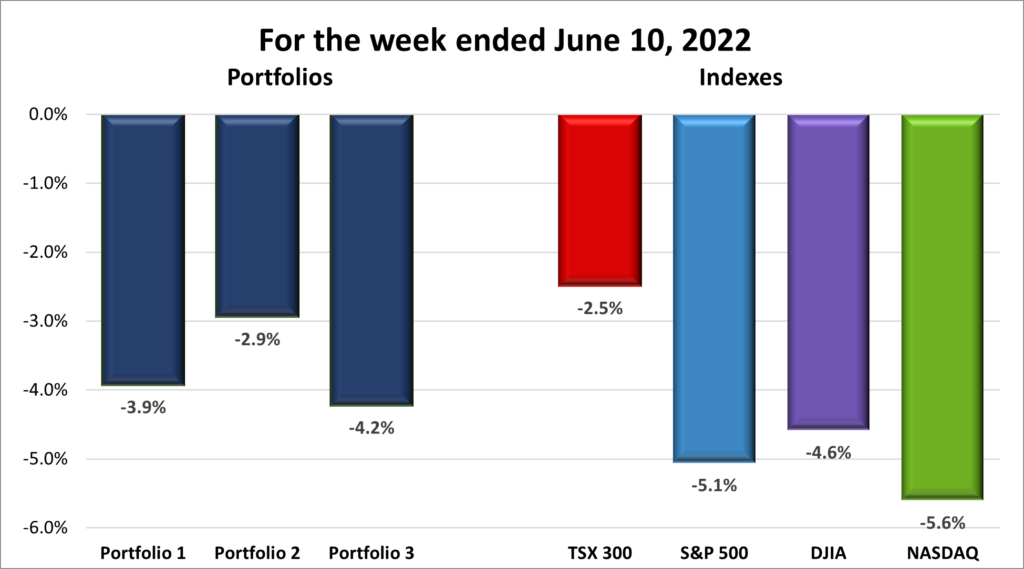
For the week, the TSX was down 2.5%, the S&P fell 5.6%, the DJIA dropped 4.58%, and the Nasdaq declined 5.60%.
Weekly Portfolio Review
The week started off innocently enough with 2 days of modest gains for all four Indexes. Followed by 2 days of a minor pullback in anticipation of the American Consumer Price Index Report (CPI) on Friday. Then the wheels fell off. The CPI was higher than expected and the markets do not like surprises, especially bad news. This bad news turned what was looking like an essentially treading water week for the Indexes into a week of losses.
If the Indexes are down, there is a good chance the Portfolios are down. If the Indexes drop considerably, like this past week, it is all but guaranteed the Portfolios fell. And fall they did. The only bright spot I can take away is all three Portfolios had a better week than the US Indexes. A shallow victory, but I will take it.
Barring a major decline in the June inflation rate, I am expecting the Indexes and the Portfolios to have another tough few months. Both the Bank of Canada and the US Federal Reserve have all but guaranteed they will raise interest rates at least 0.5% a few times over the coming months, with talk the Bank of Canada might crank rates up 0.75%. It should be an interesting, if not painful, summer.
Companies on the Radar
In previous weeks, the Radar list has drifted from my original intention of a list of companies that caught my eye, for one reason or another. It has gradually transformed into a list of companies I would be interested in buying if I had the money. Not only has the intent changed, but because I do not have any spare cash this list became stagnant. I have reverted to the original purpose of the radar List: a tight list of companies that have recently caught my eye. These companies could be completely new to me; companies I am familiar with and do not own but have suddenly become accessible (share price is within my reach); or currently owned companies that are selling at a great discount for no good reason. Currently, there are only two companies on the Radar List:
- Alvopetro Energy Ltd.: (TSXV:ALV) A Canadian oil and natural gas company, developing assets in Brazil. There is a huge global demand for oil and natural gas and Alvopetro is riding this tailwind. In addition, the company is paying a 5% dividend.
- Amazon: They are the leader in e-commerce sales, the leader in cloud services (Amazon Web Services), one of the top providers of streaming services through their Prime service; and they quietly have their finger in a number of other pies. Thanks to their recent stock spit (20:1), Amazon is more accessible to retail investors (like me), and they are once again on my radar.
Portfolio Update
Portfolio 1
Portfolio 1 highlights for the week ended June 10, 2022: DOWN 
- In an unusual move, despite strong and growing demand for electric vehicles, GM (NYSE:GM) is lowering the price of its Chevy Bolt electric vehicles. However, there is a method to their madness. GM is trying to get a bigger share of the growing electric vehicle market with these entry level cars while it increases production of newer, higher end models. The hope must be car buyers will think GM, as well as Tesla (NASD:TSLA), when considering an electric vehicle. In other GM news, GM’s self driving division Cruise, received commercial approval for its robotaxi service in San Francisco.
- This past week was Apple’s (NASD:AAPL) Worldwide Developers Conference. They introduced several new products, and announced a buy now pay later service that will be fully integrated into their Apple Pay service. This new service will be part of the upcoming iOS 16 update. As well, its rumoured that the company that sparked smartphone boom is reportedly nearing the launch of its first augmented reality headset. Both from a personal level and financial level, I am interested to see this new headset and the reaction to an Apple augmented reality headset. If it turns out to be another game changer like the iPhone, Apple stock should get a nice bump. 😊
- In other Apple news, the European Union settled on a single charging port for cell phones, tablets, and cameras by 2024. That port will be a USB-C, meaning Apple will have to either have one charging port for Europe (USB-C) and one for the rest of the world (their current Lightening port) or completely switch to USB-C. After having a few different cell phones over the years, it will be great to finally have 1 universal charging port rather than having to buy a new set of accessories every time Apple has ‘a better way’.
- Docebo (TSX:DCBO) and WELL health technologies (TSX:WELL) will be among 6 companies removed from the S&P/TSX Composite Index effective June 20, 2022. These changes were a result of a quarterly review of the companies in the Index. Of the 6 incoming companies, 5 will be from the Energy and Basic Materials sectors. These changes should not be a surprise given the weakness in technology companies and strength in energy and mining companies. I look forward to when technology companies replace energy and mining companies. 😊
- The investigation into Tesla’s Autopilot (advanced driver assistance system) has moved to the next stage, an engineering analysis. This step is required before the National Highway Traffic Safety Administration can request a recall of Tesla vehicles with Autopilot installed.
Activity
No significant activity to report this week.
Dividends
Dividends Received this week for the following companies:
Companies followed by DRIP (Dividend Re-Investment Plan) indicate additional shares were purchased with the dividend. Any cash leftover was added to the cash balance.
Canadian $
No C$ dividends this past week.
US $
ZIM Integrated Shipping Services Ltd (NYSE:ZIM)
Quarterly Reports
DocuSign, Inc.
All currency listed in US dollars
Selected highlights from their first quarter 2023 financial results on June 9, 2022
- Revenue was $588.7 million, an increase of 25% year-over-year.
- Gross margin was 78% for first quarter 2023 and 2022.
- Net loss per basic and diluted share was $0.14 on 200 million shares outstanding compared to $0.04 on 194 million shares outstanding in the same period last year.
- Net cash provided by operating activities was $196.3 million compared to $135.6 million in the same period last year.
- Free cash flow was $174.6 million compared to $123.0 million in the same period last year.
- Cash, cash equivalents, restricted cash and investments were $1,063.8 million at the end of the quarter.
- Added nearly 67,000 new customers, bringing the total global customer base to 1.24 million.
Portfolio 2
Portfolio 2 highlights for the week ended June 10, 2022: DOWN
- Disney (NYSE:DIS) launched its streaming service Disney+ in the largely untapped Middle East and North Africa.
Activity
No significant activity to report this week.
Dividends
Dividends Received this week for the following companies:
Companies followed by DRIP (Dividend Re-Investment Plan) indicate additional shares were purchased with the dividend. Any cash leftover was added to the cash balance.
Canadian $
No C$ dividends this past week.
US $
Microsoft (NASD:MSFT)
Quarterly Reports
No quarterly reports this past week.
Portfolio 3
Portfolio 3 highlights for the week ended June 10, 2022: DOWN
- Shopify shareholders voted in favor of giving Chief Executive Officer Tobias Lutke a Founders share, ensuring he will retain a 40% voting stake and effective control of the company until he leaves Shopify. Shares of Shopify jumped 5.3% upon release of this news.
- Enghouse Systems (TSX:ENGH) took a major hit on Wednesday, falling 20%, after a less than impressive earnings reports. Top line (revenues) and bottom line (net income) were both lower than 2021 numbers. Not a good sign at all!
Activity
No significant activity to report this week.
Dividends
Dividends Received this week for the following companies:
Companies followed by DRIP (Dividend Re-Investment Plan) indicate additional shares were purchased with the dividend. Any cash leftover was added to the cash balance.
Canadian $
No C$ dividends this past week.
US $
Microsoft (NASD:MSFT)
Quarterly Reports
Enghouse Systems Ltd
All currency listed in CAD dollars
Selected highlights from their second quarter 2022 financial results on June 7, 2022
For the three and six months ended April 30, 2022, compared to the three and six months ended April 30, 2021, are as follows:
- Revenue achieved was $106.3 and $217.4 million, respectively, compared to revenue of $117.3 and $236.4 million.
- Results from operating activities was $31.1 and $66.8 million, respectively, compared to $36.9 and $77.6 million.
- Net income was $17.9 and $39.5 million, respectively, compared to $20.7 and $41.4 million.
- Ended the second quarter with $231.2 million in cash, cash equivalents, and short-term investments with no external debt.