What’s the Value of Valuation?
When I got back into investing, one of the most common terms I heard was valuation. I knew what value was – one always wants to get good value for their money, or not overpay for an item. But the term “valuation” seemed a bit different, although I could never quite put my finger on why it felt separate from simply “getting good value for your money.” The difference, I eventually realized, is that in investing, price and value don’t always move together – and that gap between the two is where a lot of opportunity (and risk) tends to show up. This week, I’ll break down what valuation actually means and why it matters when you’re trying to get good value for your money in the stock market.
Valuation is one of the most important concepts in investing, but it’s also one of the easiest to overlook. At its core, valuation is simply about how much you’re paying for a company compared to what it actually earns and produces. Investors often use metrics like the price-to-earnings (P/E) ratio to get a sense of whether a stock looks cheap, fair, or expensive, but the idea itself is much simpler than the numbers might suggest.
What makes valuation so important is that it sets your starting point as an investor. Even the strongest businesses in the world can turn into disappointing investments if you pay too high a price. On the other hand, buying a solid company at a reasonable valuation can give you a much smoother ride over time. In many ways, your long-term return isn’t just about how the company performs, but also about the price you paid to become an owner of it.
This becomes especially relevant in today’s market, where certain sectors – particularly technology and artificial intelligence (AI)-related companies – are often trading at higher valuations. These higher price tags usually reflect strong expectations for future growth. Investors aren’t just paying for what the company is today, they’re paying for what it could become.
Take a company like Nvidia (NASD: NVDA). It’s been one of the biggest winners in the AI boom, with explosive growth and strong demand for its chips. Because of that, its valuation has often traded at a premium. That doesn’t mean it’s a bad investment, but it does mean the bar is set high. Investors are expecting continued rapid growth, and if that growth slows even a little, the stock can react quickly, as we’ve seen after a strong quarterly earnings report and forecast but falls just short of investors’ lofty expectations.
On the other hand, Shopify (TSE: SHOP) offers a great example of how valuation and volatility often go hand in hand. The company has gone through periods of rapid growth followed by sharp pullbacks, sometimes driven more by changing expectations than by the business itself. For long-term investors, those pullbacks can create opportunities. When the share price drops and valuation comes down, it can offer a more attractive entry point and more upside if the company continues to grow over time.
That’s where the risk comes in. When expectations are high, there’s less room for things to go wrong. If a company continues to deliver strong results, the stock may still do well, but if growth slows or expectations aren’t met, the reaction can be sharp. This is why higher-valuation stocks tend to be more volatile. The price already assumes a lot of success, so even small disappointments can have a bigger impact.
This ties into the idea of a “margin of safety,” which is essentially your cushion as an investor. When you buy a company at a lower or more reasonable valuation, you give yourself some protection if things don’t go perfectly. With a higher valuation, that cushion becomes much thinner, meaning the investment depends more heavily on everything going right.
It’s a concept that Warren Buffett has talked about for decades. One of his most well-known ideas is that “price is what you pay, value is what you get.” In other words, the return you earn isn’t just about finding great businesses, it’s about not overpaying for them.
One of the simplest ways to think about valuation is like buying a home. Paying a fair price for a good property gives you flexibility and room to grow over time. Overpaying, even for a great home, can limit your upside and increase your risk if conditions change.
As you’ll see in this week’s update, valuation played a role in deciding which companies stay on my Radar List and an investment decision. It’s not about avoiding great companies, but about being mindful of the price you’re paying to own them. With that in mind, let’s take a look at what happened this past week and how it shaped the three portfolios….
Items that may only interest or educate me ….
Canadian Economic news, US Economic news, ….
Canadian Economic news
This past week’s key economic data that the Bank of Canada (BoC) considers when deciding whether to raise or lower the interest rate.
Canadian Market Volatility
Canada’s version of the market “fear gauge” is the S&P/TSX Volatility Index (VIXC), often shown on trading platforms as VIXI.TO. Like the better-known CBOE Volatility Index in the US, it measures how much volatility investors expect in the Canadian stock market over the next 30 days.
The index opened the week at 18.68 as the US Navy began its blockade of Iranian ports, before dropping into the low 16 range after the US indicated Iran was open to working out a deal. Later in the week, concerns about the impact of higher oil prices on the broader economy pushed the index back above 17. That move didn’t last long. As tensions eased and Iran signalled it would reopen the Strait of Hormuz to all vessels, the VIXC drifted lower again, closing the week at 16.30.
With the VIXC ending the week in the mid-teens and trending lower, it suggests investor confidence is gradually improving. It’s also worth noting that Canadian volatility typically runs lower than in the US, largely because the TSX is more heavily weighted toward financials, energy, and materials. These sectors tend to see steadier price movements compared to the high-growth technology stocks that dominate US markets.
US Economic news
This past week’s key data points that the Federal Reserve (Fed) considers when deciding whether to raise or lower the interest rate.
American Market Volatility
The CBOE Volatility Index (VIX), often referred to as the market’s “fear gauge,” tracks how much volatility investors expect over the next 30 days. Think of it as the market’s pulse, where readings above 20 typically signal rising uncertainty, while levels below 20 suggest a more stable environment.
That uncertainty showed up early in the week. Reports that the US Navy would blockade the Strait of Hormuz, limiting vessels entering or exiting Iranian ports, pushed the VIX above 20, opening at 21.17 as investors grew more cautious.
Sentiment began to shift shortly after. Comments from President Trump that the US had been contacted by Iran to “work out a deal” helped ease tensions, and the VIX quickly dropped back to just above 19 before continuing to trend lower.
By midweek, the VIX reached its lowest level since February 26, as a strong start to earnings season and growing optimism around potential peace talks helped calm markets. It eventually closed the week at 17.48 after Iran announced it would reopen the Strait, and the US suggested peace talks could resume over the weekend. This suggests investor sentiment remained relatively steady, with only a brief uptick in uncertainty that faded as the week went on.
Weekly Market and Portfolio Review
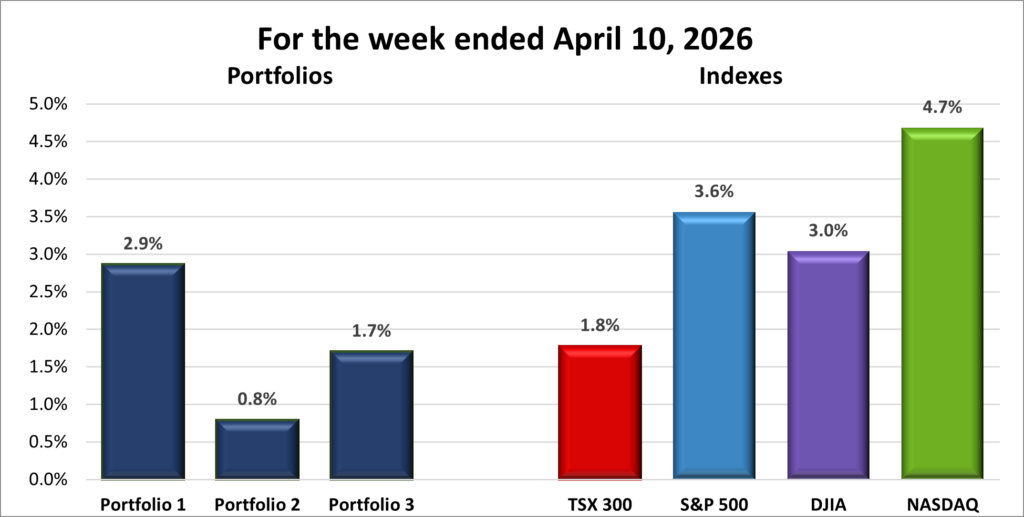
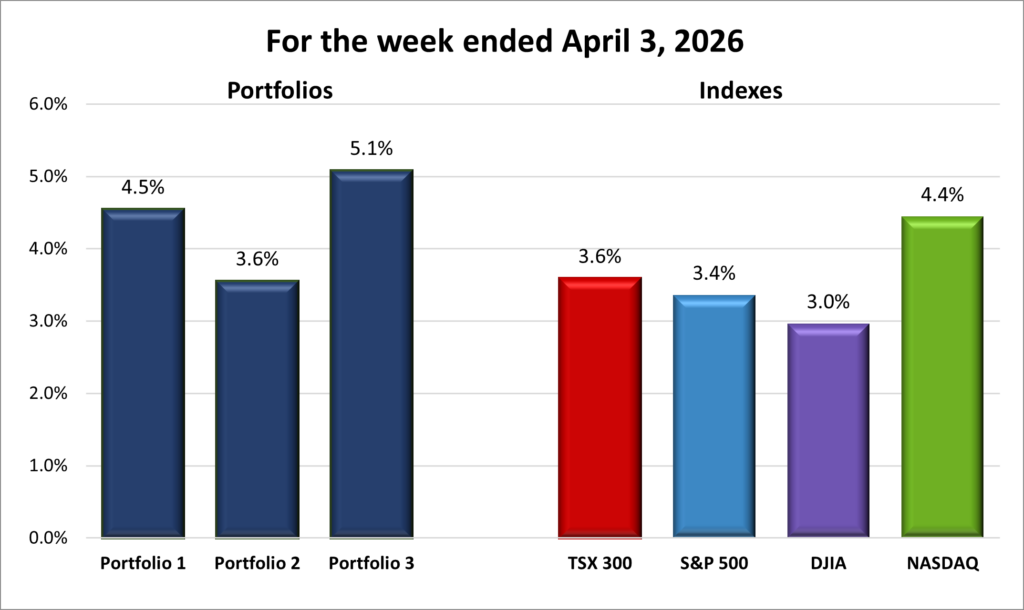
For the week, the TSX (SPTSX) gained 1.9%, the S&P 500 (SPX) climbed 4.5%, the DJIA (INDU) advanced 3.2% and the Nasdaq (CCMP) surged 6.8%.
| Index | Weekly Streak |
| TSX: | 4 – week winning streak |
| S&P: | 3 – week winning streak |
| DJIA: | 3 – week winning streak |
| Nasdaq: | 3 – week winning streak |
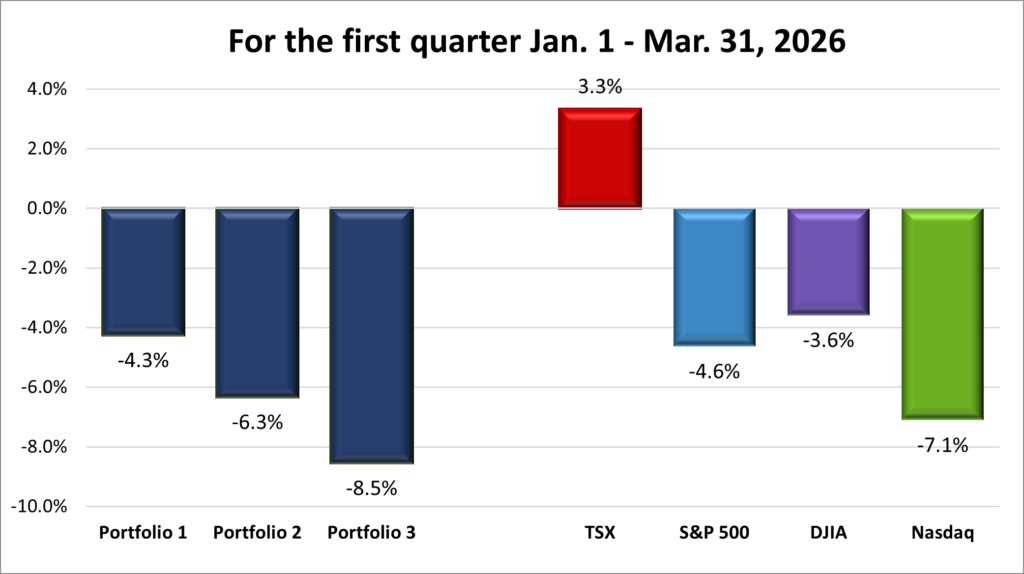
![]() The momentum from the past few weeks carried into this one, with the S&P 500 (S&P) and the Nasdaq Composite (Nasdaq) joining the Toronto Stock Exchange Composite Index (TSX) and the Dow Jones Industrial Average (DJIA) back in positive territory for 2026. It took a while, but the markets finally got there. 😊
The momentum from the past few weeks carried into this one, with the S&P 500 (S&P) and the Nasdaq Composite (Nasdaq) joining the Toronto Stock Exchange Composite Index (TSX) and the Dow Jones Industrial Average (DJIA) back in positive territory for 2026. It took a while, but the markets finally got there. 😊
The S&P pushed above 7,000 for the first time, closing at a record high, its first since late January. It has now posted gains in twelve of the past thirteen sessions, including record closes on each of the last three days, finishing above 7,100. The Nasdaq told a similar story, breaking above 24,000 for the first time and notching its first record close since October. It also extended its winning streak to thirteen straight sessions, its longest since 1992. That run marks a sharp turnaround after briefly slipping into correction territory just a few weeks ago amid concerns about the Middle East conflict. Not to be left behind, the DJIA ended the week at its highest point since February 26.
At the centre of it all was the war in Iran, which continued to drive market direction throughout the week. Early on, tensions escalated as the US moved to blockade Iranian shipping routes, raising concerns about disruptions in the Strait of Hormuz. That immediately pushed oil prices higher and sparked fears that inflation could reaccelerate, which would complicate the outlook for interest rates.
However, sentiment shifted fairly quickly. Comments from President Trump suggesting Iran was open to negotiations helped ease fears of further escalation, and that shift gained momentum later in the week when Iran announced the Strait of Hormuz would be reopened to commercial shipping. At the same time, the US suggested that peace talks could resume as early as this weekend, further improving the outlook. As tensions cooled, oil prices pulled back, which in turn helped calm inflation concerns and settle expectations around interest rates. Markets responded accordingly, moving higher as that pressure began to unwind.
At the same time, expectations around interest rates continued to improve. With inflation showing signs of cooling and no major surprises in the latest economic data, investors grew more confident that rate cuts could still be on the table later this year. That shift provided support across equities, particularly in growth-oriented sectors that tend to be more sensitive to interest rate changes.
Earnings season added another layer of support. Early results came in stronger than expected, reinforcing the idea that companies are still navigating the current environment relatively well. After a period of more cautious expectations, which helped boost confidence and gave markets another reason to move higher.
North of the border, the TSX followed a similar path, but with an even stronger connection to oil. The early spike in energy prices provided a lift to energy stocks and helped support the index, reflecting the TSX’s heavier exposure to commodities.
At the same time, higher oil prices briefly raised concerns about inflation and the potential for interest rates to stay elevated, which weighed on more interest-sensitive areas like financials. But as the week progressed and tensions eased, that pressure faded. Oil prices pulled back, inflation concerns cooled, and the broader market regained its footing.
In the end, the week followed a clear chain reaction: geopolitical tensions pushed oil higher, higher oil raised inflation concerns, and shifting expectations around both ultimately guided market direction. As those pressures eased, sentiment improved and markets responded.
That shift was enough to push all four major indexes back into positive territory for the year. It wasn’t a straight line to get there, but the recent momentum is a reminder of how quickly things can turn as uncertainty fades and optimism begins to return. Now, let’s see if the markets can carry that momentum into the weeks ahead. 😊
| Portfolio | Weekly Streak |
| Portfolio 1: | 3 – week winning streak |
| Portfolio 2: | 3 – week winning streak |
| Portfolio 3: | 3 – week winning streak |
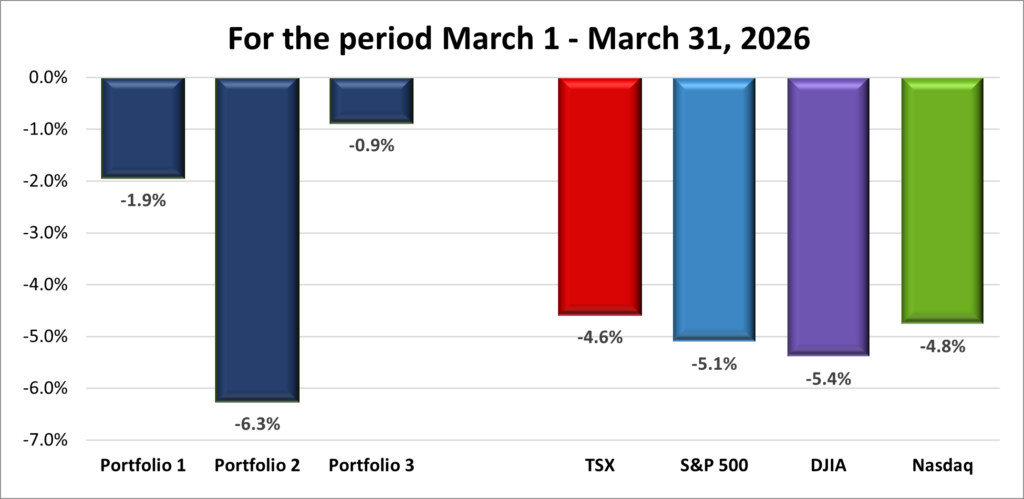
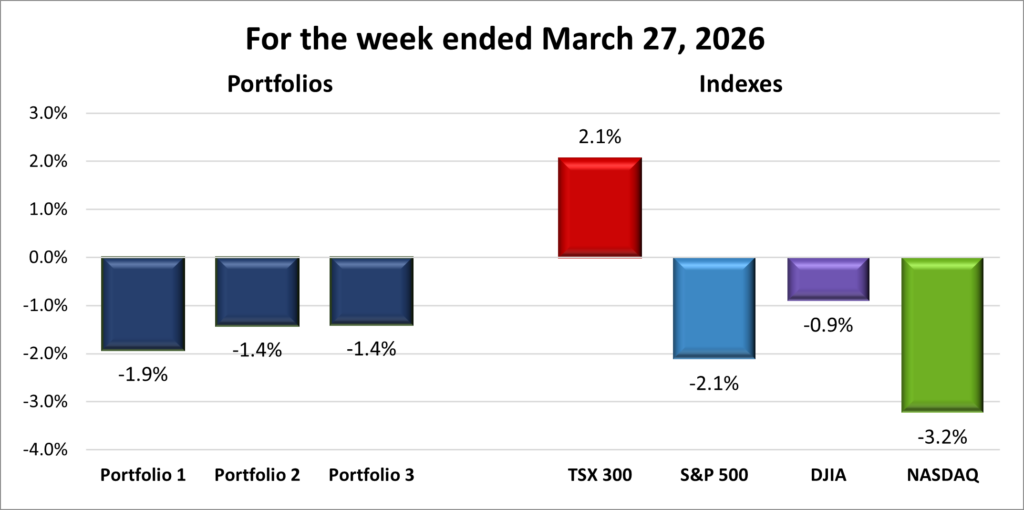
![]() After a tough March where all three portfolios steadily lost ground, it’s great to see a turnaround. Not only are all three portfolios now higher than they were at the start of the Iran conflict, but they’ve also moved back into positive territory for the year. 😊 As you’ll see, technology companies are once again doing much of the heavy lifting, both in the markets and within my portfolios.
After a tough March where all three portfolios steadily lost ground, it’s great to see a turnaround. Not only are all three portfolios now higher than they were at the start of the Iran conflict, but they’ve also moved back into positive territory for the year. 😊 As you’ll see, technology companies are once again doing much of the heavy lifting, both in the markets and within my portfolios.
Portfolio 1 had a very strong week, gaining 5.5%, which would normally be enough to lead, but not this time. Performance was broad-based, with 87% of holdings finishing higher. Several companies delivered standout gains, including Navitas Semiconductor (NASD: NVTS) up 31%, Datadog (NASD: DDOG) up 20%, Cloudflare (NYSE: NET) up 17%, Shopify up 17%, Constellation Software (TSE: CSU) up 15%, Grab Holdings (NASD: GRAB) up 15%, Magnite (NASD: MGNI) up 15%, Interactive Brokers (NASD: IBKR) up 15% after the SEC relaxed day trader cash requirements, Arista Networks (NYSE: ANET) up 12%, CrowdStrike (NASD: CRWD) up 11%, and Trade Desk (NASD: TTD) up 11%, all posting double-digit gains.
Despite the strong performance across the board, only Celestica (TSE: CLS) and Lattice Semiconductor (NASD: LSCC) reached new record highs, rising 12% and 10%, respectively.
Portfolio 2 was the laggard this week, but still posted a respectable gain of 4.2%, with 63% of holdings moving higher. The main headwind came from energy stocks, which pulled back after supporting the portfolio through March. On the positive side, MongoDB (NASD: MDB) led the way with a 16% gain, followed by Microsoft (NASD: MSFT) and Guardant Health (NASD: GH) at 13%, and Airbnb (NASD: ABNB) up 10%.
Portfolio 3 was the top performer, climbing an impressive 7.5% and outperforming the top index – the Nasdaq. Gains were once again widespread, with 80% of holdings finishing the week higher. Rocket Lab (NASD: RKLB) blasted higher with a 26% jump, followed by Lithium Americas (TSE: LAC) at 19%, Shopify and Cloudflare each gained 17%, while Magnite added 15% and Microsoft rose 13%. Royal Bank (TSE: RY) also contributed, closing the week at a record high.
It’s a strong reminder of how quickly growth stocks can rebound once sentiment improves. To paraphrase Marvin the Martian, “Yup… a good week, a very good week indeed.” 😊

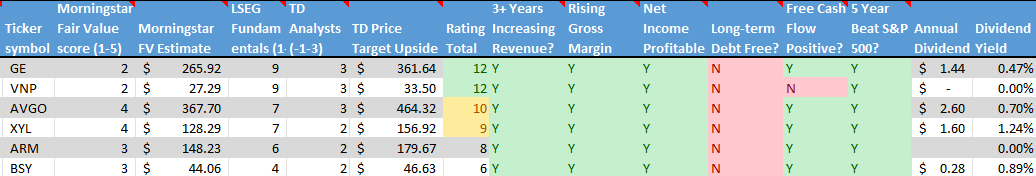
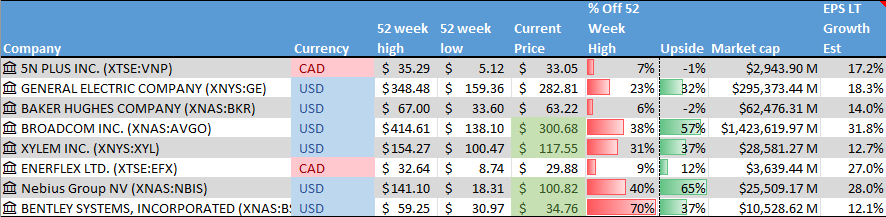
Companies on the Radar
 This week was a quieter one for my radar list, with no new companies making an appearance. Instead, I dropped one name and moved one of the two semiconductor companies to the backburner.
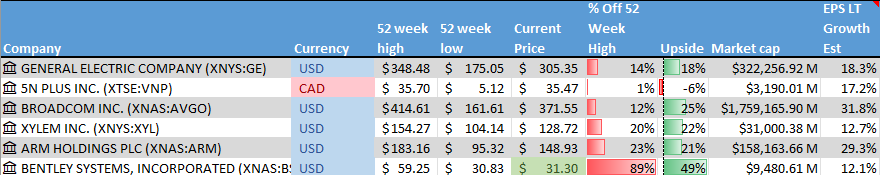
I decided to remove Bentley Systems (NASD: BSY), the American software company. The software industry is currently going through a period of disruption driven by the rise of AI, and Bentley is one of many companies feeling that pressure. While the long-term story is still intact, I feel there are better, lower-risk opportunities available right now.
Moving to the backburner was ARM Holdings (NASD: ARM). All three of my portfolios already lean toward technology to varying degrees, and becoming the owner of another technology company requires a bit more caution. Adding two volatile chipmakers would push that exposure even further, so I’m sticking with just one for now.
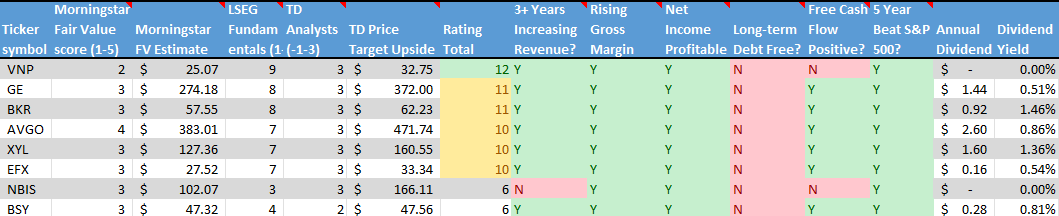
After running my Quick Test on ARM Holdings and comparing it with Broadcom (NASD: AVGO), the decision became clearer. ARM scored a strong 82%, but Broadcom edged it out at 86%, helped by more consistent earnings per share growth over the past five years.
Broadcom is a cash flow machine with a 15-year track record of dividend increases. Its wide moat comes from being deeply embedded in the infrastructure that powers the internet, which adds a layer of stability that’s hard to ignore. ARM, on the other hand, carries more risk due to its higher valuation, but it also offers more upside potential if it can establish itself as a dominant force in AI-driven data centres.
Valuation also played a role in the decision. At a high level, it’s simply about what you’re paying for a company compared to what it delivers, and as I explained earlier in the update, higher valuations tend to come with higher expectations and less margin for error. Broadcom is currently viewed as about 25% below its fair market value according to Morningstar, offering a solid margin of safety. ARM sits on the other side of that equation, trading roughly 15% above its estimated fair value. That doesn’t automatically rule it out, especially in the world of high-growth technology where premiums are common, but it reinforces the idea of being selective about when and where to take on that extra risk.
For me, Broadcom is the better fit if I decide to add another semiconductor position to one of the portfolios. Looking back, if I had held ARM from my initial investment a few years ago instead of selling after the sharp decline, I would likely feel very differently today. At this point, though, Broadcom simply aligns better with my approach.
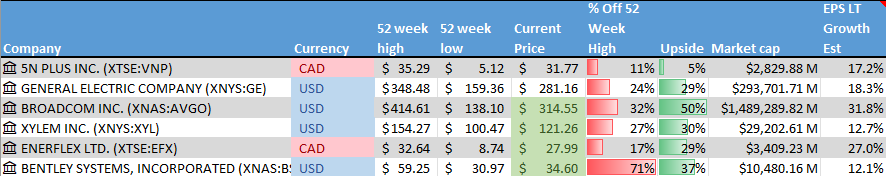
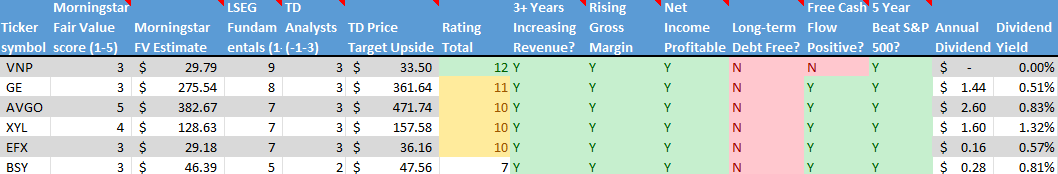
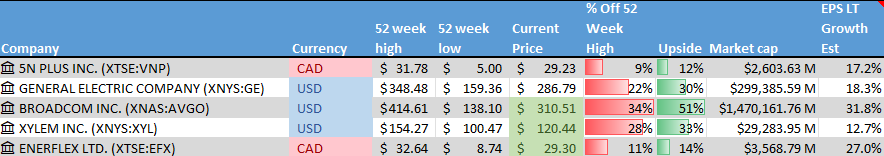
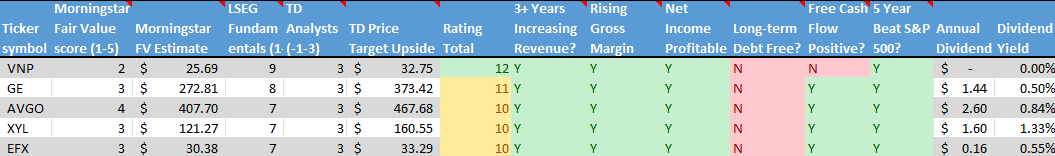
With that pruning, my radar list is now down to these four companies:
- 5N Plus Inc. (TSX: VNP): a small-cap Canadian company that produces high-purity specialty metals and semiconductor materials used in space solar power, renewable energy, medical imaging, and electronics. Many of its products are mission-critical, requiring consistent quality and long-term supply. With exposure to space programs, clean energy, and strategic materials, 5N Plus operates in several niche but expanding markets where technical expertise creates competitive advantages.
- GE Aerospace (NYSE: GE): This is the large American aviation and defence business that remained after General Electric split into three separate companies in 2024. It has been on a strong run thanks to high demand for commercial jet engines as global air travel continues to recover. The company focuses on aircraft propulsion systems and services for both commercial and military customers, and it’s also moving into drones. As a global leader in jet engines and aircraft systems, GE Aerospace offers exposure to long-term trends in travel, defence spending, and emerging aviation technology.
- Broadcom: A large cap American company that sells semiconductors and software globally. It designs critical chips used in data centres, networking equipment, and broadband infrastructure, playing a behind-the-scenes role in cloud computing and AI. Broadcom also owns a growing enterprise software business following its acquisition of VMware, giving it exposure to both hardware and software spending tied to AI and cloud growth.
- Xylem Inc. (NYSE: XYL): This is a large American company that develops water technology focused on moving, treating, and managing water. Its products and services are used by utilities, industrial customers, and municipalities for everything from clean drinking water and wastewater treatment to flood control and leak detection. With aging water infrastructure and more frequent climate challenges like droughts and flooding, demand for Xylem’s solutions is still strong. The business offers exposure to long-term, essential infrastructure spending tied to water scarcity, sustainability, and smarter cities.
As always, these are not buy recommendations. Make sure to do your own research and choose investments that fit your personal financial goals.
The Radar Check was last updated April 17, 2026.


Portfolio Update
Portfolio 2
Sold: Bank of Nova Scotia (TSE: BNS) I recently sold a portion of my holdings in Bank of Nova Scotia. Nothing really changed with the business itself, but my position had grown to the point where it made up about 37% of Portfolio 2’s total value.
At that size, it started to feel a bit too concentrated for my comfort. Having that much tied to a single company can quietly increase risk, as it only takes one unexpected development to have an outsized impact on overall performance. Trimming the position brings things back toward a more comfortable level and helps reduce that concentration risk.
The cash from the sale will be redeployed into other holdings over time, helping spread risk across more companies and keeping the portfolios better balanced and more resilient.
Bought: Aritzia: (TSE: ATZ) After trimming my position in Bank of Nova Scotia to reduce its overall weight in the portfolio, I redeployed a portion of that capital by adding to my existing position in Aritzia.
This move was part of a broader effort to create a more balanced portfolio. With my holdings leaning heavily toward financials and energy, adding to Aritzia increases exposure to the consumer sector, which tends to be more growth-oriented. It’s not just about reducing one position, but about improving the overall mix.
I first invested in Aritzia in November 2025, and the position has since grown by about 50% (not bad for six months 😊). The company is still in a growth phase, supported by its continued expansion in the US and strong brand positioning. That gives it a different return profile compared to more mature holdings and adds another layer of potential to the portfolio.
Valuation also played a role in the decision. Both the trailing P/E (based on past earnings) and the forward P/E (based on expected future earnings) are lower than when I first bought the stock. That suggests I’m now paying a more reasonable price for the business, even as it continues to grow.
For me, this wasn’t about replacing one company with another, but about rebalancing across sectors while adding a bit more growth to the portfolio. In simple terms, I liked the business before – now I’m getting it at a better price. 😊
Portfolio 3
Sold: Nvidia (NASD: NVDA) I trimmed my position in NVIDIA this week, something I’ve been planning to do for a while. It had grown into the largest holding in this portfolio, making up over 36% of its value, and at that size, it felt like the entire portfolio was moving with the stock.
As the share price climbed toward US$200, I decided that would be my level to take some profits. There wasn’t anything overly precise about that number, it was simply a price I felt comfortable selling at after the strong run the stock has had. While it took a bit longer than expected to reach that level, I was able to generate some additional income along the way by selling covered calls, which helped make the wait more productive.
Reducing the weighting also helps improve diversification, which is an important part of managing risk over time. When one position grows too large, the portfolio can become overly dependent on how that single company performs. Even a strong business can go through periods of volatility, and at that size, those swings can have a much bigger impact on overall results.
By trimming the position, it creates more room to spread capital across other holdings and sectors, leading to a more balanced portfolio where performance is driven by a mix of companies rather than a single name. In the long run, diversification isn’t about lowering returns, but about making those returns more consistent and reducing the risk that any one position has too much influence.
With the cash from the sale, I plan to put it back to work by building up other positions or adding new companies.
That’s a wrap for this week, thanks for reading – may your portfolio stay green and your dividends steady. See you next time!