
Oil Surges, Volatility Returns
In February, artificial intelligence (AI) optimism and anxiety were the main winds that buffeted the markets (and buffet they did 😊). But as the month closed, a very different storm rolled in. Geopolitical tensions in the Middle East escalated sharply, shifting investor focus from AI concerns and earnings reports to energy supply and global stability.
Late in the month, the United States and Israel launched coordinated air strikes against Iranian military and nuclear-related targets following rising tensions over Tehran’s regional activity and nuclear programme. President Trump’s decision to strike Iran creates new risks for a significant chunk of the world’s oil supply. Iran alone pumps about 3% of global crude – making it the fourth-largest producer among OPEC nations – but wields far greater influence because of its strategic location near the Strait of Hormuz, a critical shipping route for global oil exports.
Iran retaliated with missile and drone attacks and has since moved to close the Strait of Hormuz. While many of the Iranian attacks were intercepted, some still made it through defence systems, striking both land and seaborne targets. The US responded by saying its navy would escort vessels through the Persian Gulf and the Strait, raising the stakes further.
What it means for oil prices
Whenever conflict flares in this region, oil markets react quickly. The Strait of Hormuz is one of the world’s most important energy chokepoints, with roughly 20% of global seaborne crude oil passing through it. Any threat to that flow can push prices higher.
Brent crude – the international benchmark price for oil that much of the world uses as a reference – jumped sharply, climbing back above the $90-per-barrel level, a 27% increase this week alone. The last time oil prices were that high was late September 2023.
When oil prices rise, it becomes more expensive to transport goods, manufacture products, and heat homes. That can squeeze businesses and leave consumers with less money to spend elsewhere, which is why sustained oil spikes often make investors uneasy.
Gold and safe havens
Gold – the classic safe-haven asset – also rallied as investors sought safety. During periods of geopolitical stress, money often rotates out of stocks and into assets viewed as more stable, such as gold and government bonds. Even if broader economic fundamentals like inflation or growth haven’t changed overnight, uncertainty alone can drive that defensive shift.
Impact on Canadian & global markets
Equity markets initially fell as investors dialed back risk, with the major indexes dipping as investors rotate out of risk assets and into defensive ones like gold or bonds. Energy stocks, however, tended to outperform as higher crude prices can translate into stronger revenue for producers and integrated energy companies.
For Canada, the picture is mixed. The Toronto Stock Exchange Composite Index (TSX) has significant exposure to oil and gas producers, so rising crude prices can provide a tailwind. At the same time, other sectors could feel headwinds if higher energy costs weigh on consumer spending or corporate profits. Bonds and other defensive assets have also attracted inflows as traders sought shelter from the volatility experienced in other sectors.
The bigger picture for investors
Right now, investors are weighing two forces: the benefit of higher oil prices for energy producers (it seems all of the energy companies spread across my three portfolios are up since hostilities began) versus the broader economic risk of prolonged disruption. If naval escorts keep shipments moving and tensions stabilize, volatility could ease. But if the standoff escalates further, oil could climb again, inflation concerns could resurface, and central banks like the Bank of Canada and the US Federal Reserve could face renewed pressure on interest rates – all of which would influence stocks, bonds, and currencies in the weeks ahead.
February began with AI-driven winds pushing markets around. Now they’re being buffeted by geopolitical crosscurrents. For the moment, markets are reacting to headlines and probabilities rather than confirmed long-term disruption. Whether these hostilities are short term or become more sustained will matter not just for oil, but for inflation, interest rates, and overall market sentiment. With that backdrop in mind, let’s take a look at how the markets performed this week – and the impact on my portfolios.
Items that may only interest or educate me ….
Canadian Economic news, US Economic news, ….
Canadian Economic news
This past week’s key economic data that the Bank of Canada (BoC) considers when deciding whether to raise or lower the interest rate.
Canadian Market Volatility
Canada’s “fear gauge,” the VIXC (tracked as VIXI.TS on many platforms), opened Monday amid heightened Middle East tensions after US air strikes on Iranian military targets, pushing the index to 15.95. Following Iranian retaliation, the VIXC briefly spiked above 20 before easing back under the heightened-anxiety mark. It drifted lower to around 17 midweek, then climbed again as higher oil prices and inflation concerns crept in, finishing the week at 20.37.
Readings in the mid- to high-teens usually signal caution rather than outright panic, while levels above 20 suggest investors are becoming more uneasy about market risks. Even so, Canadian volatility typically runs lower than in the US because the TSX is heavily weighted toward banks, energy, and materials — sectors that tend to experience steadier price movements than the high-growth technology stocks that dominate US indexes.
US Economic news
This past week’s key data points that the Federal Reserve (Fed) considers when deciding whether to raise or lower the interest rate.
Labour data
Once again, the Bureau of Labor Statistics’ (BLS) Job Openings and Labor Turnover Survey (JOLTS) won’t arrive on its usual first-Tuesday schedule. That means this week we’ll only get two major labour reports: the ADP National Employment Report and the federal government’s Employment Situation Summary (ESS).
The ADP report offers an early read on private-sector hiring, while the ESS delivers the broader picture – total job creation, the unemployment rate, and wage growth. Together, they help investors gauge the health of the labour market, which is still one of the most important drivers of interest rate expectations and overall market sentiment.
ADP Employment Report
ADP’s latest report showed 63,000 private-sector jobs added in February, up from a revised 11,000 in January. That beat expectations of around 50,000 and marked the strongest monthly gain since July 2025.
After a slow start to the year, this points to a modest pickup in hiring. The ADP report is often viewed as a preview of Friday’s official data from the BLS. While it doesn’t always line up perfectly with government figures, it helps set expectations heading into the more closely watched ESS release.
The gains were concentrated in education, health services, and construction rather than spread broadly across the economy. This suggests the labour market remains resilient, though growth is uneven rather than firing on all cylinders.
The Bureau of Labor Statistics’ Employment Situation Summary (ESS).
The BLS’s February ESS delivered a surprise. The economy shed 92,000 jobs during the month, a sharp contrast to January’s revised gain of 126,000. Economists had expected roughly 59,000 new jobs, so the negative headline caught markets off guard.
The unemployment rate edged up slightly to 4.4% from 4.3% in January. While that increase was a touch higher than expected, unemployment is still historically low, indicating the labour market is cooling but not collapsing.
Wages continued to trend upward, with average hourly earnings rising 0.4% in February, matching January. On a year-over-year basis, wages are now growing at a 3.8% pace, slightly faster than January’s 3.7%.
For investors, the report is a double-edged sword. Slower job growth could signal the economy is starting to cool, which isn’t great for growth. At the same time, a softer labour market could give the Fed more room to eventually lower interest rates if economic conditions weaken
Labour Market Summary
Taken together, this week’s reports paint a somewhat mixed picture of the labour market. The ADP report showed private-sector hiring continued in February, while the government’s employment report showed an overall decline in jobs. Differences between the two surveys are not unusual, but the conflicting signals highlight growing uncertainty about the strength of the labour market.
Overall, the data suggests conditions may be starting to cool. Job creation is slowing, hiring appears concentrated in fewer industries, and the unemployment rate has edged slightly higher. At the same time, steady wage growth and still-low unemployment indicate the labour market retains underlying strength.
For investors, that leaves the outlook somewhat balanced. A cooling labour market could eventually support interest rate cuts if economic growth weakens further, but continued wage growth also means inflation pressures haven’t fully disappeared. In other words, the job market may be shifting from red-hot toward something closer to normal.
For now, the data adds to the uncertain mix investors are already dealing with — rising oil prices, geopolitical tensions, AI concerns, and lingering questions about inflation.
Retail Sales
US retail sales slipped 0.2% month-over-month in January, slightly better than the expected 0.3% decline, after being flat in December. The drop continues the cooling trend following November’s stronger 0.6% gain. While a decline isn’t ideal, the fact it wasn’t as weak as economists expected softened the market reaction. Severe winter storms across parts of the US likely played a role as well, disrupting shopping activity and reducing foot traffic in some retail categories.
On a year-over-year basis, retail sales were still up 3.2%, an improvement from the 2.4% pace seen a year earlier. In other words, consumers are still spending more than they were last year – just not as quickly as they were a few months ago.
Looking closer, the results were mixed. Miscellaneous store retailers posted the largest monthly gain, with sales rising 2.0%, while health and personal care stores saw the biggest drop, falling 2.0%. On an annual basis, non-store retailers – mostly online shopping – stood out, with sales jumping 10.9%. Gasoline stations moved the other direction, with sales down 3.7%, largely reflecting lower fuel prices compared with last year.
Core retail sales, which strip out autos, auto parts, and gasoline provide a clearer picture of underlying consumer demand. In January, they slipped 0.3% after being flat in December, but on an annual basis growth actually improved slightly, rising from 4.4% to 4.7%.
Retail sales matter because consumer spending drives roughly two-thirds of the American economy. In short, the report suggests the American consumer is still spending, but the pace is cooling a bit – not strong enough to signal a booming economy, but not weak enough to point to a major slowdown either.
American Market Volatility
The CBOE Volatility Index (VIX), often called the market’s “fear gauge,” opened the week at 24.66 – its highest level in three months – following US and Israeli air strikes on Iran. It stayed above 20 for the rest of the week, climbing as high as 28.15 on concerns that the conflict could keep oil prices elevated and push interest rates higher. Even so, the VIX remained well below the extreme levels seen after President Trump’s ‘Liberation Day’ trade disruptions. After the weaker-than-expected labour data at the end of the week, the index jumped to 29.93 before settling at 29.49 to close the week.
Think of the VIX as the market’s pulse. Readings above 20 signal elevated caution, and this week investors grew increasingly nervous as geopolitical and economic uncertainties kept volatility elevated.
Weekly Market and Portfolio Review
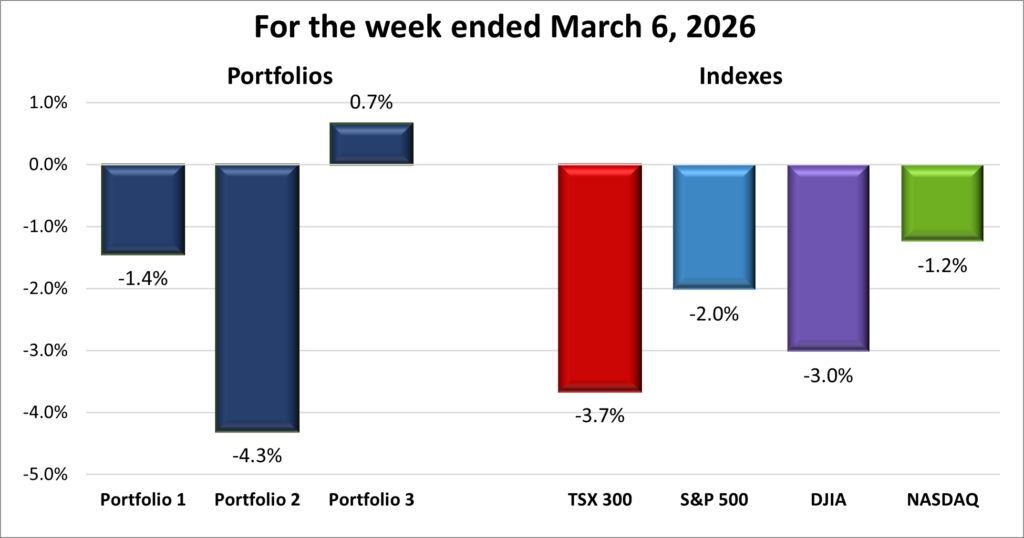
For the week, the TSX (SPTSX) fell 3.7%, the S&P 500 (SPX) dropped 2.0%, the DJIA (INDU) declined 3.0% and the Nasdaq (CCMP) slipped 1.2%.
| Index | Weekly Streak |
| TSX: | 1 – week losing streak |
| S&P: | 2 – week losing streak |
| DJIA: | 2 – week losing streak |
| Nasdaq: | 2 – week losing streak |
![]() The week opened with optimism but quickly gave way to uncertainty. The TSX hit a record at the start of the week before retreating alongside its American peers – the S&P 500 Index (S&P), the Dow Jones Industrial Average (DJIA), and the Nasdaq Composite Index (Nasdaq). Even the Nasdaq’s brief midweek rebound couldn’t hold, leaving all the major indexes in negative territory for the week, with the three American indexes now in the red for the year. The pullback snapped a four-week weekly winning streak for the TSX. In the US, the DJIA suffered its worst weekly loss since early April 2025, when President Trump disrupted the global trading order, while the S&P posted its steepest weekly drop since mid-October 2025.
The week opened with optimism but quickly gave way to uncertainty. The TSX hit a record at the start of the week before retreating alongside its American peers – the S&P 500 Index (S&P), the Dow Jones Industrial Average (DJIA), and the Nasdaq Composite Index (Nasdaq). Even the Nasdaq’s brief midweek rebound couldn’t hold, leaving all the major indexes in negative territory for the week, with the three American indexes now in the red for the year. The pullback snapped a four-week weekly winning streak for the TSX. In the US, the DJIA suffered its worst weekly loss since early April 2025, when President Trump disrupted the global trading order, while the S&P posted its steepest weekly drop since mid-October 2025.
For the first time in a while, AI wasn’t the main driver of market moves. Geopolitical tensions took centre stage as hostilities between the US and Israel on one side and Iran on the other rattled investors. If the conflict persists, elevated oil prices could reignite inflation pressures, and higher inflation often means higher interest rates – something markets rarely celebrate. ☹
Technology stocks faced additional pressure as investors reassessed the pace and profitability of massive AI spending. Semiconductor and software companies pulled back as traders questioned whether all the investment in AI infrastructure would translate into sustained earnings growth. Because these companies carry heavy weight in the S&P and dominate the Nasdaq, their declines had an outsized effect on the broader indexes.
Later in the week, markets moved lower as investors digested fresh US economic data. The latest labour report showed the economy unexpectedly lost jobs in February, while retail sales also pointed to cooling consumer spending. Together, the reports suggested the economy may be losing momentum after a stronger finish to last year. The weaker data added to concerns that growth may be slowing just as geopolitical tensions and higher oil prices threaten to keep inflation elevated, weighing on the major indexes. The S&P also closed below its 100-day moving average for the first time since November 20, 2025, a technical signal some traders see as a sign that market momentum may be weakening.
In Canada, markets were largely shaped by the same global forces. The energy sector benefited from higher crude prices amid the Middle East conflict, helping to offset losses across the broader index. Traders remained cautious about the potential for lingering inflation if oil prices stay elevated.
Gold and precious metals also saw intermittent strength as investors sought safety. Rising geopolitical risk often boosts demand for gold as a hedge when equities look shaky. Prices jumped to over US$5,400 early in the week, fell back to around $5,005, and rebounded to end near $5,180. That helped offset some weakness elsewhere, even though broader precious metals stocks struggled, posting some of the largest daily drops on multiple sessions.
Despite the strong gains in energy, losses across the other nine sectors offset those gains, leaving the TSX firmly in negative territory for the week as geopolitical tensions and inflation concerns weighed on the broader market. Investors on both sides of the border will now be watching geopolitical headlines, oil prices, and upcoming economic data closely.
| Portfolio | Weekly Streak |
| Portfolio 1: | 2 – week losing streak |
| Portfolio 2: | 2 – week losing streak |
| Portfolio 3: | 1 – week winning streak |
![]()
![]() Given that rising oil prices were the dominant market driver this week, I expected Portfolio 2 to have a strong showing because of its heavier weighting in energy companies. I was also hoping that with little major news on the AI front, the other two portfolios might finally slip into the win column as well. At least, that was the theory. Boy, was I wrong. ☹
Given that rising oil prices were the dominant market driver this week, I expected Portfolio 2 to have a strong showing because of its heavier weighting in energy companies. I was also hoping that with little major news on the AI front, the other two portfolios might finally slip into the win column as well. At least, that was the theory. Boy, was I wrong. ☹
Portfolio 1, home to the most Magnificent 7 companies, fell 1.4% as continued concerns about AI spending and disruption weighed on the broader technology sector. In recent weeks, rising gold prices helped carry the portfolio, but that support faded this week as the iShares S&P/TSX Global Gold Index ETF (TSE: XGD) dropped 12%. Another major drag was Celsius Holdings (NASD: CELH), which fell 17%. Overall, only 42% of the portfolio’s holdings posted gains. The bright spots included The Trade Desk (NASD: TTD) up 26%, CrowdStrike (NASD: CRWD), up 19%, Constellation Software (TSE: CSU) up 18%, Datadog (NASD: DDOG) and Cloudflare (NYSE: NET) both up 14%, and Shopify (TSE: SHOP) up 12%.
Portfolio 2, which holds the largest number of energy companies, delivered the biggest surprise – and not in a good way. Despite the surge in oil prices, the portfolio posted the worst performance of the three, dropping 4.2%. I had expected it to lead the group this week. Part of the problem was that only 28% of the holdings posted gains, including South Bow (TSE: SOBO) which set a record high. TC Energy (TSE: TRP) set a record high before giving back those gains later in the week. Adding to the pressure was a 16% drop in MongoDB (NASD: MDB).
Portfolio 3 provided the week’s only positive surprise. The portfolio gained 0.7%, even though all the major indexes finished lower and it holds the largest percentage of technology companies. Going into the week, I expected it a decline similar to Portfolio 1. Instead, half of its holdings posted gains, including a 14% rise in Cloudflare and a 12% increase from Shopify, the portfolio’s second-largest holding.
It wasn’t the outcome I expected, but that’s the reality of investing. Markets rarely move exactly the way we think they will, especially in the short term. For now, my focus remains on the long term and watching how these companies perform over time. With geopolitical tensions, oil prices, and economic data all in flux, it should be interesting to see what the market has in store next week.
Companies on the Radar
 I made a few adjustments to my radar list this week. Corning (NYSE: GLW), the fibre optic and specialty glass manufacturer, moved off the list – though it’s still just outside my immediate focus. I still like the business, but I prefer the other candidates right now, and I want to keep the radar limited to only the strongest contenders for a portfolio spot. A tight list helps me stay disciplined instead of chasing too many ideas.
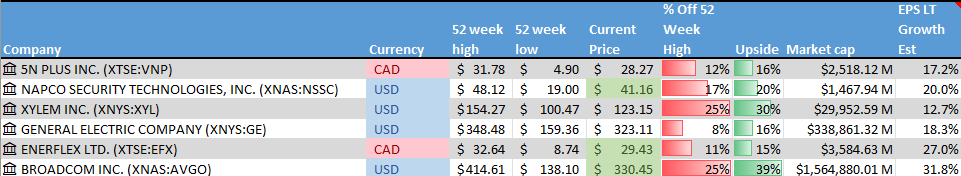
New to the radar is Enerflex Ltd. (TSE: EFX), a Canadian small-cap industrial company (market value under C$4 billion) that builds and services energy infrastructure for global natural gas and power markets. In simple terms, they design, manufacture, install, and maintain the equipment that helps process and move natural gas. It’s behind-the-scenes infrastructure work – not flashy, but essential.
What stands out is the positioning. While Enerflex’s core business is still tied to natural gas – a major global energy source – the company has been expanding into lower-carbon and energy transition projects, including electrification and renewable-related solutions. That combination offers exposure to current energy demand while also participating in longer-term industry shifts.
On the surface, it looks like a steady, necessary business with potential upside tied to transition trends. Now it’s time to dig deeper and get a closer look at this opportunity.
After these changes, my radar list stays at six, including the five below:
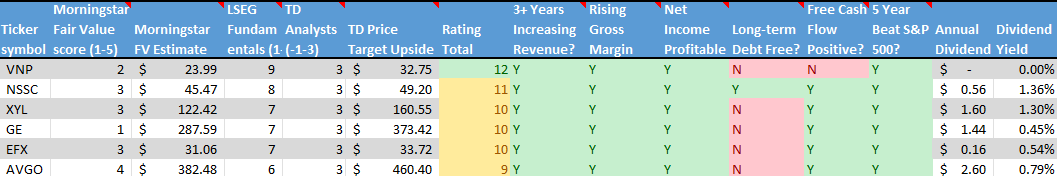
- 5N Plus Inc. (TSX: VNP): a small-cap Canadian company that produces high-purity specialty metals and semiconductor materials used in space solar power, renewable energy, medical imaging, and electronics. Many of its products are mission-critical, requiring consistent quality and long-term supply. With exposure to space programs, clean energy, and strategic materials, 5N Plus operates in several niche but expanding markets where technical expertise creates competitive advantages.
- Napco Security Technologies, Inc. (NASD: NSSC): A small US company that provides security hardware and systems like smart locks, intrusion alarms, fire alarms, and access control solutions. It sells through a network of distributors and installers, and has been increasing its recurring service revenue – something investors usually like to see. As demand for security and smart home products grows, Napco has multiple avenues for expansion.
- Xylem Inc. (NYSE: XYL): This is a large American company that develops water technology focused on moving, treating, and managing water. Its products and services are used by utilities, industrial customers, and municipalities for everything from clean drinking water and wastewater treatment to flood control and leak detection. With aging water infrastructure and more frequent climate challenges like droughts and flooding, demand for Xylem’s solutions is still strong. The business offers exposure to long-term, essential infrastructure spending tied to water scarcity, sustainability, and smarter cities.
- GE Aerospace (NYSE: GE): This is the large American aviation and defence business that remained after General Electric split into three separate companies in 2024. It has been on a strong run thanks to high demand for commercial jet engines as global air travel continues to recover. The company focuses on aircraft propulsion systems and services for both commercial and military customers, and it’s also moving into drones. As a global leader in jet engines and aircraft systems, GE Aerospace offers exposure to long-term trends in travel, defence spending, and emerging aviation technology.
- Broadcom (NASD: AVGO): A large cap American company that sells semiconductors and software globally. It designs critical chips used in data centres, networking equipment, and broadband infrastructure, playing a behind-the-scenes role in cloud computing and AI. Broadcom also owns a growing enterprise software business following its acquisition of VMware, giving it exposure to both hardware and software spending tied to AI and cloud growth.
As always, these are not buy recommendations. Make sure to do your own research and choose investments that fit your personal financial goals.
The Radar Check was last updated March 6, 2026.
That’s a wrap for this week, thanks for reading – may your portfolio stay green and your dividends steady. See you next time!