
Weekly Update for the week ending May 2, 2025

Risky Business

One phrase I keep running into early on my investing journey is “risk on, risk off.” At first, I thought it just meant investors were either piling into riskier assets (like technology stocks) or playing it safe with something more stable (like utility stocks). And while that’s partly true, there’s a bit more nuance behind it.

At its core, “risk on, risk off” is about investor mood – or more technically, risk tolerance. It’s a strategy that reflects how confident (or nervous) people feel about the market at any given moment.

  • Risk-on means optimism is in the air. Investors are more comfortable taking on risk for higher potential returns, so money flows into stocks, high-yield bonds, cryptocurrencies, and other growth-focused assets. In my case, this would be investing in high growth stocks such as technology companies.
  • Risk-off kicks in when fear or uncertainty takes over – maybe because of weak economic data, rising inflation, or geopolitical tensions. In those moments, investors move into safer territory like US Treasuries, gold, cash, or defensive sectors. For me, this would be stocks in the utility or consumer staple sectors.

These shifts can happen fast. Markets might flip between risk-on and risk-off within a single trading session depending on headlines or economic releases. Big catalysts include central bank decisions, inflation numbers, job reports, global events, and more recently, social media posts from President Trump.

A perfect recent example of this dynamic? President Trump. His actions have been major drivers of both market rallies and sell-offs due to his unpredictable policy shifts and fiery rhetoric.

During his second term, Trump’s aggressive tariff rollouts triggered serious volatility. Sweeping duties on imports from China, Mexico, and Canada rattled global markets, prompting a sharp move into risk-off territory. Stocks fell, and investors piled into safer, more stable assets like bonds and gold.

But when he signaled a pause or softened his tone, sentiment often reversed. Stocks bounced back, risk appetite returned, and investors poured back into growth stocks.

Trump’s presidency has been a masterclass in how fragile market sentiment can be – with sudden policy reversals keeping everyone on edge. It’s a real-world example of just how quickly markets can swing depending on the tone from the top.

So, when you hear someone say “risk-on” or “risk-off,” think of it as the market’s mood ring: green means go, red means retreat. 😊

This week, that market mood ring kept flashing green and red as investors tried to make sense of the latest inflation data, earnings results, and the ongoing fallout from Trump’s tariff moves. With sentiment swinging almost daily, it was a classic example of how quickly we can shift between fear and optimism. Let’s take a look at what moved the markets this week, how the major indexes performed, and what it all means for us investors. 👇


Items that may only interest or educate me ….

Canadian Economic news, American Economic news, First 100 days, ….

Canadian Economic news

This past week’s key economic data that the Bank of Canada (BoC) considers when deciding whether to raise or lower the interest rate.

Bank of Canada meeting minutes

The Bank of Canada’s minutes from its April 16 meeting showed policymakers opted to hold the benchmark interest rate steady at 2.75%, pausing after seven straight cuts since June 2024. The decision reflected growing uncertainty, especially around US trade policy and the sweeping tariffs introduced earlier in the month.

Council members noted mixed economic signals: consumer sentiment and business confidence had softened, but the labour market remained relatively stable. Worries about a potential US recession and broader global slowdown weighed heavily on the discussion.

The Governing Council considered two scenarios – one where the tariffs are temporary, and another where they linger and potentially drive inflation above 3% by 2026. While some members pushed for another rate cut to support a slowing economy, others favoured caution, pointing to the inflation risks tied to higher import costs.

In the end, the Bank chose to hold the rate at the current level and wait for more clarity, stressing the need to balance support for growth with maintaining price stability. The minutes reiterated that the Bank remains ready to act if signs of stronger disinflation or a sharper downturn emerge.

Gross Domestic Product (GDP)

Canada’s economy contracted by 0.2% in February 2025, following a 0.4% gain in January, as severe winter storms weighed on economic activity. The drop was led by a 0.6% decline in goods-producing industries, with ‘Mining, quarrying, and oil and gas extraction’ plunging 2.5%. Service-producing industries also slipped 0.1%, dragged down by a sharp 4.2% decline in the ‘Management of companies and enterprises’ category.

Still, there were a few bright spots. The ‘Manufacturing’ sector posted a 0.6% gain – its fourth straight monthly increase – thanks to strength in durable goods like machinery. ‘Finance and insurance’ also grew 0.7%, offering a bit of a cushion amid broader weakness.

On a year-over-year basis, GDP was up 1.6%, slowing from 2.4% in January but still showing some resilience. Notably, the ‘Utilities’ sector remained up 8.5% from a year earlier. The overall February dip was largely blamed on extreme weather, which disrupted transportation services across Central and Eastern Canada as well as parts of B.C.

Looking ahead, Statistics Canada’s advance estimate for March points to a modest 0.1% uptick, bringing estimated first quarter growth to 0.4%.

Canadian market volatility

Canada’s market stress meter – the S&P/TSX 60 VIX (VIXC) – started the week on edge at 22.68 before easing down to 18.35 by market close on Friday. That’s just inside the range of “business as usual,” suggesting that investor anxiety is easing, at least temporarily. A declining volatility index typically signals greater market confidence, meaning traders may be adjusting to the recent turbulence rather than reacting with panic.

For anyone just getting familiar, the VIXC is Canada’s version of a fear gauge. Readings below 10 reflect strong investor confidence, 10–20 signals normal volatility, and anything above 20 points to growing uncertainty.

US Economic news

This past week’s key data points that the Federal Reserve (Fed) considers when deciding whether to raise or lower the interest rate.

Consumer Confidence Index (CCI)

Consumer confidence took another hit in April, with the Conference Board’s Consumer Confidence Index falling to 86.0 – its lowest level since May 2020 – down from 92.9 in March. That marks five straight months of decline and came in below expectations of 87.9.

The Present Situation Index, which reflects how Americans view current business and job conditions, dipped slightly to 133.5 from 134.4. But the real red flag was the Expectations Index, which plunged 12.5 points to 54.4 – well below the 80 mark that often signals a recession, and the lowest reading since October 2011.

This sharp drop in expectations likely reflects growing concerns about rising prices due to tariffs, a cooling labour market, and broader fears of an economic slowdown. When future confidence falls this low, consumer spending often follows – putting more pressure on retail and the wider economy. Combine that with the market volatility earlier this month, and it’s no surprise that confidence continues to slide.

Gross Domestic Product (GDP)

According to the Department of Commerce’s Bureau of Economic Analysis (BEA), the US economy contracted by 0.3% in the first quarter of 2025, marking the first decline since early 2022 and falling well short of expectations for 0.4% growth. It’s a sharp reversal from the 2.4% expansion seen in the previous quarter and adds to growing concerns about the economy’s trajectory.

The biggest drag came from a 41% surge in imports, as businesses rushed to stockpile goods ahead of new tariffs. Since imports are subtracted from GDP, the spike delivered a heavy blow – shaving about 5% off growth. Government spending also declined, likely reflecting mass layoffs of federal employees, compounding the slowdown.

There were still a few bright spots: consumer spending rose 1.8%, and private investment remained stable – though both cooled noticeably from the fourth quarter of 2024, when consumer spending grew by 4%.

With tariffs rising, inflation lingering, and policy uncertainty in the mix, recession worries are back in focus. While President Trump has tried to shift blame for the weak performance onto his predecessor, the economy was under his leadership for most of the quarter. It was his administration that imposed the sweeping new tariffs – raising rates on nearly all major US trading partners. That move typically leads to higher prices, especially for imported products and materials. If these early returns are any indication, the new policies aren’t exactly confidence inspiring.

Personal Consumption Expenditures (PCE)

The latest PCE inflation data from the BEA came in with a bit of a twist. Headline prices rose 0.7% in March – hotter than expected – after a 0.4% gain in February. Analysts had been bracing for a flat reading, so the increase definitely turned a few heads. On a year-over-year basis, inflation eased to 2.3% from 2.7%, still a touch above the 2.2% forecast.

Core PCE, which excludes food and energy, the Fed’s preferred measure of inflation, was flat in March after rising 0.4% the month prior. That helped bring the year-over-year rate down to 2.6% from 3.0% – a welcome sign that underlying inflation pressures are starting to cool.

Overall, the data shows the US economy is holding up where it counts: consumer spending. People are earning more and were still spending, which is good news for businesses and growth. Better yet, prices aren’t rising as quickly, offering a rare combination that should keep both consumers and the Fed happy. 😊

The only catch? This data came in before the chaos unleashed by President Trump’s global trade war. The April inflation reports – both the PCE and Consumer Price Index – will offer the first real look at how tariffs ripple through the economy and whether inflation is about to heat back up.

Labour data

The latest updates from the Job Openings and Labor Turnover Survey (JOLTS), the ADP Employment Report, and the Employment Situation Summary (ESS) offer a snapshot of the US labour market – showing continued resilience, but also some signs of stress on the horizon.

JOLTS

The latest JOLTS report from the US Bureau of Labor Statistics showed job openings slipped to 7.19 million in March, down from a revised 7.48 million in February – and just below expectations. The ratio of job openings to unemployed workers dipped to 1.02, signalling that the labour market continued to cool heading into April’s tariff tensions.

This ongoing drop in job openings – well off the peak of 12 million in March 2022 – points to a broader hiring slowdown. It likely reflects growing caution from businesses amid rising economic uncertainty and the looming threat of new import tariffs. Still, while the labour market is softening, demand hasn’t fallen off a cliff – it’s holding steady, at least for now.

(Quick reminder: JOLTS tracks job openings as of the last business day of the month—in this case, March.)

ADP

The April ADP Employment Report showed US private sector job growth slowing to just 62,000 – the smallest monthly gain since July 2024 and well below the 120,000 jobs economists had expected. It’s also a sharp drop from March’s 155,000 new jobs, adding to signs that the labour market is losing steam.

Annual pay growth for job-stayers came in at 4.5%, a slight dip from last month, pointing to a broader trend of slowing wage momentum. The weaker job gains and easing pay growth suggest businesses are becoming more cautious, likely in response to growing economic uncertainty.

ESS

The US labour market added 177,000 jobs in April, beating expectations of a 120,000 gain – but still down from March’s 228,000 increase. While that’s a solid showing, it hints at a gradual cooling in job creation.

The unemployment rate held steady at 4.2%, keeping it within the narrow range of 4.0% to 4.2% where it’s been since last May. Wage growth also showed signs of moderation. Average hourly earnings rose 0.2% in April, following a 0.3% increase in March. Over the past year, wages are up 3.8% – still respectable, but slower than earlier in the cycle.

Overall, the labour market is holding up well, but there are cracks starting to show. Slower wage growth and the dip in job gains suggest businesses are becoming more cautious – likely due to the uncertainty sparked by the latest round of US tariffs. With higher costs and disrupted supply chains, many companies are taking a wait-and-see approach before expanding headcount.

Overall labour market summary

The latest data from JOLTS, ADP, and the Employment Situation Summary points to a cooling US job market. Slower hiring and wage growth could ease inflation pressures, but they also raise concerns about the broader economy if the slowdown continues.

Tariff uncertainty is adding to the drag on business sentiment. Higher import costs from tariffs are squeezing margins, leading many companies to delay hiring or scale back expansion plans.

While the labour market is still growing, the pace has clearly slowed – shaped by economic uncertainty, trade tensions, and fading momentum in both job creation and pay. Most of the recent data doesn’t yet reflect the full impact of President Trump’s new tariffs, as many were delayed by three months. However, tariffs on Chinese imports did take effect in April, and their impact could weigh more heavily on the job market in the months ahead.

American market volatility

The CBOE Volatility Index (VIX), often called the market’s “fear gauge,” opened the week at 25.75 and hovered between 27 and 23 before closing at 22.68 on Friday. The ride wasn’t exactly smooth – it was a rollercoaster ride with a sharp spike above 28 midweek followed the latest GDP report that showed the economy had unexpectedly contracted, reminding investors just how jittery the market remains.

Despite the bumps, the VIX continues to drift lower week by week, as investors gradually adjust to the uncertainty stirred up by President Trump’s aggressive trade policies.

For anyone new to the VIX: it’s basically Wall Street’s stress meter. Readings below 12 suggest markets are calm, 12–20 is the “business as usual” zone, and anything above 20 signals heightened anxiety.

First 100 days

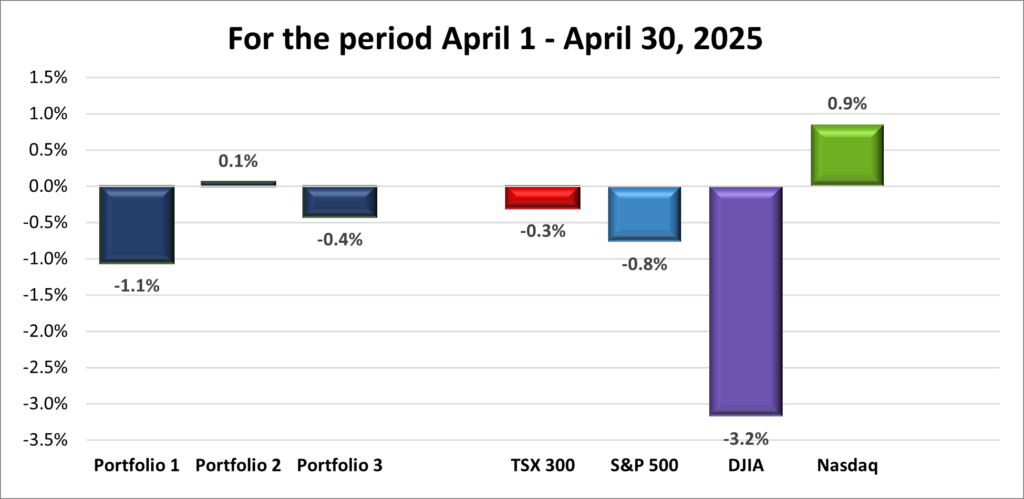
This past week marked the first 100 days of President Trump’s return to office – and it’s been a rocky ride for markets. Despite lofty expectations from some investors following his re-election, the reality has been far more turbulent. US stocks suffered their worst start to a presidential term in over half a century, with trillions in asset value erased.

The S&P 500 Index (S&P) fell 7.9%, the Dow Jones Industrial Average (DJIA) dropped 6.8%, and the Nasdaq Composite Index (Nasdaq) plunged 11%, marking the roughest opening stretch since President Nixon’s second term in 1973. Trump’s aggressive trade policies were the main trigger, as new tariffs targeting Canada, Mexico, and China disrupted supply chains and rattled investor confidence. The early April announcement of a blanket 10% tariff on all imports sparked a sharp sell-off, leading to the S&P 500’s steepest four-day decline since March 2020.

With recession fears and global tensions adding to the mix, market volatility has become the new normal – to the point where many investors seem almost numb to the whiplash. There were brief rebounds when the administration hinted at walking back some tariffs, but for now, uncertainty is the defining theme. For those who were greedy while others were fearful, there were plenty of chances to “buy the dip.” 😊

Another major casualty of Trump’s first 100 days was oil. Benchmark US crude prices dropped over 20%, falling to around US$60 per barrel – levels not seen since the depths of the COVID-19 pandemic, and well below the US$65 breakeven point for many American producers.

The slide was largely driven by growing fears of a global slowdown tied to Trump’s trade actions. New tariffs raised concerns about weaker demand for oil, while OPEC+ ramped up production during the same stretch, adding further pressure. Sanctions on Iranian oil offered some support, but it wasn’t enough to outweigh the broader bearish sentiment fueled by economic uncertainty.


Weekly Market and Portfolio Review

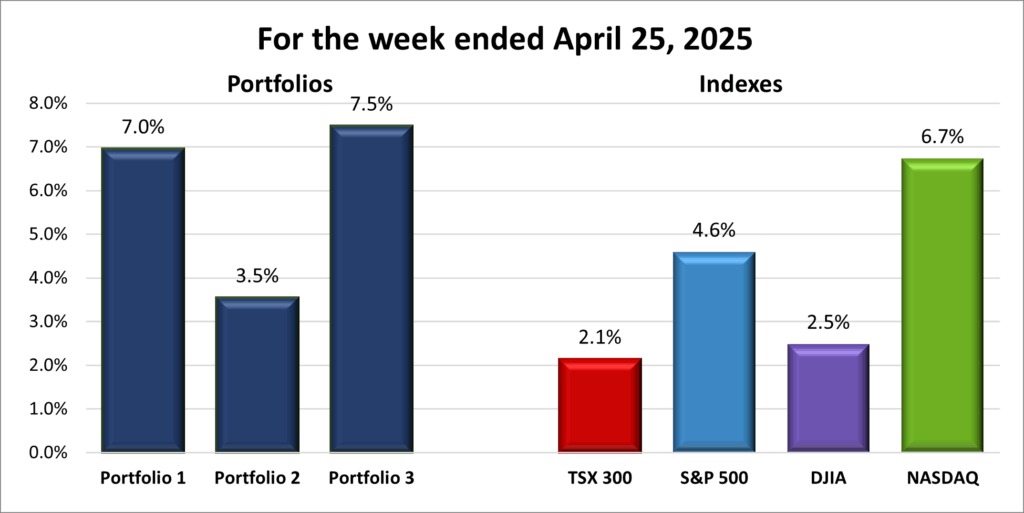
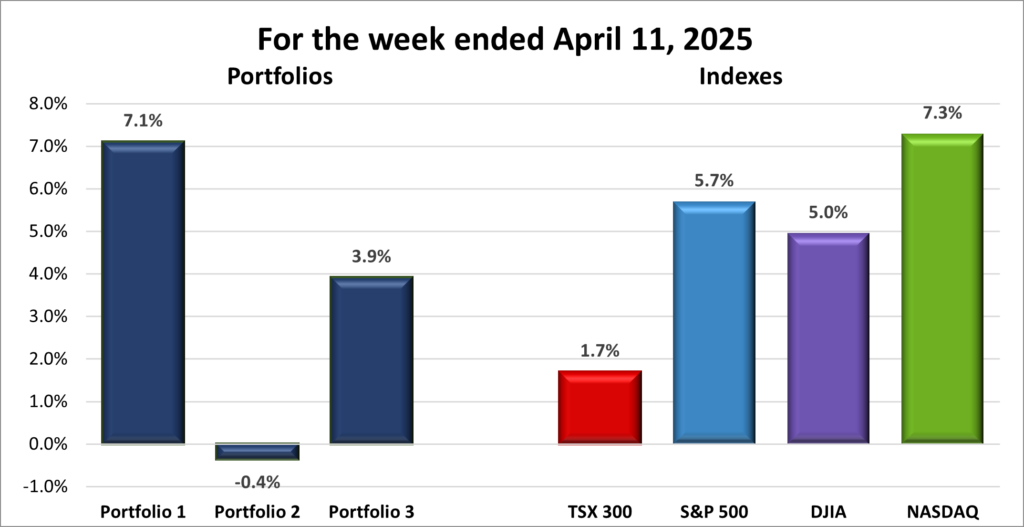
For the week, the TSX (SPTSX) grew 1.3%, the S&P 500 (SPX) gained 2.9%, the DJIA (INDU) rose 3.0% and the Nasdaq (CCMP) climbed 3.4%.

Index Weekly Streak
TSX: 4 – week winning streak
S&P: 2 – week winning streak
DJIA: 2 – week winning streak
Nasdaq: 2 – week winning streak

Bull market. A good week for the North American stock markets. It’s been a while, but markets finally delivered back-to-back weekly gains – something we hadn’t seen since January. All four major North American indexes – the Toronto Stock Exchange Composite Index (TSX), S&P, DJIA, and Nasdaq – ended the week in the green, keeping the positive momentum going.

It wasn’t the smoothest start, with the Nasdaq dipping slightly on Monday, but the rest of the week held firm. The DJIA and S&P quietly strung together nine consecutive daily gains – the longest winning streak for the S&P since November 2004 and for the DJIA since December 2023. For the S&P, the streak also helped erase the losses that followed President Trump’s sweeping tariff announcement on April 2. After a few unpredictable and volatile weeks, the mood felt cautiously optimistic.

What moved the markets?
Three main forces drove the markets this past week: economic data, earnings reports, and (as usual) tariffs.

The latest economic numbers gave investors a better look at how the US economy is absorbing the impact of new tariffs. Consumer confidence fell to its lowest level since the early days of the pandemic, and first quarter GDP contracted – raising doubts about whether the administration’s policies are boosting growth or holding it back. The labour market also showed signs of cooling, with fewer job openings, slower private sector hiring, and softer wage growth.

On the earnings front, big tech helped ease investor nerves. Microsoft (NASD: MSFT) and Meta (NASD: META) both posted strong results, easing concerns that their heavy artificial intelligence (AI) investments wouldn’t deliver returns. Their performance not only reassured investors but also suggested that, at least for now, tariffs haven’t slowed corporate spending – particularly in AI.

Still, many companies refrained from offering forward guidance, pointing to continued uncertainty from the trade war. With shifting policies and rising input costs, it’s getting harder for executives to confidently forecast the quarters ahead.

Tariffs remained in focus. This past week President Trump announced new exemptions for some foreign auto and parts imports to avoid “stacked” tariffs. Under the changes, companies like automakers will now pay only the highest applicable tariff, rather than multiple layers. Meanwhile, Commerce Secretary Howard Lutnick said a deal had been reached with one trading partner, and Treasury Secretary Scott Bessent reported progress on talks with India, South Korea, and Japan.

North of the border

In Canada, the TSX finally returned to positive territory for the first time since April 2, 2025. Investors welcomed the clarity brought by the newly elected federal government, seen as more business-friendly than the previous. That said, many businesses are taking a wait-and-see approach, as the new Prime Minister has so far left much of the previous government’s economic policies in place. Also weighing on the TSX was a sharp drop in oil prices – the biggest monthly decline in over three years.

For now, the markets stared into the jaws of a bear market and managed to avoid a mauling. But it’s too early to say whether the worst is behind us. Hopefully, the extreme volatility that’s rocked markets in recent weeks is fading – but we’re still just one social media post away from another wild ride. Still, after a stretch of uncertainty, it’s encouraging to see signs of stability – and maybe even a return to more traditional growth.

Portfolio Weekly Streak
Portfolio 1: 2 – week winning streak
Portfolio 2: 3 – week winning streak
Portfolio 3: 4 – week winning streak

Bull market. A good week for the North American stock markets. A strong week in the markets meant the rising tide lifted all boats – or in this case, all three of my portfolios, as shown in the chart below. It was great to see each one extend its win streak another week. 😊

Portfolio 1 posted a modest 2.3% gain. I was hoping for more, especially since 75% of the holdings ended the week in the green – including my largest position, Nvidia (NASD: NVDA). That said, there weren’t any standout gains over 10%, which likely kept the overall growth in check. One bright spot: TMX Group (TSE: X) hit an all-time high, which is always nice to see.

Portfolio 2 also advanced 2.3%, with 55% of its holdings finishing positive. The big movers? Take-Two Interactive (NASD: TTWO) and Fortis (TSE: FTS) both hit record highs, while Microsoft surged 11% following a strong earnings report. Solid across the board.

Portfolio 3 had the best weekly performance – up 2.7% – with a strong 76% of its companies gaining on the week. Microsoft’s rally gave the portfolio a boost, helping offset a steep 19.3% drop in Evolution Gaming Group AB (OTCM: EVVTY). That one stung. 😬

The sharp drop came after news broke that the UK Gambling Commission had launched a review of Evolution Malta Holding Limited, a subsidiary of Sweden’s Evolution Gaming Group AB. The investigation rattled investors, raising concerns not just about the subsidiary but about Evolution’s broader compliance practices. With the potential for fines – or even a licence revocation – the uncertainty sent shares tumbling to a three-year low. Ouch! ☹

With all three portfolios now on winning streaks, it’s nice to see some consistency after weeks of volatility and uncertainty. Hopefully, the markets can keep clawing back the ground lost since the start of President Trump’s tariff wars and start riding the tailwinds many investors had been hoping for since November – lower taxes, fewer regulations, and a more stable policy environment. If that happens, there’s a good chance this streak still has room to run. 😊

Weekly Portfolio & Index performance
Weekly Portfolio & Index performance for the week ended May 2, 2025.

Companies on the Radar

Stocks on my Radar 
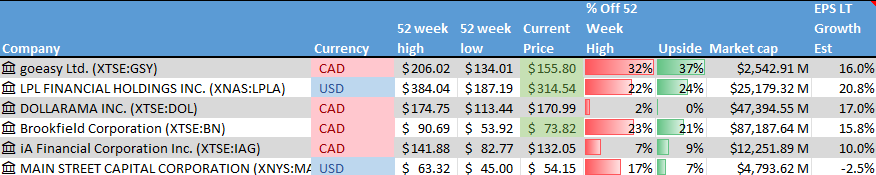
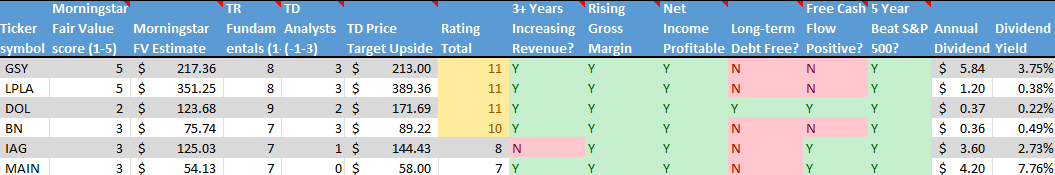
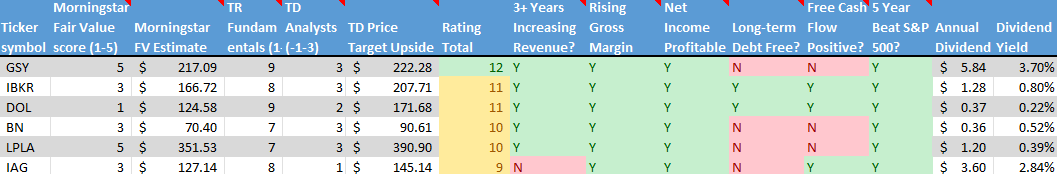
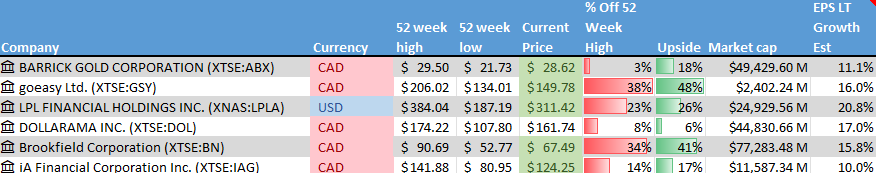
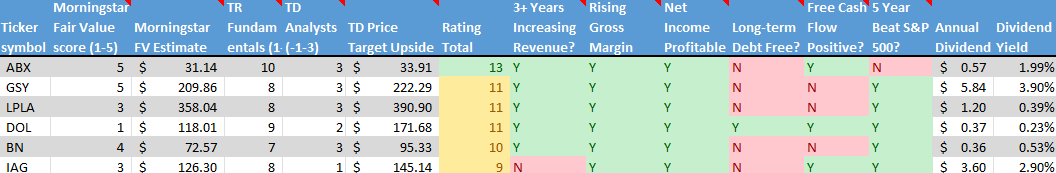
It was a quiet week on my investing radar. No new companies popped up, but I did make one change: I decided to drop iA Financial Corporation (TSE: IAG) from the list. After taking a closer look, it felt a little too similar to some of the other financial names already on my radar — like goeasy Ltd. (TSE: GSY), LPL Financial Holdings Inc. (NASD: LPLA), and Main Street Capital Corp. (NYSE: MAIN). Between them, GSY and LPLA seem like stronger opportunities, and MAIN still has me curious. With IAG off the board, my radar list is now down to these five companies:

  • goeasy Ltd.: A mid-cap Canadian company offering non-prime leasing and lending services. Higher risk, but high potential if they manage credit cycles well.
  • Dollarama (TSE: DOL): A growing large-cap Canadian discount retailer that’s also expanding into South America. With a recession expected in Canada, discount retailers are seeing an increase in business.
  • Brookfield Corporation (TSE: BN): A large-cap Canadian heavyweight in alternative asset management and real estate investing.
  • LPL Financial Holdings Inc.: A large-cap US firm providing a brokerage and advisory platform for independent financial advisors. Benefiting from long-term trends in wealth management.
  • Main Street Capital Corp.: A mid-sized American company that invests in or lends money to smaller private companies to help them grow.

As always, these are not buy recommendations – be sure to do your own research and make decisions that align with your personal financial goals!

The Radar Check was last updated May 2, 2025.

Stock on the Radar List. 1 of 2.
Stock on the Radar List. 2 of 2.


That’s a wrap for this week, thanks for reading may your portfolio stay green and your dividends steady. See you next time!


Monthly Portfolio Update April 2025

Monthly Market and Portfolio Review

Bearish marketApril 2025 Market Recap: A Wild Ride for Investors

April was anything but boring. From trade drama to political fireworks, markets lurched up and down as investors reacted to headlines almost daily. It wasn’t a meltdown, but it definitely tested our nerves.

The Dow Jones Industrial Average (DJIA) came close to its worst April since 1936, dropping 3.2% as President Trump’s new tariffs and criticism of US Federal Reserve (Fed) Chair Jerome Powell shook investor confidence. A late-month easing in tensions with China and a softening stance toward the Fed helped limit further losses – but volatility stayed high. Of the four major indexes—the S&P 500 (S&P), Nasdaq Composite Index (Nasdaq), DJIA, and Toronto Stock Exchange Composite Index (TSX) – only the Nasdaq managed to end the month higher, as shown in the chart below.

1. Tariffs everywhere: President Trump extended tariffs to nearly all US trading partners, spiking uncertainty. He then backtracked and levied a baseline 10% tariff, with each country given the option to negotiate separate trade deals. Markets struggled to price in the impact, and investors flipped between fear and optimism as the trade picture shifted by the day.

2. Fed under pressure: Renewed attacks on Fed Chair Powell raised questions about central bank independence – something markets don’t take lightly.

3. Economic slowdown: The US economy contracted in the first quarter. Consumer spending and confidence dropped, inflation continued to cool, and the labour market showed signs of strain – likely side effects of the trade war.

4. Earnings mixed: Strong results from big banks and a few heavyweight tech names helped stabilize markets at times, but earnings overall were a mixed bag.

5. Global tensions: Ceasefire talks in Ukraine and Israel-Hamas negotiations added another layer of uncertainty.

How did markets react?

In the US, volatility surged, nearing historical highs as indexes swung wildly. The Nasdaq bounced around the most, reacting sharply to every new twist in the trade and Fed stories.

Here in Canada, the TSX followed the global mood. Tariff fears, inflation concerns, and choppy commodity prices – especially oil and gold – drove sharp swings. The TSX clawed back some losses by month-end but still logged its third straight monthly decline. When the US sneezes – or fires off a tweet – Canada catches a cold.

Final thoughts

April was a reminder that markets move fast when uncertainty takes the wheel. Staying invested through turbulence isn’t easy, but these swings are part of the journey. It takes steady nerves to hang in and be greedy when others are fearful – but if you can stay focused and think long-term, you’re stacking the odds in your favour that you can build your wealth through investing. Here’s hoping May brings a bit more calm… but that’s probably wishful thinking. 😊

April was a mixed bag for the major indexes. The TSX dipped 0.3%, the S&P 500 slipped 0.8%, and the DJIA sank 3.2%. The Nasdaq stood out as the only gainer, rising 0.9% amid the volatility.

Portfolio Monthly Streak
Portfolio 1: 3 – month losing streak
Portfolio 2: 1 – month winning streak
Portfolio 3: 3 – month losing streak

Bearish market It was another tough month for the portfolios – though thankfully not as rough as March. The more aggressive Portfolios 1 and 3 felt the brunt of the market’s whiplash, while the more balanced Portfolio 2 managed to eke out a small gain… but hey, a gain is a gain. 😊 On the bright side, I used the volatility as a buying opportunity and added some shares of Interactive Brokers Group (NASD: IBKR) during a dip. I’d been watching the company for a while, and when the price slipped, I jumped at the chance to become an owner of the company.

Monthly Portfolio & Index performance
Monthly Portfolio & Index performance for April 2025.

What My Three Portfolios Did in April

Portfolio 1 for April 2025: DOWN Red Down Arrow

Activity

Bought: International Brokers Group, see April 18 Weekly Update.

Dividends Received this month:

Companies followed by DRIP (Dividend Re-Investment Plan) indicate additional shares were purchased with the dividend. Any cash leftover was added to the cash balance.

Canadian $

Canadian National Railway (TSE: CNR)

Tourmaline Oil Corp (TSE: TOU)

Telus (TSE: T) DRIP

Andlauer Healthcare Group Inc (TSE: AND)

Decisive Dividend Corp. (TSE: DE) DRIP

BCE Inc (TSE: BCE) DRIP

Dream Industrial Real Estate Investment Trust (TSE: DIR.UN) DRIP

US $

NVIDIA Corp. (NASD: NVDA)

Walmart (NYSE: WMT)

BSR Real Estate Investment Trust (TSE: HOM.UN)

Quarterly Reports

Alphabet Inc.

First quarter 2025 financial results on April 24, 2025

Celestica Inc.

First quarter 2025 financial results on April 24, 2025

Kraken Robotics Inc.

Fourth quarter 2024 financial results on April 28, 2025

Visa Inc.

Second quarter 2025 financial results on April 29, 2025

PayPal Holdings, Inc.

First quarter 2025 financial results on April 29, 2025

Grab Holdings Limited

First quarter 2025 financial results on April 29, 2025

Portfolio 2 for April 2025: UP Green Up Arrow, signifying a positive week

Activity

No significant activity to report this month.

Dividends Received this month:

Canadian $

Tourmaline Oil Corp (TSE: TOU)

Brookfield Infrastructure Partners LP (TSE: BIP.UN)

Brookfield Infrastructure Corp (TSE: BIPC)

Canadian Natural Resources (TSE: CNQ) DRIP

Telus (TSE: T) DRIP

Alimentation Couche-Tard Inc (TSE: ATD)

South Bow Corp (TSE: SOBO)

Whitecap Resources Inc (TSE: WCP)

SmartCentres Real Estate Investment Trust (TSE: SRU.UN)

Dream Industrial Real Estate Investment Trust (TSE: DIR.UN) DRIP

US $

No US$ dividends this past month.

Quarterly Reports

Dollarama Inc.

Fourth quarter 2025 financial results on April 3, 2025

Whitecap Resources Inc.

First quarter 2025 financial results on April 23, 2025

Guardant Health, Inc.

First quarter 2025 financial results on April 30, 2025

Microsoft Corp.

Third quarter 2025 financial results on April 30, 2025

Portfolio 3 for April 2025: DOWN Red Down Arrow

Activity

No significant activity to report this month.

Dividends Received this month:

Canadian $

Brookfield Renewable Corp (TSE: BEPC)

Brookfield Asset Management (TSE: BAM)

TD US Equity Index ETF (TSE: TPU)

Brookfield Corporation (XTSE: BN)

Brookfield Renewables Partners LP (XTSE: BN)

Alvopetro Energy Ltd (TSE: ALV)

SmartCentres Real Estate Investment Trust (TSE: SRU.UN) DRIP

goeasy Ltd (TSE: GSY)

US $

No US$ dividends this past month.

Quarterly Reports

Vertiv Holdings Co.

First quarter 2025 financial results on April 23, 2025

Real Matters Inc.

Second quarter 2025 financial results on April 30, 2025

Microsoft Corp.

See report under Portfolio 2.


Weekly Update for the week ending April 25, 2025

Trump vs. the Fed: Why Investors Are on Edge

US markets took another body blow at the start of this past week, once again set off by a tweet from President Trump. He renewed his public attacks on Federal Reserve (Fed) Chair Jerome Powell, calling him a “major loser” and demanding immediate rate cuts to juice the economy. Trump even floated the idea of firing Powell – a move that, while legally difficult, has rattled investor confidence.

The Fed’s independence isn’t just critical for the US economy – it’s a cornerstone of global financial stability. It gives the American central bank the freedom to make long-term decisions aimed at keeping inflation near 2% and supporting maximum employment, free from political interference. Undermining that independence risks throwing markets into turmoil and casting doubt – among global investors, businesses, and governments – on the credibility of both the US government and the Fed’s ability to manage the economy.

If Powell were removed, the shock to global markets could be severe. In the short term, we’d almost certainly see steep declines. The Dow Jones Industrial Average (DJIA) dropped over 1,000 points on Powell-related headlines, while the S&P 500 (S&P) and Nasdaq Composite Index (Nasdaq) have also seen sharp swings. The US dollar recently hit a three-year low, and rising Treasury yields are flashing warning signs that investors are getting anxious.

The longer-term fallout could be even more damaging. Borrowing costs might rise as investors demand higher yields to offset perceived risk. Inflation could become harder to control if rate decisions start looking politically motivated. And a broader loss of investor trust could push foreign capital out of US markets, undermining their reputation as a global safe haven.

It could also shift the investing landscape. If confidence in central banks starts to waver, we might see growing interest in alternative assets like Bitcoin and gold – stores of value outside the traditional system.

For Canadian investors, the ripple effects would hit close to home. With our deep trade and financial ties to the US, any disruption there tends to land quickly on the Toronto Stock Exchange Composite Index (TSX) and the Canadian dollar. Higher borrowing costs, weaker investor sentiment, and slower trade flows could all follow.

Globally, a move against Powell could spark widespread volatility. Markets in Europe and Asia would likely sell off, and emerging economies with heavy US dollar debt loads could face real pressure. Central banks around the world might be forced into reactive measures to stabilize their own markets.

This is a high-stakes moment. It’s not just about one central banker – it’s about confidence in the institutions that underpin long-term economic planning and global financial stability.

While President Trump’s attacks on the Fed dominated headlines early in the week, they weren’t the only thing that moved markets this week. First-quarter earnings season got underway, and global jitters over trade wars continued to unsettle investors. Let’s take a look at how the major indexes fared, and what drove the daily moves.


Items that may only interest or educate me ….

Canadian economic news, US economic news, Inflation isn’t gone…

Canadian Economic news

This past week’s key economic data that the Bank of Canada (BoC) considers when deciding whether to raise or lower the interest rate.

Retail sales

Statistics Canada reported a 0.4% drop in retail sales for February, matching expectations and marking the second monthly decline in a row after January’s 0.6% slide. While the monthly numbers were soft, the year-over-year picture looked much brighter – sales rose 4.7% compared to last February, improving on January’s 4.2% pace.

The monthly decline was mostly due to weaker auto sales, with new car dealers seeing a 3.0% drop – likely a result of ongoing tariff pressures in the auto sector. But if you strip out autos, gas stations, and fuel vendors, core retail sales actually rose 0.5%, bouncing back after January’s 0.2% dip. That strength came mainly from higher food and beverage sales. On a year-over-year basis, core sales jumped 4.9%, well ahead of the expected 3% gain.

Looking ahead, early estimates from Statistics Canada suggest a rebound in March, with retail sales projected to rise 0.7% – a promising sign that consumer spending may be picking up again.

Canadian market volatility

Canada’s market stress meter – the S&P/TSX 60 VIX (VIXC) – started the week elevated at 28.39 and briefly spiked into the 30 range after President Trump’s sharp criticism of the Fed Chair for not cutting interest rates. But as the week progressed, signs that the US might be softening its stance on tariffs helped settle investors’ nerves. The VIXC steadily drifted lower, ending the week at 22.68 – still elevated, and a reminder that uncertainty hasn’t left the building. Investors are uneasy, and caution is in the air.

For anyone just getting familiar, the VIXC is essentially Canada’s version of a fear gauge. Readings below 10 reflect strong investor confidence, 10–20 signals business as usual, and anything above 20 suggests uncertainty is creeping in.

US Economic news

This past week’s key data points that the Fed considers when deciding whether to raise or lower the interest rate.

Consumer Sentiment Index (CSI)

The University of Michigan’s final CSI reading for April came in at 52.2 – lower than the early estimate of 57.9 but still above analysts’ expectations of 50.8. That’s an 8.4% drop from March’s reading of 57.0 and a staggering 32.4% plunge compared to a year ago. It also marks the fourth straight monthly decline and the lowest reading since June 2022, when it fell to 50.8 – just shy of the all-time low of 50.0 recorded back in June 1980.

Digging into the details, consumers are feeling the pressure on both fronts. The Current Conditions Index, which looks at how people feel about their present financial situation, fell to 59.8 from 63.8 – a 6.3% monthly drop and 24.3% lower than a year ago. But the bigger red flag is the Expectations Index, which reflects how consumers view the next six months. That number dropped sharply to 47.3, down over 10% from March and nearly 38% lower year-over-year. Since January, expectations have nosedived 32%, the steepest three-month slide since the 1990 recession.

Inflation worries are front and centre, too. Year-ahead inflation expectations jumped from 5.0% to 6.5% – the highest level since 1981. The drop in consumer sentiment was widespread, cutting across all age groups, income levels, and political stripes. Ongoing uncertainty around trade policies, tariffs, and inflation is clearly weighing heavily on consumer confidence.

American market volatility

The CBOE Volatility Index (VIX), often called the market’s “fear gauge,” opened the week at 32.75 and briefly spiked above 35.0 after President Trump stirred the pot again – this time by suggesting he might remove Fed Chair Jerome Powell, raising fresh concerns about the Fed’s independence. A day later, he backtracked and said he never intended to fire Powell, which helped calm things down. Add in a dose of optimism around potential trade deals with key partners, and the VIX continued to drift lower, finishing the week at 24.84.

That means once again, the VIX ended lower than where it started – a small win for investor nerves. Still, it’d be nice to see it kick off next week lower than 25 and keep heading toward calmer territory.

For those new to the VIX: think of it as the market’s stress meter. A reading below 12 means investors are feeling relaxed, 12–20 is the “normal” range, and anything above 20 signals rising uncertainty and market jitters.

No, Mr. President, Inflation Isn’t Gone

Fresh off attacking all of America’s trading partners, President Trump has set his sights on a new target – Fed Chair Jerome Powell. Earlier this week, Trump took to social media to declare that “There is virtually no inflation,” while slamming Powell as “Mr. Too Late” and “a major loser.”

However, his remarks oversimplify how inflation is measured – and reveal a possible misunderstanding of the Fed’s approach. When setting policy, the Fed focuses on core inflation metrics like Core CPI and Core PCE, which exclude volatile items like food and energy – the very categories Trump claimed were falling. Those prices swing wildly from week to week, making them a poor guide for long-term decisions.

🧺 Think of inflation like a grocery basket. Some items, like eggs and gas, bounce around in price every week – that’s headline inflation. But to get a clearer picture, the Fed filters out those volatile items and looks at more stable prices like rent, clothing, and services. That’s core inflation – and it’s a better signal of where things are really heading.

And right now, it’s still running high. March’s core CPI came in at 2.8% year-over-year, and the Fed’s preferred measure – core PCE – was also sitting at 2.8% in February. It’s been hovering there for five months. The March PCE report, due next week, could offer the first solid glimpse at how tariffs are feeding into price pressures.

With inflation still well above the Fed’s 2% target, the Fed policymakers are staying cautious. They want to see how the tariff drama plays out before making any rate moves. From their perspective, cutting too soon could risk pouring more fuel on the inflation fire.


Weekly Market and Portfolio Review

For the week, the TSX (SPTSX) rose 2.1%, the S&P 500 (SPX) climbed 4.6%, the DJIA (INDU) advanced 2.5% and the Nasdaq (CCMP) surged 6.7%.

Index Weekly Streak
TSX: 3 – week winning streak
S&P: 1 – week winning streak
DJIA: 1 – week winning streak
Nasdaq: 1 – week winning streak

Bull market. A good week for the North American stock markets. After weeks of choppiness and volatility, the markets finally pulled off a rare feat – all four major indexes posted gains. The TSX, S&P, the DJIA, and the Nasdaq all closed the week in the green, as shown in the chart above. The Nasdaq and the S&P led the pack, thanks to a four-day rally fueled by a rebound in heavyweight technology companies.

After a relatively quiet stretch the week before, market drama returned in full force at the start of the week – and once again, it kicked off with a tweet. Investors were already on edge over President Trump’s escalating tariff battles with key trading partners. Then things got even more chaotic: Trump called for the Fed to slash interest rates and hinted that he might fire Fed Chair Jerome Powell. That kind of political interference is a big red flag – the idea of undermining the Fed’s independence rattled markets immediately.

Markets didn’t stay down for long, though. Comments from Trump and US Treasury Secretary Scott Bessent that tariff tensions might ease gave the markets some hope. That optimism was reinforced when Trump walked back his comments about firing Powell, helping calm fears about the Fed’s autonomy. Then came a one-two punch of good news: stronger-than-expected corporate earnings and comments from a few Fed officials about a potential rate cut, possibly as soon as June. That mix of strong earnings, Fed independence, trade optimism, and dovish Fed signals lit a fire under the markets.

That said, it wasn’t all sunshine. Consumer sentiment in the US took a steep 32% hit, shaken by inflation and fears of a slowing economy.

In Canada, markets rode the wave of easing US–China trade tensions, lifted further by improved sentiment from south of the border and anticipation of next week’s federal election, which is expected to usher in a more business-friendly government.

All in all, a strong week for North American markets. But one thing is clear: we’re in a new market reality where shifting economic policies out of Washington are taking the lead. Earnings reports and traditional economic data are often taking a backseat to political headlines – and sometimes even a single tweet. In today’s market, uncertainty rules. And when even a stray comment can send stocks soaring or tanking, it’s no wonder volatility remains high. For us investors, it’s a reminder that we’re navigating a market where policy and politics can matter just as much – if not more – than the fundamentals.

Portfolio Weekly Streak
Portfolio 1: 1 – week winning streak
Portfolio 2: 2 – week winning streak
Portfolio 3: 3 – week winning streak

Bull market. A good week for the North American stock markets. A strong week in the markets usually spells good news for the three portfolios – and this week definitely delivered, as shown in the weekly performance chart below. For the first time in nine weeks, all three portfolios posted a gain at the same time.

Portfolio 1 had a strong showing, with 81% of its holdings finishing in the green and a total weekly gain of 7.0%. Leading the charge was Andlauer Healthcare Group Inc. (TSE: AND), which surged 29% on news of a takeover bid by UPS (NYSE: UPS). Other standout performers included Lattice Semiconductor (NASD: LSCC) up 23%, Shopify (TSE: SHOP) up 18%, Grab Holdings (NASD: GRAB) up 16%, CrowdStrike (NASD: CRWD) up 15%, Cloudflare (NYSE: NET) and Magnite (NASD: MGNI) up 13%, Datadog (NASD: DDOG) and Skyworks Solutions (NASD: SWKS) up 12%, and both Amazon.com (NASD: AMZN) and the portfolio’s largest holding, Nvidia (NASD: NVDA), up 11%.

With so many companies posting strong gains this week, I was a little surprised the portfolio didn’t climb even higher.

Portfolio 2 trailed the others but still delivered a respectable 3.5% gain, with 96% of its holdings in positive territory. Notable movers included MongoDB (NASD: MDB) up 10%, and Take-Two Interactive (NASD: TTWO), which hit an all-time high.

Portfolio 3 came out on top with a 7.5% gain, as 95% of its holdings – all but one – posted gains. Big contributors included Vertiv Holdings (NYSE: VRT) up 22%, Shopify up 18%, Magnite and Cloudflare both up 13%, and Real Matters (TSE: REAL) up 10%.

After weeks of uncertainty and volatility, it was refreshing to see the portfolios and markets finally moving in sync – and in the right direction. With all three portfolios posting gains and some standout performances across the board, I’m cautiously optimistic heading into next week. While uncertainty is still very much part of the investing landscape, this week was a reminder that staying invested through the noise can pay off. Here’s hoping we get a quiet week on social media and the upward momentum keeps rolling!😊

Weekly Portfolio & Index performance
Weekly Portfolio & Index performance for the week ended April 25, 2025.

Companies on the Radar

Stocks on my Radar It was a pretty quiet week on my radar, with not much movement – until one new company caught my eye: Main Street Capital Corp (NYSE: MAIN). They’re a mid-sized American firm known as a business development company (or BDC for short), which basically means they invest in and lend money to smaller private companies that are looking to grow. Think of them as part investor, part lender, helping businesses with things like management buyouts, expansion plans, and acquisitions.

On my radar test, MAIN doesn’t score particularly high. In fact, it’s the lowest-scoring company currently on my list. But I’m still curious. I suspect its recent share price drop has more to do with the broader market volatility tied to tariff tensions than anything company specific.

What really caught my attention is MAIN’s 7.2% dividend yield (as of the week ending April 25, 2025), which is pretty generous. Even more encouraging is the company’s 50% dividend payout ratio – that means they’re paying out only half of their earnings as dividends, leaving the other half to reinvest in the business. For a BDC, that kind of balance is a good sign. It suggests they’re focused on long-term sustainability, not just handing out big dividends to look good in the short term.

So, while MAIN isn’t a top contender (yet), it’s officially earned a closer look—and now joins the five companies listed below on my radar list.

  • goeasy Ltd. (TSE: GSY): A mid-cap Canadian company offering non-prime leasing and lending services. Higher risk, but high potential if they manage credit cycles well.
  • LPL Financial Holdings Inc. (NASD: LPLA): A large-cap US firm providing a brokerage and advisory platform for independent financial advisors. Benefiting from long-term trends in wealth management.
  • Dollarama (TSE: DOL): A growing large-cap Canadian discount retailer that’s also expanding into South America. With a recession expected in Canada, discount retailers are seeing an increase in business.
  • Brookfield Corporation (TSE: BN): A large-cap Canadian heavyweight in alternative asset management and real estate investing.
  • iA Financial Corporation (TSE: IAG): A large-cap Canadian financial services firm with a solid insurance business in both Canada and the US.

As always, these are not buy recommendations – be sure to do your own research and make decisions that align with your personal financial goals!

The Radar Check was last updated April 25, 2025.

Stock on the Radar List. 1 of 2.

Stock on the Radar List. 2 of 2.


That’s a wrap for this week, thanks for reading may your portfolio stay green and your dividends steady. See you next time!


Weekly Update for the week ending April 18, 2025

Market Manipulation: What It Is and Why It Matters to Investors?

After everything that’s gone down in the markets over the past couple of weeks – wild swings, big headlines, and whispers of manipulation – I figured it was a good time to talk about something that doesn’t come up often enough: how the stock market can be manipulated, and what that actually means for us investors.

At its core, market manipulation is when someone deliberately tries to mess with normal buying and selling to move stock prices in their favour. It’s like rigging the game so they win – at the expense of everyone else.

There are a few common ways this happens. One of the best-known is the pump and dump: someone hypes up a stock (usually a small, unknown one), gets people excited, watches the price shoot up – and then dumps all their shares for a profit, leaving everyone else holding the bag. Then there’s spoofing, where traders place large fake orders to make it look like there’s strong demand or supply, only to cancel those orders before they go through. It’s all designed to trick other traders into reacting.

Other tactics include wash trading – where someone buys and sells the same stock repeatedly to create the illusion of high activity – and spreading false info online to sway investor sentiment. Whatever the method, the goal is the same: push prices in a direction that benefits the manipulator.

Regulators like the Canadian Securities Administrators (CSA) here in Canada and the Securities and Exchange Commission (SEC) in the US are supposed to keep an eye on this kind of behaviour. They work with other watchdogs to investigate suspicious activity and help keep markets as fair as possible. But with social media and fast-moving headlines, it’s getting harder to separate genuine market reactions from something more calculated.

Market manipulation isn’t new. One of the earliest documented cases happened way back in 1814, when a man faked news of Napoleon’s death to trigger a surge in British bond prices – then cashed in once everyone bought in on the lie.

In Canada, manipulation has mostly shown up in old-school pump and dump schemes, especially with low-volume penny stocks on the TSX Venture Exchange. Promoters spread hype – usually online – and once the stock shoots up, they quietly sell off their shares and disappear. Regulators like the Ontario Securities Commission have cracked down on a few of these, but by then, the damage is usually already done.

Fast-forward to today, and some of those same tactics are showing up again – just dressed up in more high-tech ways. Take early April 2025: markets tanked after President Trump announced sweeping tariffs against all of America’s trading partners. But a few days later, he reversed course with a post online saying most of the tariffs were paused – except for those on Chinese imports. The sudden back-and-forth sent markets into a tailspin, with some people wondering if it was a kind of “reverse pump and dump.” Was it just poor communication, or something more strategic? We don’t know – but it definitely raised eyebrows.

So, is the recent market drama the result of manipulation? Maybe. Maybe not. Markets can react sharply to unexpected news, especially when it comes from high places. But when those wild swings seem to follow vague announcements or cryptic tweets, it’s fair to raise an eyebrow. Still, volatility alone doesn’t equal manipulation. Sometimes it’s just the market doing what it does best – responding to new information in real time. Proving actual intent, though, takes more than suspicion – it requires a thorough investigation.

Why does this matter to us investors? Because manipulation – whether intentional or not – can trigger overreactions that distort the real value of a stock. If you’re caught up in the frenzy, it’s easy to buy in too high or sell out too low. These swings can mess with your emotions, your decision-making, and even your long-term strategy. That’s why it pays to stay focused on quality companies, tune out the hype, and remember: the market’s short-term drama doesn’t change the fundamentals of a solid business.

Now that we’ve explored both historical and possible current examples of market manipulation, let’s shift gears and look at what actually drove markets during this Easter-shortened trading week.


Items that may only interest or educate me ….

Canadian Economic news, US Economic news, ….

Canadian Economic news

This past week’s key economic data that the Bank of Canada (BoC) considers when deciding whether to raise or lower the interest rate.

Bank of Canada rate decision

The BoC decided to hit the pause button, holding its benchmark interest rate at 2.75% after seven straight cuts since June 2024, when the rate stood at 5.0%. It’s the first break in the interest rate easing cycle and comes amid cooling inflation, slower consumer spending, and a softening job market. However, the central bank’s bigger concern was the uncertainty surrounding US trade policy. BoC Governor Tiff Macklem made it clear that the recent wave of US tariffs – and the chaotic way they’ve been rolled out – was a key factor in today’s decision.

In its latest Monetary Policy Report, the BoC laid out two possible paths forward: one where the impact of tariffs is relatively short-lived, leading to a temporary economic slowdown, and another where a prolonged trade war drags Canada into recession and pushes inflation above 3% next year.

Looking ahead, the BoC said it will be cautious with future moves, closely monitoring how trade disruptions affect demand, inflation trends, and consumer confidence.

Consumer Price Index (CPI)

Inflation in Canada cooled more than expected in March, according to the latest CPI report from Statistics Canada. Prices rose just 0.3% month over month – down sharply from February’s 1.1% increase and well below analysts’ expectations of 0.6%. On a yearly basis, inflation eased to 2.3%, down from 2.6% in February, while most economists had been expecting it to hold steady.

Drilling into the details: the biggest monthly price jump came from the ‘Alcoholic beverages, tobacco products and recreational cannabis’ category, which rose 2.3%. On the flip side, ‘Gasoline’ saw the largest monthly drop, falling 1.8%. Year over year, ‘Shelter’ – which includes mortgage costs and rent – remained the biggest contributor to inflation with prices up 3.9% – though that’s a slight slowdown from February’s 4.2%. ‘Gasoline’ again saw the largest annual decline, dropping 1.6%.

Core inflation – which excludes more volatile food and energy prices – rose just 0.2% in March, down from 0.9% the month before. On a yearly basis, the core rate cooled to 2.4% from 2.9%. The overall slowdown was mainly driven by lower gasoline and travel tour prices, which helped offset increases elsewhere – like restaurant food, which was up 3.2% compared to last year.

From an interest rate perspective, some analysts thought this report might push the BoC one step closer to cutting rates at its meeting the following day. With inflation continuing to ease toward the Bank’s 2% target, opinions were split on whether policymakers would stay the course or go ahead with another cut. In the end, those expecting the central bank to hit pause were right.

Canadian market volatility

The S&P/TSX 60 VIX (VIXC), Canada’s volatility gauge, started the week at an elevated 30.37 and gradually eased to close at 20.86. While still above the 20-mark – suggesting investors remain cautious – the lack of major developments on tariffs or other fronts helped keep volatility in check. After several weeks of sharp swings, it seems investors may be adjusting to the ongoing uncertainty around trade.

For those new to the VIXC, it’s essentially the Canadian market’s stress meter. Readings below 10 point to strong investor confidence, 10 to 20 signals business as usual, and anything over 20 means uncertainty is creeping in.

US Economic news

This past week’s key data points that the Federal Reserve (Fed) considers when deciding whether to raise or lower the interest rate.

Retail Sales

The Commerce Department’s advance estimate suggests Americans were in a buying mood last month, with retail sales jumping 1.4% in March – well ahead of February’s modest 0.2% rise and slightly beating analysts’ expectations of a 1.3% increase. Year over year, sales climbed 4.6%, up from 3.1% in February, as shoppers appeared to pull purchases forward to avoid looming US tariffs.

Core retail sales—which exclude autos, vehicle parts, and gas stations – also showed solid momentum, rising 0.8% in March after a 0.5% increase in February. On a yearly basis, core sales grew 4.5%, compared to 3.5% the month before.

Analysts widely agree that this spike wasn’t fueled by renewed consumer confidence but by shoppers rushing to lock in prices before tariffs kick in – especially on big-ticket items like motor vehicles, which jumped 5.3% in March compared to February. In other words, the strength in sales seems driven more by pre-emptive buying than by a fundamentally strong economy. And with consumer sentiment falling for the fourth straight month, it’s likely this spending surge will be short-lived.

American market volatility

The CBOE Volatility Index (VIX), often called the market’s “fear gauge,” opened this week at 34.76 – still high, but noticeably calmer than last week’s spike above 60, which marked full-blown panic levels. With no new tariff bombshells to jolt the markets, the VIX drifted lower into the low 30s and held there for most of the week, before dropping below 30 at the last minute on Friday to close at 29.65. While it’s a step down from last week’s chaos, the VIX is still well above normal levels, signalling that investors are still on edge.

For anyone new to the VIX, think of it as the market’s stress meter. Below 12 means calm, 12–20 reflects normal volatility, and anything above 20 points to growing uncertainty.


Weekly Market and Portfolio Review

For the week, the TSX (SPTSX) gained 2.6%, the S&P 500 (SPX) dropped 1.5%, the DJIA (INDU) fell 2.7% and the Nasdaq (CCMP) sank 2.6%.

Index Weekly Streak
TSX: 2 – week winning streak
S&P: 1 – week losing streak
DJIA: 1 – week losing streak
Nasdaq: 1 – week losing streak

Bearish marketBull market. A good week for the North American stock markets. This past week, the markets finally caught their breath. There were no dramatic tweets to send stocks soaring or tumbling, and after weeks of being tossed around like a yoyo, things calmed down – at least for a bit. All four major indexes – the Toronto Stock Exchange (TSX), the S&P 500 (S&P), the Dow Jones Industrial Average (DJIA), and the Nasdaq Composite (Nasdaq) – started the week on a positive note. But as the days went on, Canadian and US markets began to diverge, as shown in the weekly progress chart above.

The shortened trading week leading into the Easter holiday began with a tailwind. The Trump administration granted temporary tariff exemptions on a range of electronics – including smartphones, laptops, and networking gear – helping to lift investor sentiment. The market largely shrugged off the fact that these exemptions were, well, temporary, and that new tariffs on semiconductors and other tech products are still waiting in the wings.

While the week lacked the wild swings we’ve seen recently, there was no shortage of tension. Strong earnings from the big banks helped bring some stability, even as investors kept a wary eye on ongoing trade uncertainty. Midweek, it wasn’t a presidential tweet but Fed Chair Jerome Powell who stirred the pot. Powell warned that the current trade policy could result in “higher inflation and slower growth,” creating a “challenging scenario” for the Fed as it tries to balance its dual mandate – keeping inflation under control and supporting job growth. Needless to say, that didn’t sit well with President Trump, who continues to argue that tariffs are the best thing ever for America.

Meanwhile, the tech sector took a hit, dragging down the rest of the American markets, after Nvidia (NASD: NVDA) disclosed a US$5.5 billion write-down linked to new US restrictions on artificial intelligence (AI) chip exports to China. The crackdown specifically targets Nvidia’s H20 chips, which were previously designed to comply with earlier rules. Now they’re stuck in licensing limbo. AMD (NASD: AMD) also got caught up in the AI restrictions, announcing an $800 million write-down of its own. Tech stocks stumbled on the news, and investors were reminded just how much global tensions can rattle the AI boom.

Despite the headwinds, the long-term AI outlook remains solid, as companies adapt by shifting supply chains and investing more heavily in domestic production. Nvidia is already expanding US -based manufacturing, with plans for new facilities in Arizona and Texas.

North of the border, the TSX was the week’s standout among the indexes. Soaring gold prices – continuing their record-setting run – combined with a rally in oil, helped push the index to its biggest weekly gain since September 2024. The jump in oil came on the heels of new US sanctions on Iranian oil exports which is expected to tighten global supply. Cooling inflation also gave investors some relief. The only minor downside was the BoC ending its streak of seven consecutive rate cuts and, on a more ominous note, warning that a prolonged trade war with the US could tip the Canadian economy into recession. Still, investors seemed to take the pause and the recession risk in stride.

All things considered, it was nice to get a calmer, less volatile week. Trade uncertainty is still weighing on sentiment, but progress on major deals – particularly with larger partners – could shift the tone. It would’ve been even better if US markets had followed Canada’s lead into the green. But there’s always next week. 😊

Portfolio Weekly Streak
Portfolio 1: 1 – week losing streak
Portfolio 2: 1 – week winning streak
Portfolio 3: 2 – week winning streak

Bull market. A good week for the North American stock markets.Bearish market After last week’s big gains, I was cautiously optimistic that all three portfolios would keep the momentum going – especially Portfolios 1 and 3, which were aiming for back-to-back wins. But a clean sweep wasn’t in the cards, as you can see in the chart below. One company ended up being the spoiler.

Portfolio 1 was the only one to finish in the red, down 2.7% on the week. And it wasn’t for lack of effort: 75% of the holdings posted gains, with International Petroleum Corp (TSE: IPCO) surging 16% and Magnite (NASD: MGNI) climbing 15%. Unfortunately, the tech giants weighed it down. Amazon.com (NASD: AMZN), Alphabet (NASD: GOOGL), and especially Nvidia – Portfolio 1’s largest holding – tumbled, with Nvidia dropping 6%. How Nvidia goes, so goes the portfolio… and this week, it went down. ☹

Portfolio 2 had the strongest showing this week, rising 1.4% and putting an end to a weekly losing streak that had stretched to three straight weeks. An impressive 85% of the holdings were in the green for the week, helped along by a strong showing from its energy stocks. Whitecap Resources Inc. (TSE: WCP) led the way with a 10% gain, giving the portfolio a solid lift.

Portfolio 3 also finished higher, up 1.0%. Like Portfolio 2, it had 85% of companies posting weekly gains, but it didn’t get quite the same boost from the energy sector. Still, it was helped by Magnite’s 15% rally, which made its presence felt across more than one portfolio.

Despite a mixed week for both the indexes and my portfolios, I’m staying focused on the long game – investing in quality companies and letting time do the heavy lifting. Market dips are a double-edged sword. On one hand, they can present great buying opportunities, like my purchase of a few shares of Interactive Brokers (NASD: IBKR). On the other, they can be frustrating in the moment (thanks, Nvidia). That said, I’m confident the strong companies I own will keep delivering over time. If the market wants to head higher again soon, I won’t complain. 😊

Weekly Portfolio & Index performance
Weekly Portfolio & Index performance for the week ended April 18, 2025.

Companies on the Radar

Stocks on my Radar Another week with minimal changes to my radar list, as I added a company that’s been on my radar before and removed one that’s fallen off. I’ve decided to take Barrick Gold Corporation (TSE: ABX) off the list. With gold hitting record highs in March and again as recently as April 11, I expected a top-tier gold miner like Barrick to see a stronger lift. And while the stock has climbed, it also dropped sharply the previous week. Maybe that dip was a missed buying opportunity – but if it’s falling when I think it should be rising, that might be a sign the gold sector is outside my circle of competence. 😊

Barrick’s performance also seems tightly tethered to the price of gold, and I generally prefer companies that aren’t so closely tied to the unpredictable nature of commodities. Whether it’s oil, gold, or agriculture, commodity-driven stocks can be volatile – and a lot tougher to evaluate. So, with all that in mind, I’m moving on. There are plenty of other companies out there.

One of those other companies out there was Interactive Brokers, which jumped back onto my radar last week. After listening to its first quarter earnings call, I liked what I heard. With Mr. Market offering shares at a discount, I decided it was the right time to become an owner. 😊

With Interactive Brokers briefly appearing on my radar before quickly moving into Portfolio 1, and Barrick Gold dropping off, my radar list now consists of five companies:

  • goeasy Ltd. (TSE: GSY): A mid-cap Canadian company offering non-prime leasing and lending services. Higher risk, but high potential if they manage credit cycles well.
  • Dollarama (TSE: DOL): A growing large-cap Canadian discount retailer that’s also expanding into South America. With a recession expected in Canada, discount retailers are seeing an increase in business.
  • Brookfield Corporation (TSE: BN): A large-cap Canadian heavyweight in alternative asset management and real estate investing. Big, diversified, and built for the long haul.
  • LPL Financial Holdings Inc. (NASD: LPLA): A large-cap US firm providing a brokerage and advisory platform for independent financial advisors. Benefiting from long-term trends in wealth management.
  • iA Financial Corporation (TSE: IAG): A large-cap Canadian financial services firm with a solid insurance business in both Canada and the US. Steady and reliable.

As always, these are not buy recommendations – be sure to do your own research and make decisions that align with your personal financial goals!

The Radar Check was last updated April 17, 2025.

Stock on the Radar List. 1 of 2.
Stock on the Radar List. 2 of 2.

Portfolio Update

Portfolio 1

Buy: This past week, I added Interactive Brokers to my portfolio – a move I’ve been mulling over for a while now. Founded in 1977 by Thomas Peterffy, a pioneer in electronic trading, the company has grown into a global powerhouse. Though Peterffy passed away earlier this year, he was still Chair of the Board at the time, and his legacy lives on in the tech-driven brokerage he built. Today, IBKR offers direct access to stocks, options, futures, forex (foreign exchange trading), bonds, ETFs, and even crypto, spanning 160+ exchanges across 36 countries.

What drew me to Interactive Brokers is its blend of low-cost trading, global reach, and innovative technology. It’s not just popular with institutions – many individual investors I follow and respect use the platform themselves. Despite ongoing market volatility, the company continues to post record-breaking trading volumes and impressive client growth. In Q1 2025 alone, IBKR added 279,000 new accounts – a 32% increase year-over-year.

The moat here feels real. Its advanced platform, competitive pricing, and vast market access create high switching costs. Once you’re in the IBKR ecosystem, it’s tough to leave. The company is also pushing hard into Canada, Europe and Asia, and making strides in crypto trading – particularly in the European Union.

Financially, IBKR looks strong: consistent revenue and earnings growth, a return on capital over 15%, and a rock-solid balance sheet. It recently raised its quarterly dividend to $0.32 per share, though it hasn’t been active on the share buyback front – something I’ll be keeping an eye on. A recent 4-for-1 stock split will also expand the share count further.

That said, no investment is without its risks, and IBKR has a few yellow flags. The rising share count – including the split – could lead to shareholder dilution if not offset by strong earnings growth or buybacks. The dividend, while growing, remains relatively modest. As a global company, IBKR also faces exposure to regulatory shifts, currency moves, and geopolitical tensions. Plus, since much of its revenue is tied to trading activity, quieter markets can affect results. And while the platform is known for its depth and tools, it may feel overwhelming to newer investors. In a competitive field with players like TD Bank (TSE: TD), Charles Schwab (NYSE: SCHW) and Morgan Stanley (NYSE: MS), IBKR has to keep innovating to maintain its edge.

All in all, I see IBKR as a long-term compounder in the brokerage space, with optionality in new asset classes and geographies. It’s the kind of stock I’m happy to own – not just as an investor, but possibly as a future user of the platform too.


That’s a wrap for this week—may your portfolio stay green and your dividends steady. See you next time!


Weekly Update for the week ending April 11, 2025

Riding Out the Emotional Rollercoaster of Market Meltdowns

The sell-off at the start of the week wiped out the past 12 months of gains, with stocks edging closer to bear market territory. Since the previous Thursday, US markets saw their steepest three-day decline since 1987 – and before that, not since World War II. Meanwhile, Canada’s TSX Composite Index (TSX) experienced its sharpest drop since the early days of the COVID-19 pandemic. This time, though, the damage was self-inflicted—and, frankly, far from fun. ☹

Investing isn’t just about numbers – it’s also about managing your emotions, especially during turbulent times like these. Over the past few days, we’ve seen another sharp market drop that’s stirred up everything from fear and frustration to cautious optimism. So how should we respond? And how does this moment compare to past market meltdowns?

Looking back, history gives us some helpful perspective. In March 2020, as the COVID-19 crisis hit, markets plunged 34% in just a few weeks. Headlines were full of panic. But even amid all the fear, some investors saw opportunities – buying into sectors like tech and healthcare, which would later lead the recovery.

That wasn’t the first time panic gripped the markets. Go back to 2008, and the story is even more dramatic. The financial system itself was at risk, and investor confidence was shattered. Many sold off everything and locked in their losses. Others who held on – or even bought during the depths – ended up doing very well as the recovery unfolded.

And this time we faced another sharp decline, fuelled by what The New York Times called “the dumbest trade war ever,” that have led to growing geopolitical tensions. Emotions are running high. Some investors were rushing to sell. Others were cautiously looking for chances to “buy the dip.”

I’ve been through moments like this before. During the 2008 crisis, I saw Canadian bank stocks getting hammered – even though there was nothing fundamentally wrong with them. They were simply caught up in the broader market panic. I bought them at steep discounts, and it turned out to be a smart move. Fast forward to the COVID crash, and I’ll admit – my first reaction was panic. I had more money invested by then, so the losses felt bigger. But I reminded myself that selling would only lock in the damage. Within a week, markets started bouncing back, and I began picking up some of the hardest-hit names. Over the next 18 months, the markets soared, and all three portfolios recovered – and then some. If I’d sold during the panic, I would’ve missed all of it.

Getting back to the present: Just as feelings of doom and gloom were settling in—at least for those not buying the dip—President Trump hit pause on the US tariffs. Saying markets responded positively would be an understatement. The Nasdaq Composite Index (Nasdaq) surged over 12%, logging one of its biggest single-day gains since 2008. The S&P 500 Index (S&P) jumped 9.5%, the Dow Jones Industrial Average (DJIA) climbed 7.8%, and the TSX rose more than 5%.

This sharp reversal reflects a wave of investor relief, as the pause eased fears of escalating trade tensions and their economic fallout. That said, tariffs on Chinese imports were still hiked to 145%, which could complicate things down the road. But the key takeaway? If you had panicked and sold during the downturn, you would’ve missed this rebound—and it may now cost you more to buy back the same stocks.

So what’s the takeaway here? Emotional decisions rarely lead to long-term success. Selling in fear usually means locking in losses. Instead, use market meltdowns as a chance to reassess your strategy. If you believe in the fundamentals of the companies you own, staying the course might be the best move. And if you’ve got dry powder (also known as extra cash available), corrections like these can offer a shot at picking up great companies at lower prices.

At the end of the day, investing is a long game. Markets rise, fall, and rise again. Staying patient, sticking to your plan, and not letting fear take the wheel – that’s what builds wealth over time.

So, with that perspective in mind, let’s take a look at what actually unfolded in the markets this past week – and how it all played out across the portfolios.


Items that may only interest or educate me ….

Canadian Economic news, US Economic news, ….

Canadian Economic news

This past week’s key economic data that the Bank of Canada (BoC) considers when deciding whether to raise or lower the interest rate.

Canadian market volatility

The S&P/TSX 60 VIX (VIXC), which tracks expected volatility in the Canadian market, opened the week at 18.32 before quickly climbing above 20. It kept rising throughout the week – spiking above 30 after the 90-day tariff pause was announced, and then surging past 40 the next day as the US-China trade war escalated. By Friday, it had eased slightly but still closed at a high 32.78.

For those unfamiliar with the VIXC, think of it as the Canadian market’s stress meter. A reading below 10 signals strong investor confidence, 10 to 20 is business as usual, and anything above 20 suggests uncertainty is starting to take hold. With the latest reading, it’s safe to say uncertainty has definitely settled into the Canadian market.

US Economic news

This past week’s key data points that the Federal Reserve (Fed) considers when deciding whether to raise or lower the interest rate.

Federal Open market Committee minutes

This week, the Federal Reserve released minutes from its Federal Open Market Committee (FOMC) meeting on March 18–19, offering a look at what policymakers were thinking and giving us a better sense of where interest rates might be headed – and how they’re viewing the economy.

The minutes revealed the reasoning behind the Fed’s decision to keep its target interest rate range steady at 4.25% to 4.50%. That move was driven by a mix of solid economic activity, low unemployment, and still-elevated inflation. But the minutes also flagged a key source of new uncertainty: US tariffs and their potential ripple effects on inflation and growth.

The Fed now expects GDP growth to slow to 1.7% in 2025, down from its 2.1% estimate back in December. Unemployment is expected to stay around 4.4%, and inflation is still projected to gradually move toward the 2% target – though tariffs could muddy that path by raising prices and slowing trade.

In short, the Fed is walking a tightrope. They’re trying to cool inflation without slamming the brakes on growth or triggering a surge in unemployment. That’s why they’re holding rates steady and taking a cautious, wait-and-see approach. They want time to assess the impact of tariffs and other risks before making any moves.

Bottom line: No rate cuts just yet, but no surprises either. The Fed’s keeping its options open, waiting to see how things play out. If inflation continues to ease and the economy stays on steady footing, cuts could still be in the cards later this year. In the meantime, growing concerns about a tariff-fuelled slowdown have many betting the Fed will need to step in before too long.

Consumer price Index (CPI)

Inflation finally gave us a bit of breathing room. The March CPI report showed that prices cooled more than expected, offering some welcome relief to both consumers and investors. Headline inflation – which includes all components – fell 0.1% for the month, following a 0.2% increase in February. Analysts had been expecting a modest 0.1% rise. On a yearly basis, inflation slowed to 2.4%, down from 2.8% and below the forecasted 2.6%. That’s the lowest annual rate since September 2024.

Some of the biggest monthly shifts came at the gas pump and in home energy. Gasoline prices plunged 6.3%, helping to ease overall inflation. Compared to last year, gas is now down 9.8%. Meanwhile, ‘Utility gas services’ – used to heat homes – rose 3.6% in March and are up 9.4% year-over-year.

Housing costs, one of the stickier components of inflation, also continued to cool. Shelter rose 0.2% for the month, down from 0.3% in February. On a yearly basis, shelter inflation eased to 4.0%, from 4.2% the month before.

Core CPI – which strips out the more volatile food and energy categories and is often seen as a better gauge of underlying inflation – also came in softer than expected. It rose just 0.1% in March, half the pace analysts had predicted, and eased to 2.8% year-over-year, down from 3.1% in February. It’s another encouraging sign for the Fed as it tries to bring inflation closer to its 2% target without slowing the economy too much.

Still, the road ahead isn’t without bumps. While this report shows clear progress, it reflects price trends before the latest tariffs were introduced – so it’s looking backward, not forward. The 10% tariffs already in place could add upward pressure in the months ahead, especially once the current 90-day pause on higher tariffs expires. For now, though, this is a win in the inflation fight.

Consumer Sentiment Index (CSI)

The University of Michigan’s preliminary CSI for April 2025 dropped sharply to 50.8 – its lowest level since June 2022 – down from 57.0 in March and well below economists’ expectations of 54.5. That’s a 10.9% decline from last month and a massive 34.2% drop from April 2024, when the index stood at 77.2.

The Current Economic Conditions index slid 11.4% to 56.5, down from 63.8 in March and 28.5% lower than April 2024’s reading of 79.0, reflecting rising concerns about personal finances and the broader economic outlook. Meanwhile, the Index of Consumer Expectations fell 10.3% to 47.2, down from 52.6 last month and nearly 38% lower year-over-year – highlighting deepening pessimism about the future.

Inflation expectations are also back in the spotlight. Consumers now expect prices to rise 6.7% over the next year, up from 4.9% in March – the highest level since 1981. The five-year inflation outlook also ticked up to 4.4% from 4.1%.

The report pointed to rising trade tensions – especially the surge in tariffs between the US and China – as a major driver of the souring mood. With consumers increasingly worried about business conditions, personal finances, and the job market, talk of a potential recession is gaining momentum. It seems consumers are now on the same page as investors – tariffs are expected to leave lasting damage on the economy.

American market volatility

The CBOE Volatility Index (VIX), often called the market’s “fear gauge,” opened the week at a sky-high 60.13, reflecting extreme investor anxiety as the second week of President Trump’s global tariff war kicked off. The VIX gradually eased into the 40s, but spiked back into the mid-50s on Wednesday when the US raised tariffs on China to 104%. However, after the announcement of a 90-day suspension of reciprocal tariffs on most US trading partners, the index dropped back below 40. It stayed near the 40-point mark for the rest of the week, with a few temporary jumps above 50, before dipping into the 30s and closing the week at 37.56.

For those new to the VIX, think of it as the stock market’s stress meter. A reading below 12 signals calm waters, 12 to 20 reflects normal market swings, and anything above 20 suggests rising uncertainty. With the VIX staying above 30 for another week, it’s clear the markets remain on edge.


Weekly Market and Portfolio Review

For the week, the TSX (SPTSX) added 1.7%, the S&P 500 (SPX) jumped 5.7%, the DJIA (INDU) gained 5.0% and the Nasdaq (CCMP) surged 7.3%.

 
Index Weekly Streak
TSX: 1 – week winning streak
S&P: 1 – week winning streak
DJIA: 1 – week winning streak
Nasdaq: 1 – week winning streak

Bull market. A good week for the North American stock markets. The markets took a wild ride this past week, as seen in the weekly progress chart above, as escalating trade tensions sent shockwaves through global markets and whipsawed the four indexes. Despite a brutal start, the S&P and DJIA logged their best weeks since 2023, while the Nasdaq notched its strongest since 2022.

The S&P stumbled out of the gate, dropping below 5,000 for the first time in nearly a year. It was the steepest four-day slide since the index’s inception in the 1950s, pushing it into bear market territory – down more than 20% from its record high. All three major US indexes fell to their lowest levels in over a year, rattled by growing fears of an economic slowdown and inflation creeping into North America, fuelled by an intensifying tariff battle.

Wednesday morning brought a glimmer of hope with rumours of a possible delay in US tariffs. But that optimism quickly vanished after the US raised tariffs on Chinese imports to 125%, and China fired back with its own hikes. Then, a surprise twist: the US paused most reciprocal tariffs for 90 days and replaced them with a flat 10% rate. Markets surged on the news, delivering one of the strongest one-day rallies in decades. The S&P jumped 9.5% – its best day since the 2006 financial crisis. The Nasdaq soared 12.2%, its second-best day ever, while the more conservative DJIA climbed 7.8%.

But the rally didn’t last. The very next day, the US hiked tariffs on China again – this time to 145% – turning up the heat in what’s starting to look like a full-blown trade war between the world’s two largest economies.

Even a better-than-expected inflation report on Thursday wasn’t enough to calm investor nerves. With most tariffs still in place and the 90-day pause looking more like a breather than a breakthrough, uncertainty only increased.

On Friday, markets flipped once more – boosted by strong first-quarter earnings from a few major US banks – and ended higher to cap off a chaotic week. This came despite China hiking tariffs on US imports to 125% and consumer sentiment falling to its lowest level since June 2022, when markets were last in correction territory. The late-week rally nudged the indexes into the green – a bit of a surprise, given how the week began.

Back in January, analysts were expecting the American economy to grow 2%. Now, many are warning a recession could be looming. With corporate earnings likely to take a hit from prolonged trade disruptions, the risk of a broader economic pullback is rising. And when selloffs like this start to snowball, they can tip economies into recessions that take years to recover from.

In Canada, markets mirrored their American counterparts. The TSX surged 5.4% on Wednesday during the global rally, dropped 3.0% the next day, then bounced back 2.5% on Friday – ending the week slightly higher.

Economically, cracks are beginning to show. After two months of tariff threats, Canada shed 33,000 jobs in March – the worst jobs report in over three years – and that’s before the full impact of US tariffs kicked in. With prices set to rise as the trade war escalates, the BoC is now in a tough spot: trying to tame inflation while also supporting an economy starting to take hits.

While billionaires will likely emerge unscathed, everyday consumers – like us – might not be so lucky. A prolonged slowdown could bring job losses, stagnant wages, and shrinking purchasing power. With the road ahead still murky, this kind of market volatility is bound to ripple through the broader economy for some time. And after the week we’ve just had, it might only take a single tweet to flip the script all over again. 😊

Portfolio Weekly Streak
Portfolio 1: 1 – week winning streak
Portfolio 2: 3 – week losing streak
Portfolio 3: 1 – week winning streak

Bull market. A good week for the North American stock markets. I’ve got to admit – at the start of the week, I was fully expecting to be seeing red across all three portfolios. By the end of Thursday, it could’ve gone either way, with the markets getting whipsawed around by trade tensions and volatility. But thanks to the big rally on Friday, two of the three portfolios ended the week with gains, while the third fell just short of positive territory, as you can see in the chart below. A surge in tech stocks – especially the heavyweight technology companies – gave things a serious boost.

Portfolio 1 came out on top with a 7.1% gain for the week. It was a huge turnaround: last week, only 6% of the holdings managed to post a gain, while this week, 79% finished in the green. Big winners included CrowdStrike (NASD: CRWD) and Nvidia (NASD: NVDA), both up 25%, Celestica (TSE: CLS) up 24%, Sea Limited (NYSE: SE) and Lattice Semiconductor (NASD: LSCC) both up 17%, Cloudflare (NYSE: NET) up 16%, and Walmart (NYSE: WMT) up 15%. Grab Holdings (NASD: GRAB) and Shopify (TSE: SHOP) each climbed 14%, while Amazon (NASD: AMZN) and Magnite (NASD: MGNI) added 13%, Apple (NASD: AAPL) rose 11%, and Alphabet (NASD: GOOGL) rounded things out with a 10% gain.

Portfolio 2 fell just short, slipping 0.4%. Honestly, with 82% of the holdings posting gains, I expected it to end in the green. It felt odd, so I double-checked – but unfortunately, a few of those gainers only edged up by a penny or two or were very small positions. The drops in the oil stocks ended up outweighing the gains in tech. Top performers included Guardant Health (NASD: GH) up 13%, Birkenstock (NYSE: BIRK) up 12%, and Take-Two Interactive (NASD: TTWO), Airbnb (NASD: ABNB), and MongoDB (NASD: MDB) each up 11%. Microsoft (NASD: MSFT) also pitched in with a 10% gain.

Portfolio 3 was the Goldilocks pick this week – right in the middle of the pack with a 3.9% weekly gain. It also saw the highest percentage of winners, with 91% of holdings ending the week in the green. Standouts included Vertiv Holdings (NYSE: VRT) up 27%, Adyen NV (OTCM: ADYEY) up 17%, Cloudflare up 16%, Evolution AB (OTCM: EVVTY) up 15%, Shopify up 14%, Magnite up 13%, and both goeasy (TSE: GSY) and Microsoft up 10%.

After the past few rocky weeks, it’s nice to see the portfolios back on the winning side. Not a bad week at all! 😊

Weekly Portfolio & Index performance
Weekly Portfolio & Index performance for the week ended April 11, 2025.

Companies on the Radar

Stocks on my Radar With the implementation of tariffs on all of America’s trading partners – even some penguins on an island off Antarctica – and counter-tariffs flying back in return, markets have been cratering, and I haven’t exactly had the time (or appetite) to scout for new companies to invest in. I’ve mostly been in a holding pattern, watching to see if any of the stocks I already own have dropped far enough to start looking like a deal.

When that happens, my first move is to figure out whether the selloff is tied to the actual business or just overall market sentiment. If it’s the latter – if the company has limited tariff exposure and is just caught up in the broader panic – it goes straight to the top of my watchlist. Think of it as the market throwing the baby out with the bathwater.

From there, I do one last check: does the stock offer a solid dividend (ideally 3%+)? If it does, that income stream helps cushion the ride and takes some of the sting out of short-term volatility. Dividend stocks can also reduce overall portfolio risk and add a bit of stability – especially when markets are in one of their moods.

For now, my radar list still includes these six companies:

  • Barrick Gold Corporation (TSE: ABX): A large-cap Canadian company that is one of the world’s largest gold and copper miners, with operations across the globe. A go-to for gold exposure.
  • Brookfield Corporation (TSE: BN): A large-cap Canadian heavyweight in alternative asset management and real estate investing. Big, diversified, and built for the long haul.
  • Dollarama (TSE: DOL): A growing large-cap Canadian discount retailer that’s also expanding into South America. With a recession expected in Canada, discount retailers are seeing an increase in business.
  • goeasy Ltd.: A mid-cap Canadian company offering non-prime leasing and lending services. Higher risk, but high potential if they manage credit cycles well.
  • iA Financial Corporation (TSE: IAG): A large-cap Canadian financial services firm with a solid insurance business in both Canada and the US. Steady and reliable.
  • LPL Financial Holdings Inc. (NASD: LPLA): A large-cap US firm providing a brokerage and advisory platform for independent financial advisors. Benefiting from long-term trends in wealth management.

As always, these are not buy recommendations – be sure to do your own research and make decisions that align with your personal financial goals!

The Radar Check was last updated April 11, 2025.

Stock on the Radar List. 1 of 2.
Stock on the Radar List. 2 of 2.


That’s a wrap for this week—see you next time! Happy investing!


Monthly Portfolio Update March 2025

Monthly Market and Portfolio Review

Bearish market March was a turbulent month for the markets, with both Canadian and US stocks experiencing sharp swings. The S&P 500 (S&P) and the Nasdaq Composite (Nasdaq) had their worst month since December 2022, tumbling 5.8% and 8.2%, respectively. The Dow Jones Industrial Average (DJIA) didn’t fare much better, dropping 4.2%, while the Toronto Stock Exchange Composite Index (TSX) was the best of a bad lot, falling ‘only’ 1.9%. The main culprit? President Donald Trump rolled out a wave of new tariffs, reigniting fears of a global trade war that could stifle economic growth and drive inflation higher.

Investors grew increasingly uneasy about economic slowdowns in both countries, particularly in Canada. Adding to the uncertainty, Trump’s on-again, off-again approach to tariffs – targeting Canada, China, Mexico, and the European Union – along with the threat of retaliatory measures from these trading partners, kept markets on edge. To make matters worse, several companies pointed to tariff uncertainty as a key reason for lowering their earnings forecasts for the coming quarters.

The back-and-forth on trade policy created widespread instability. Trump’s announcement of reciprocal tariffs cast doubt on global trade agreements, putting key sectors like automotive and aluminum in the crosshairs. Businesses and households rushed to make purchases ahead of tariff hikes, adding to inflationary pressures. But beyond the tariffs themselves, the bigger concern for investors has been the unpredictability – when policy shifts are this erratic, many hesitate to commit capital to the markets (like me). Another casualty of the tariff wars? Consumer confidence and sentiment, both of which came in well below expectations. With rising fears over inflation and job security, consumers may start tightening their wallets – bad news for businesses across multiple sectors.

Inflation worries also took centre stage. Tariff-driven price increases fueled stagflation concerns, pushing long-term inflation expectations higher. Investors are increasingly worried that tariffs could disrupt supply chains, dampen investment, and drive inflation even higher – risks that could put a dent in global economic growth.

One bright – dare I say, shiny 😊 – spot amid the turmoil was gold, which surged as investors flocked to safe-haven assets.

In Canada, markets fared better than their American counterparts, with losses softened by surging gold and oil prices. Meanwhile, Canadian merchandise exports hit record levels, fueled by strong US demand as businesses rushed to import goods before tariffs took effect in April.

March’s downturn marked the first back-to-back monthly decline since the two-month slump that ended in October 2023. Here’s hoping April turns things around – though with trade tensions flaring up, it won’t be an easy climb. Keep your fingers crossed. 😊

The chart below captures just how tough March was for the markets. The TSX held up the best, slipping 1.9%, while the S&P dropped 5.8% and the DJIA fell 4.2%. The Nasdaq took the biggest hit, plunging 8.2% as investors pulled back from high-growth stocks.

Portfolio Monthly Streak
Portfolio 1: 2 – month losing streak
Portfolio 2: 2 – month losing streak
Portfolio 3: 2 – month losing streak

Bearish market A tough month for the markets usually means a tough month for us investors, and for me, March was no exception – painful, as you can see in the chart below. But that’s just part of the market’s ebb and flow. I’d like to call this a buying opportunity, a chance to scoop up great companies at a discount… except I already did that in February, before the real drop. That said, I did grab some Canadian Natural Resources (TSE: CNQ) shares for the 5.4% dividend. Who knows what April has in store? 😊 For now, I’m staying on the sidelines and holding onto some cash.

Monthly Portfolio & Index performance
Monthly Portfolio & Index performance for March 2025.

What My Three Portfolios Did in March

Portfolio 1 for March 2025: DOWN Red Down Arrow

Activity

No significant activity to report this month.

Dividends Received this month:

Companies followed by DRIP (Dividend Re-Investment Plan) indicate additional shares were purchased with the dividend. Any cash leftover was added to the cash balance.

Canadian $

TMX Group Ltd (TSE: X)

Pulse Seismic (TSE: PSD) DRIP

Yellow Pages Ltd (TSE: Y)

Decisive Dividend Corporation (TSE: DE) DRIP

Dream Industrial Real Estate Investment Trust (TSE: DIR.UN) DRIP

Tourmaline Oil Corp (TSE: TOU)

Hammond Power Solutions (TSE: HPS.A)

Canadian National Railway (TSE: CNR)

US $

Visa Inc. (NYSE: V)

Alphabet Inc (NASD: GOOGL)

BSR Real Estate Investment Trust (TSE: HOM.U)

Skyworks Solutions Inc (NASD: SWKS)

Home Depot (NYSE: HD)

Quarterly Reports

Sea Limited

Fourth quarter 2024 financial results on March 4, 2025

CrowdStrike Holdings, Inc.

Fourth quarter 2025 financial results on March 4, 2025

Tourmaline Oil Corp

Fourth quarter 2024 financial results on March 5, 2025

Costco Wholesale Corporation

Second quarter 2025 financial results on March 6, 2025

Decisive Dividend Corporation

Fourth quarter 2024 financial results on March 19, 2025

Hammond Power Solutions Inc.

Fourth quarter 2024 financial results on March 20, 2025

Carnival Corp & plc

First quarter 2025 financial results on March 21, 2025

Portfolio 2 for March 2025: DOWN Red Down Arrow

Activity

Bought: Canadian Natural Resources (TSE: CNQ), see March 21 Weekly Update.

Dividends Received this month:

Canadian $

Fortis (TSE: FTS)

Whitecap Resources Inc (TSE: WCP) DRIP

SmartCentres Real Estate Investment Trust (TSE: SRU.UN)

Dream Industrial Real Estate Investment Trust (TSE: DIR.UN) DRIP

iA Financial Corporation Inc (TSE: IAG)

Tourmaline Oil (TSE: TOU)

Hammond Power Solutions (TSE: HPS.A)

Brookfield Infrastructure Partners LP (TSE: BIP.UN)

Brookfield Infrastructure Corp (TSE: BIPC)

US $

Zoetis (NYSE: ZTS)

Microsoft (NASD: MSFT)

Quarterly Reports

Tourmaline Oil Corp

See report under Portfolio 1.

MongoDB, Inc.

Fourth quarter 2025 financial results on March 5, 2025

South Bow Corp.

Fourth quarter 2024 financial results on March 5, 2025

Canadian Natural Resources Limited

Fourth quarter 2024 financial results on March 6, 2025

Alimentation Couche-Tard Inc.

Third quarter 2025 financial results on March 18, 2025

Portfolio 3 for March 2025: DOWN Red Down Arrow

Activity

Sold: Telus International (TSE: TIXT), see March 21 Weekly Update.

Sold: Enghouse Systems (TSE: ENGH), see March 21 Weekly Update.

Sold: Lithium Argentina (TSE: LAR), see March 28 Weekly Update.

Dividends Received this month:

Canadian $

Royal Bank (TSE: RY)

SmartCentres Real Estate Investment Trust (TSE: SRU.UN) DRIP

Brookfield Wealth Solutions Ltd (TSE: BNT)

Brookfield Renewable Corp (TSE: BEPC)

Brookfield Asset Management (TSE: BAM)

US $

Microsoft (NASD: MSFT)

Vertiv holdings (NYSE: VRT)

Quarterly Reports

Enghouse Systems Limited

First quarter 2025 financial results on March 10, 2025

Alvopetro Energy Ltd.

Fourth quarter 2024 financial results on March 18, 2025