
Credit Ratings Explained: From the US Downgrade to Corporate Impact
Before the week even got started, markets got a bit of a jolt when credit ratings agency Moody’s downgraded the US credit rating from its highest level, Aaa, to one notch lower at Aa1 on Friday, May 16, 2025—after markets had already closed for the week. This was the first time in over a century the agency has lowered the US’s credit rating. Since the announcement came after the close, Monday was the first chance investors had to react.
This move also makes Moody’s the third and final major credit rating agency to downgrade the US from its top rating, following Fitch in 2023 and Standard & Poor’s back in 2011. It reflects growing concern over America’s rising government debt and the soaring cost of interest payments. According to Moody’s, the US now carries a much heavier debt load than countries still holding top-tier ratings. Only eleven nations currently retain Moody’s highest score – including Canada, Germany, and Australia. So this week, I thought we’d take a look at what credit ratings really mean – for countries, for companies, and for us as investors.
If you’re new to investing – or just not deep into high finance – credit ratings might sound like background noise. But they actually matter a lot. Moody’s is one of the world’s top credit rating agencies. Its job is to assess how financially healthy a country or company is—kind of like how a lender checks your credit score before offering a loan. A lower credit rating means higher borrowing costs – and more risk.
So how high is the US debt right now? As of April 2025, the federal budget deficit stands at US$1.05 trillion, and the national debt has reached $36.9 trillion—now slightly exceeding the country’s entire GDP. Interest payments on that debt have also ballooned, hitting $579 billion. When a country’s national debt exceeds its GDP, it means the government owes more than the total value of all goods and services the country produces in a year. In plain terms, the US has borrowed more than it earns.
So, what happens when the US gets downgraded? In short, borrowing gets more expensive. When a country’s credit rating drops, its cost of borrowing usually rises because it’s seen as a bigger risk. Creditors demand higher interest rates in return. We’re already seeing signs of this: American mortgage rates have ticked higher, and US Treasury yields briefly spiked. That could mean higher interest rates on everything from government debt to personal loans and credit cards. For American consumers, that means paying more to borrow. For us investors, it could slow the growth of the companies we own – especially if expansion becomes too costly.
While this sounds serious (and it is), investors didn’t panic. Stocks were shaky early Monday but bounced back by the end of the day. For now, markets seem to view Moody’s downgrade as confirmation of known issues – not a sudden shock.
Still, the downgrade could throw a wrench into President Trump’s economic plans, especially his efforts to extend tax cuts. Moody’s isn’t convinced those policies will meaningfully reduce the deficit. In fact, it projects US debt could rise even further – from just over 100% of GDP today to 134% by 2035 if current trends continue – raising the risk of more downgrades down the line.
While this week’s headlines were focused on the US government, credit ratings don’t stop at national borders. These same ratings also affect businesses – and that’s where the impact can start to show up in investor portfolios. Let’s take a closer look at how a company’s credit rating influences everything from borrowing costs to stock performance.
These same credit rating agencies also play a crucial role in the business world. Corporate credit ratings help investors, lenders, and the market understand how financially healthy a company is – and they can have a real impact on its ability to grow.
A company with a high credit rating (like Aaa or Aa1) is seen as stable and low risk, which means it can borrow money at lower interest rates. That makes it easier and cheaper to issue bonds or get loans to fund operations or expansion. On the flip side, a company with a lower rating – especially one below investment grade (Baa3 or lower) – is viewed as riskier. These companies often must pay much higher interest rates to borrow money, which can eat into profits or limit their strategic options.
Credit ratings also influence investor behaviour. Institutional investors like pension funds often stick to investment-grade bonds, so a strong rating can attract more capital. If a company gets downgraded to “junk” status, it can scare off some investors and force the company to offer higher yields to make their bonds attractive.
These ratings can even move stock prices. A downgrade might cause a company’s stock to drop as investors worry about rising borrowing costs or weaker financial footing. Meanwhile, an upgrade can do the opposite – boosting investor confidence and lifting share prices.
In short, strong credit ratings can open doors for companies to grow, invest, and compete. Weak ones can slam those doors shut.
Following Moody’s US downgrade, corporate bond markets saw slightly wider spreads – meaning investors asked for a bit more yield to take on the added risk. A few companies hit pause on issuing new bonds to see how things would settle. But overall, the response was pretty calm. Most investors seemed to have already priced in the risks.
So, with the Moody’s downgrade behind us and markets holding steady, let’s take a look at what else moved the needle this week.
Items that may only interest or educate me ….
Canadian Economic news, US Economic news, Buried in Debt, A nasty surprise ….
Canadian Economic news
This past week’s key economic data that the Bank of Canada (BoC) considers when deciding whether to raise or lower the interest rate.
Consumer Price Index (CPI)
Canada’s inflation rate cooled more than expected in April, giving consumers a bit of breathing room – and possibly giving the BoC something to think about ahead of its next rate decision. Statistics Canada reported that the CPI rose just 1.7% year-over-year, down from 2.3% in March and slightly above analysts’ forecasts of 1.6%. On a monthly basis, prices actually dipped by 0.1% in April, reversing a 0.3% increase the month before.
Much of that slowdown came from energy prices. Gasoline dropped a whopping 10.2% in April alone and was down 18.1% year-over-year. The removal of the consumer carbon tax helped push pump prices lower, while natural gas prices also slid 14.1%. On the other hand, the biggest monthly price gain came from the “household operations, furnishings and equipment” category, which rose 0.8%.
Despite the broad cooling, shelter is still the biggest inflation pressure. Prices related to housing – like rent and mortgage interest – climbed 3.8% over the past year, just slightly lower than March’s 3.9%.
Core inflation, which strips out more volatile items like food and energy to better reflect underlying price trends, rose 0.5% in April – up from 0.2% in March. On a yearly basis, the core rate ticked up to 2.6% from 2.4%. That increase was driven by higher grocery bills, more expensive travel tours, and rising vehicle prices.
April also marked the first month of US tariffs and Canada’s counter-tariffs, and some analysts suggest these trade measures may already be adding pressure to certain imported goods. The jump in core CPI could complicate the BoC’s next move. On one hand, the broader economy is clearly slowing, which opens the door for a rate cut. On the other, rising core inflation might give the BoC reason to hold off – at least for now.
Retail Sales
Canadian retail sales came in stronger than expected in March, with Statistics Canada reporting a 0.8% monthly increase – topping forecasts for a 0.7% gain and rebounding from February’s 0.4% drop. The uptick ends a two-month slide and points to resilience in consumer spending. On a yearly basis, sales were up 5.6%, an improvement from February’s 4.7% gain.
March’s growth was driven mostly by ‘Motor vehicle and parts dealers’, which jumped 4.8% – their first increase in three months. On the downside, ‘Gasoline stations and fuel vendors’ saw a steep 6.5% decline. Over the past year, the biggest gain came from ‘Miscellaneous store retailers,’ up 17.0%, while ‘Building material and garden equipment dealers’ posted the largest drop at 2.8%.
Core retail sales – which exclude vehicles, gas, and fuel – rose 0.2% in March. That’s slower than February’s 0.5% but better than the flat reading economists expected. Year-over-year, core sales surged 5.5%, beating the forecasted 3% gain.
Altogether, the March report shows consumer spending is holding up. Some of that strength likely came from Canadians rushing to buy vehicles before April tariffs hit, along with stockpiling of non-discretionary items. Still, outside those areas, the broader retail picture remains somewhat uncertain, especially with ongoing trade tensions clouding the outlook.
Looking ahead, Statistics Canada’s early estimate calls for a 0.5% gain in April retail sales, suggesting the momentum may continue. Whether it lasts will depend on wage growth, inflation trends, consumer confidence, and how tariffs affect prices.
Canadian market volatility
Canada’s market mood ring – the S&P/TSX 60 Volatility Index (VIXC) – kicked off the holiday shortened week at 14.73 and mostly stayed within a range of 11–15. Midweek, it briefly spiked to 17.49 as investors grew jittery over the potential for US debt to balloon even further. The surge didn’t last long though – calmer heads prevailed, and the VIXC drifted back down, ending Friday at 13.74. Still, some nerves lingered as investors weighed the chances of future rate hikes or unexpected policy moves.
For those unfamiliar with the VIXC, it’s essentially Canada’s version of a fear gauge. Readings under 10 show strong investor confidence, 10–20 is business as usual, and anything above 20 suggests investors are getting uneasy.
US Economic news
This past week’s key data points that the Federal Reserve (Fed) considers when deciding whether to raise or lower the interest rate.
American market volatility
Wall Street’s “fear gauge,” the CBOE Volatility Index (VIX), began the week on a calm note at 17.27 – comfortably within its typical 12–20 range and slightly lower than last week’s close. But the calm didn’t last. The VIX hovered near 18 midweek before spiking above 20 and finishing at 22.35.
The jump in volatility came as markets reacted to two major headlines: the House passed Trump’s new spending bill, and he threatened to impose 50% tariffs on the European Union. The combination of surging US debt – now at approximately US$37 trillion – and renewed trade tensions was enough to push the VIX above 20, as investors grappled with rising uncertainty on multiple fronts.
For anyone new to the VIX: it’s basically Wall Street’s stress meter. Below 12 signals calm waters, 12–20 is the normal range, and anything above 20 signals stormy seas.
Buried in Debt: What the $37T Debt Means for Investors
This past week, the US House of Representatives narrowly passed President Trump’s “big, beautiful bill,” which bundles many of his key policy goals. It now moves to the Senate, and if approved, heads to the President’s desk to be signed into law. While the bill promises major tax cuts, it could also add trillions to America’s already massive US$37 trillion national debt. And right now, that debt is what’s weighing on markets.
A $37 trillion debt load isn’t just a big number – it has real economic consequences. The government has to pay interest on all that debt, and those payments are climbing fast. Today, around 18% of federal revenue goes toward interest. If current trends hold, that could jump to nearly 30% by 2035 – leaving less room for spending on infrastructure, health care, or education.
That rising burden is setting off alarm bells. Moody’s recently downgraded the US credit outlook, following earlier moves by S&P and Fitch. And bond markets are reacting: Treasury yields are rising as investors demand higher returns for lending money to a more indebted government. That puts added pressure on the stock market – especially interest-rate-sensitive sectors like technology.
So what does all this mean for us investors? Higher debt levels can lead to more market volatility, elevated interest rates, and tighter government spending. It also reduces the government’s flexibility to support the economy during downturns. For long-term investors, it’s a reminder to keep an eye on the broader fiscal picture – not just company earnings or stock prices.
With the debt projected to exceed 107% of GDP by 2029, some economists worry it could eventually slow economic growth. And if the US ever resorts to printing more money to cover its obligations, that could trigger inflation and chip away at consumers buying power.
Bottom line: the US can still manage its debt for now, but the risks are rising – and they’re worth keeping on your investing radar.
A nasty surprise for Canadian Investors
Tucked inside the ‘big, beautiful’ US spending bill is a nasty surprise for Canadian investors: Section 899. This little-known provision could have a big impact on Canadians earning income from US investments. If enacted, it would override the Canada – US tax treaty and gradually ramp up withholding taxes on Canadian residents.
Right now, Canadian companies pay just 5% on dividends from US subsidiaries – but that would rise by five percentage points a year until it hits 50%. Individual investors wouldn’t be spared either: the current 15% tax on US dividends could also climb to 50%.
If this goes through, it could reshape cross-border investing and sharply raise the cost of owning US assets for Canadians.
Weekly Market and Portfolio Review
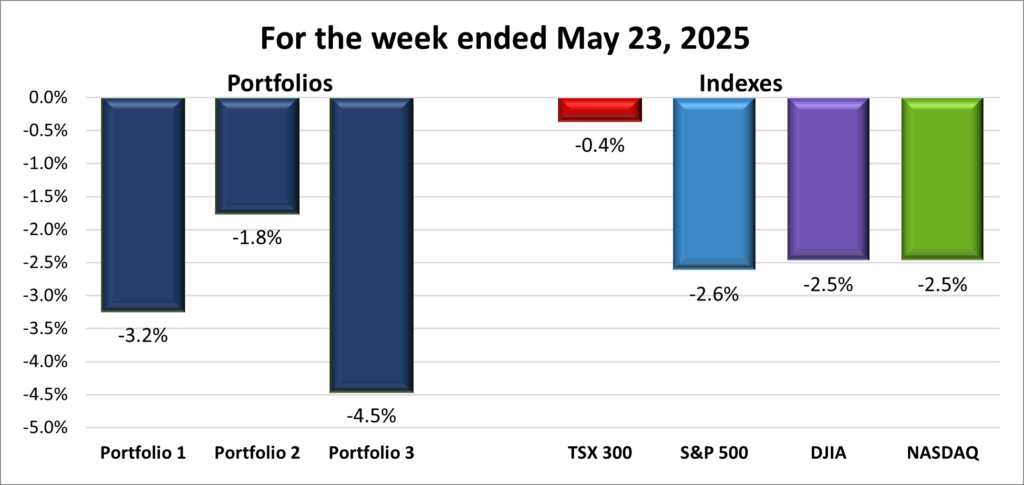
For the week, the TSX (SPTSX) slipped 0.4%, the S&P 500 (SPX) fell 2.6%, the DJIA (INDU) lost 2.5% and the Nasdaq (CCMP) dropped 2.5%.
| Index | Weekly Streak |
| TSX: | 1 – week losing streak |
| S&P: | 1 – week losing streak |
| DJIA: | 1 – week losing streak |
| Nasdaq: | 1 – week losing streak |
![]() After a strong showing the week before, I was hoping the four major North American indexes – the Toronto Stock Exchange Composite Index (TSX), the S&P 500 (S&P), the Dow Jones Industrial Average (DJIA), and the Nasdaq Composite – could keep the momentum going. But no such luck. All four slipped into the red by midweek and continued to drift lower (see the weekly progress chart above), with the three US indexes each falling more than 2.5%, while the TSX snapped its six-week winning streak.
After a strong showing the week before, I was hoping the four major North American indexes – the Toronto Stock Exchange Composite Index (TSX), the S&P 500 (S&P), the Dow Jones Industrial Average (DJIA), and the Nasdaq Composite – could keep the momentum going. But no such luck. All four slipped into the red by midweek and continued to drift lower (see the weekly progress chart above), with the three US indexes each falling more than 2.5%, while the TSX snapped its six-week winning streak.
The week began quietly, with Canadian markets closed for Victoria Day. US trading was flat on Monday as investors digested Friday’s downgrade of US creditworthiness by Moody’s – a headline that was largely brushed off at first.
But “flat” turned out to be the high point. By Tuesday, markets came under pressure, breaking the S&P’s six-day winning streak and pulling all four indexes into negative territory.
Right now, the biggest thing driving markets is uncertainty – specifically around tariffs and ballooning US government debt.
Investor sentiment soured as attention turned to President Trump’s proposed ‘big, beautiful’ spending bill, which includes tax cuts and spending that could add US$3–5 trillion to an already massive US$36.2 trillion federal debt. That triggered fresh concerns about deficits and rising interest rates, pushing up government bond yields and weighing on both US and Canadian markets. Higher bond yields are particularly tough on growth stocks, especially technology stocks, since future profits start to look less attractive compared to safer returns from bonds.
Trade tensions didn’t help either. The US warned companies against using Chinese artificial intelligence (AI) chips, reviving fears of a tech showdown with China. Then on Friday, just before the Memorial Day long weekend, Trump cranked things up again with a threat to slap 50% tariffs on the European Union, accusing them of dragging their feet on trade. He also floated a 25% tariff on Apple and other smartphone makers that don’t manufacture them in the US. The barrage of headlines rattled markets and snuffed out any hopes of a late-minute rebound.
One bright spot: President Trump signed executive orders directing the independent Nuclear Regulatory Commission to streamline regulations and fast-track approvals for new reactors and power plants. The move lit a fire under nuclear stocks, sending them sharply higher – including Portfolio 1’s Cameco (TSE: CCO), one of the largest uranium producers in North America and around the world.
Meanwhile in Canada, inflation data delivered mixed signals – headline inflation cooled, but core inflation ticked higher. That complicates things for the BoC. Slower economic growth might argue for a rate cut, but rising core inflation gives policymakers reason to hesitate. Even so, the TSX managed to notch a 10-day winning streak and hit a fresh record high – before slipping into the red.
Tariff uncertainty is also weighing on Canada’s economic outlook. BoC Governor Tiff Macklem warned that if trade tensions aren’t resolved soon, both consumer spending and business investment could slow. The bank now expects second-quarter growth to be “quite a bit weaker” than the first – and possibly worse in the months ahead if uncertainty drags on.
All in all, it was a choppy, headline-driven week, with debt, interest rates, and trade tensions all jostling for investor attention. It’s a clear reminder of just how sensitive markets still are to political noise and shifting policy winds.
| Portfolio | Weekly Streak |
| Portfolio 1: | 1 – week losing streak |
| Portfolio 2: | 1 – week losing streak |
| Portfolio 3: | 1 – week losing streak |
![]() Another rough week in the markets meant another rough ride for my three portfolios. The only question was just how rough. As you’ll see in the weekly performance chart below, two of the three portfolios ended up faring worse than the S&P 500 – which posted the steepest drop among the indexes.
Another rough week in the markets meant another rough ride for my three portfolios. The only question was just how rough. As you’ll see in the weekly performance chart below, two of the three portfolios ended up faring worse than the S&P 500 – which posted the steepest drop among the indexes.
Portfolio 1 dropped 3.2%, weighed down by a wave of red – only 38% of the holdings managed to post a gain (unfortunately this was the best percentage of the portfolios). There were a couple of bright spots: Navitas Semiconductor (NASD: NVTS) surged 21% after announcing a partnership with Nvidia (NASD: NVDA) to develop next-gen AI data centres using Navitas’s gallium-based power supply unit chips. Cameco also jumped 12%, lifted by President Trump’s push to fast-track nuclear energy development. But those wins weren’t enough to offset steep losses elsewhere, like indie Semiconductor (NASD: INDI) falling 11% and Shopify (TSE: SHOP) shedding 10%.
Portfolio 2 held up the best – relatively speaking – losing just 1.8%. There were no standout winners, but also no major collapses. Only about a third of the holdings finished in the green, making it more of a “least-bad” kind of week.
Portfolio 3 had the toughest time, tumbling 4.5% with just 28% of its holdings posting gains. Like Portfolio 1, it also took a hit from Shopify’s 10% slide – but unlike Portfolio 1, there wasn’t a breakout winner to help cushion the fall.
Looking ahead, Nvidia reports their first quarter earnings next week, and all eyes will be on how the AI powerhouse is performing. With so many companies (including a few in my portfolios) riding the AI wave, a strong showing from Nvidia could help shift investor sentiment and inject some much-needed energy back into the markets. Here’s hoping it’s the spark that kicks off a rebound. 😊
Companies on the Radar
 There was a fair bit of turnover on my radar list this week. I’ve removed LPL Financial Holdings Inc. (NASD: LPLA) and Kinsale Capital Group (NYSE: KNSL). Both are solid US players in wealth management and insurance, but with Canadian equivalents available, I’d rather avoid the added currency risk.
Joining the list are three interesting names:
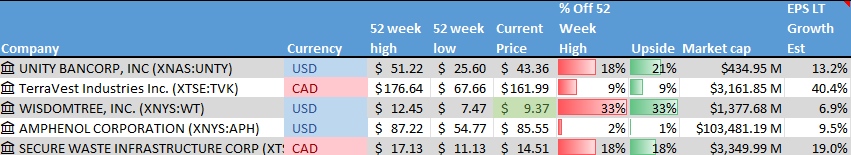
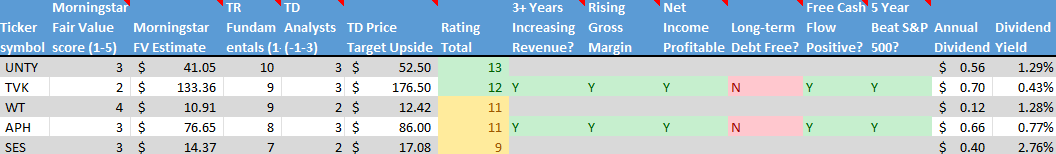
- Unity Bancorp (NASD: UNTY) is a small-cap regional bank based in the US, serving parts of New Jersey and Pennsylvania. It’s showing strong fundamentals, including solid revenue growth, efficient capital use, and double-digit earnings expansion. EPS is expected to climb nearly 13% this year – matching industry averages – and it has a steady history of dividend increases.
- WisdomTree (NYSE: WT) is another small-cap US financial company, known for its innovation in exchange-traded products, digital assets, and investment solutions. It’s a niche player with global reach in the evolving ETF and digital finance space.
- Secure Energy Services (TSE: SES) brings a Canadian flavour to the group. It’s a mid-cap industrial company focused on waste management and energy infrastructure. They serve clients across North America with recycling, disposal, and environmental solutions – a solid pick in the sustainability and infrastructure space.
Rounding out the radar list are two holdovers from the previous week:
- TerraVest Industries (TSE: TVK) is a Canadian mid-cap industrial company that manufactures equipment for the energy, agriculture, and transportation sectors across North America. Its product lineup includes propane tanks, specialized tanks used to store and transport ammonia gas commonly used as fertilizer (anhydrous ammonia vessels), natural gas liquids transport vehicles, and a range of energy processing equipment.
- Amphenol Corporation (NYSE: APH), a global giant in the connector and cable game, supporting a wide range of industries with electrical, electronic, and fiber optic solutions.
As always, these are not buy recommendations – be sure to do your own research and make decisions that align with your personal financial goals!
The Radar Check was last updated May 23, 2025.
That’s a wrap for this week, thanks for reading – may your portfolio stay green and your dividends steady. See you next time!