
Sell in May or Stay and Invest?
I originally intended to talk about this lighter topic – an old investing phrase that tends to pop up around this time of year: “Sell in May and go away” the previous week, but Warren Buffet stepping down from Chief Executive Officer of Berkshire Hathaway (NYSE: BRK.B) after 60 years at the helm kind of stole the lead. So this week, let’s talk a look at the story behind this phrase.
The phrase suggests that investors should sell their stocks in May and stay out of the market until around November. It traces back centuries to London’s financial scene, where traders would traditionally step away from the markets during the slower summer months and return after the St. Leger horse race in September.
The St. Leger Stakes, held in mid-September, marks the final leg of the English Triple Crown and has long been tied to the transition from summer to autumn. While it doesn’t officially end the summer season, it became a cultural cue for wealthy investors and traders in London’s financial district to return to the markets. That led to the fuller version of the phrase: “Sell in May and go away, come back on St. Leger’s Day.”
There’s some historical data backing the idea – stock returns from May to October have, on average, been weaker than those from November to April. But, like many seasonal trends, this one isn’t consistent. Some years, markets perform just fine – or even strongly – over the summer, which can make a strict “sell and sit out” approach backfire. That’s why many analysts lean toward a long-term, stay-invested strategy.
So, does this old pattern still matter today? While the historical trend is interesting, markets today are influenced by a much wider mix of factors – economic data, interest rate policy, geopolitics, and more. This year, some experts think “Sell in May” could end up being relevant again, especially with ongoing economic uncertainty, heightened volatility, and a growing ‘risk-off’ mood. Others argue that in a world where policy seems driven by social media posts, seasonal patterns like this one don’t carry the same weight. In the end, it’s less about what month it is and more about your investing approach, your timeline, and your ability to stay focused through short-term ups and downs.
For me, I’m keeping my eye on the markets and looking for opportunities to invest in some of my favourite companies if they should go on ‘sale’ again. 😊 In the meantime, let’s take a look at what moved the markets this past week….
Items that may only interest or educate me ….
Canadian Economic news, US Economic news, ….
Canadian Economic news
This past week’s key economic data that the Bank of Canada (BoC) considers when deciding whether to raise or lower the interest rate.
Canadian market volatility
Canada’s volatility gauge – the S&P/TSX 60 VIX (VIXC) – kept drifting lower last week, starting at 16.72 and slipping to 14.10 by Friday’s close. This slow and steady decline reflects easing worries over US tariffs and stronger-than-expected corporate earnings, which encouraged investors to lean back into riskier assets. The drop points to growing confidence in the economic outlook and improving market stability.
For those unfamiliar with the VIXC, it’s essentially Canada’s version of a fear gauge. Readings under 10 show strong investor confidence, 10–20 is business as usual, and anything above 20 suggests investors are getting uneasy.
US Economic news
This past week’s key data points that the Federal Reserve (Fed) considers when deciding whether to raise or lower the interest rate.
Consumer Price Index (CPI)
US inflation cooled more than expected in April, giving investors another reason to cheer. The CPI rose 0.2% for the month, just below forecasts of 0.3%, and up from a 0.1% decline in March. On an annual basis, inflation slowed to 2.3%, its lowest level since February 2021, and softer than the 2.4% pace expected by analysts.
Looking at the details, the biggest monthly jump came from ‘Utility gas services’ – used to heat homes – which surged 3.7% in April and is now up 15.7% over the past year. On the flip side, ‘Fuel oil’ dropped 1.3% in April, while ‘Gasoline (all types)’ plunged 11.8%, offering some relief at the pump and helping to ease overall inflation.
Shelter costs, which include rent and mortgages, continued to be a key driver, rising 0.3% in April after a 0.2% increase in March. Annually, shelter inflation remained at 4.0%, unchanged from the prior month.
Core CPI, which strips out food and energy, edged up 0.2% on the month, a touch higher than March’s 0.1% but below expectations of 0.3%. Year-over-year, core inflation remained stuck at 2.8%, unchanged from March.
While this latest report was good news, it’s still too soon to know how President Trump’s trade policies will ultimately affect prices. Interestingly, some analysts believe Trump-era tariffs may be temporarily damping price pressures by cooling global demand, though they warn that cost pressures could resurface this summer as companies start passing higher import costs onto consumers. The Fed is expected to maintain its wait-and-see approach for now, despite headline inflation – covering all items – slowing to 2.3%. Core inflation, which is closely watched by the Fed, held steady at 2.8% for a second month, reinforcing the central bank’s cautious stance. While the softer headline reading has fueled talk of potential rate cuts later this year, Chair Jerome Powell has made it clear the Fed is in no rush, preferring to monitor inflation trends over the coming months.
Retail Sales
US retail sales slowed sharply in April, with the Commerce Department’s advance estimate showing a modest 0.1% increase. That was slightly better than analysts’ expectations for flat sales but a big step down from March’s 1.7% surge, when consumers rushed to beat looming tariffs. Year over year, sales rose 5.2%, up from 4.6% in March.
Looking at retail sales excluding autos, vehicle parts, and gas stations – a category often seen as a cleaner read on consumer spending – sales rose 0.2% in April, following a 0.8% jump in March. Year over year, these sales climbed 5.4%, up from 4.5%. March’s surge in this category helped inflate the annual growth rate, but as spending normalizes, the monthly pace has slowed, setting the stage for further moderation if this trend continues.
Overall, the data suggest many shoppers front-loaded spending in March to get ahead of new tariffs, leaving April looking more subdued. With tariff uncertainty, inflation concerns, and higher prices starting to bite, consumers appear to be turning more cautious. April’s softer reading may be an early sign of a broader slowdown in spending as the effects of front-loading fade and the ripple effects of tariffs work through the economy.
Consumer Sentiment Index (CSI)
The University of Michigan’s preliminary CSI for May shows sentiment is still sliding, with potential ripple effects for the economy. The index fell to 50.8 from 52.2 in April, missing analyst expectations of 53.4. That’s a 2.7% dip from last month and a sharp 26.5% drop compared to May 2024, when the CSI stood at 69.1. This marks the fifth straight month of declines, though the pace of deterioration has slowed a bit.
A key driver behind the lower sentiment is rising inflation expectations. Consumers now expect prices to climb 7.3% over the next year, up from 6.5% in April. The longer-term five-year inflation outlook also inched up to 4.6% from 4.4%.
Digging deeper, the Current Economic Conditions index dropped 3.7% to 57.6, reflecting mounting concerns about personal finances and the broader economy. That’s a 17% decline from a year ago. The Index of Consumer Expectations also slipped to 46.5 from 47.3, down a hefty 32% year-over-year, pointing to deepening pessimism about the future.
Since January, overall consumer sentiment has tumbled nearly 30%, highlighting growing worries that could weigh on spending and investment. Trade policy uncertainty stands out as a major pain point, with nearly three-quarters of respondents citing tariffs as a key concern – a clear sign these fears are now front and centre for consumers.
American market volatility
After several weeks of the CBOE Volatility Index (VIX) – Wall Street’s famous “fear gauge” – starting above 20 amid rising investor anxiety, it was a relief to see it open the week at 19.84, finally slipping back into its more typical 12–20 “business as usual” range. In fact, this was the first time the VIX had dipped below 20 since March 27, when it closed at 19.89. The fear gauge continued to drift lower as the week went on, finishing Friday at 17.24. The temporary trade truce between the US and China helped calm nerves over tariffs, and investors responded with a more optimistic tone, pushing volatility expectations lower.
For anyone new to the VIX: it’s basically Wall Street’s stress meter. Below 12 signals calm waters, 12–20 is the normal range, and anything above 20 signals stormy seas.
Weekly Market and Portfolio Review
For the week, the TSX (SPTSX) gained 2.4%, the S&P 500 (SPX) jumped 5.3%, the DJIA (INDU) advanced 3.4% and the Nasdaq (CCMP) surged 7.2%.
| Index | Weekly Streak |
| TSX: | 6 – week winning streak |
| S&P: | 1 – week winning streak |
| DJIA: | 1 – week winning streak |
| Nasdaq: | 1 – week winning streak |
![]() After the previous week’s rough ride, markets came roaring back with a strong rebound, as you can see in the weekly progress chart above. The big catalysts were a cooling of the US-China trade war, better-than-expected inflation data, the return of the Magnificent 7 stocks, and a healthy dose of investor optimism.
After the previous week’s rough ride, markets came roaring back with a strong rebound, as you can see in the weekly progress chart above. The big catalysts were a cooling of the US-China trade war, better-than-expected inflation data, the return of the Magnificent 7 stocks, and a healthy dose of investor optimism.
The week kicked off with a bang after the US and China agreed to a 90-day truce and slashed tariffs. The US cut duties on most Chinese imports from 145% to 30%, while China dropped its 125% tariff on US goods to 10%. This eased tensions, calmed volatility, and took political heat off President Trump after recent market turmoil.
With the trade war on pause, investors shifted back into ‘risk-on’ mode. The S&P 500 Index (S&P) jumped 3.3%, the Dow Jones Industrial Average (DJIA) rose 2.8%, and the Nasdaq Composite Index (Nasdaq) soared 4.4%. It wasn’t a record-breaking rally, but it was much-needed – especially for the Magnificent 7, as investors scooped up beaten-down tech giants.
Momentum continued with inflation data showing the smallest annual increase since February 2021. Headline inflation is easing, but core goods inflation is lagging behind. Many companies are still burning through pre-tariff inventories, but higher prices could hit consumers once that buffer runs out.
The combination of easing trade tensions and cooling inflation gave markets a solid boost. After five straight winning sessions, the S&P clawed back into positive territory for the year, marking its fastest recovery from a 15% YTD decline since 1982.
The rally also pushed the Nasdaq into bull market territory, climbing over 20% from its April 8 low. Leading the charge was Nvidia (NASD: NVDA), which surged after the US lifted its ban on high-end artificial intelligence (AI) chip sales. Investors quickly piled back into Nvidia and other tech stocks, giving the sector a fresh boost. Adding to the momentum, Nvidia announced a massive deal to supply 18,000 advanced AI chips to Saudi Arabia as the kingdom ramps up its AI and cloud infrastructure.
Still, it wasn’t all smooth sailing. Retail sales rose slightly for the month, but the pace fell sharply from the previous month, hinting that tariff-driven price hikes are starting to bite. Meanwhile, consumer sentiment fell for the fifth straight month, hitting its lowest level since June 2022.
Despite those warning signs, investor optimism held strong. Markets continued climbing as hopes for more trade deals outweighed concerns over inflation and consumer spending.
While US markets stole the spotlight, Canada’s Toronto Stock Exchange Composite Index (TSX) quietly kept grinding higher. The index extended its weekly winning streak to six, powered by nine straight daily gains. This steady climb pushed the TSX to back-to-back record highs, lifted by easing global trade tensions and strong earnings in the technology, industrials, and financials sectors.
Markets have staged an impressive rebound since the April ‘Liberation Day’ plunge, but only one trade deal – the UK framework – is actually done. The US-China truce is a 90-day pause, not a resolution. Volatility has cooled, but uncertainty still looms, and it wouldn’t take much to shake things up again.
That said, confidence is growing that deals will get done. Investors don’t want to be left on the sidelines when that happens, so they’re positioning for the upswing.
In short: the rally is a welcome relief, but the road ahead could still offer plenty of ‘buying opportunities.’ 😊
| Portfolio | Weekly Streak |
| Portfolio 1: | 4 – week winning streak |
| Portfolio 2: | 5 – week winning streak |
| Portfolio 3: | 1 – week winning streak |
![]() Last week, I was hoping Portfolio 3 would finally join the others in positive territory. As you can see in the weekly performance chart below, it didn’t just tiptoe back into the green – it stormed in with authority.
Last week, I was hoping Portfolio 3 would finally join the others in positive territory. As you can see in the weekly performance chart below, it didn’t just tiptoe back into the green – it stormed in with authority.
Portfolio 1 stole the spotlight, jumping 9.4% for the week. A strong 71% of its holdings posted gains, led by Sea Limited (NYSE: SE) and indie Semiconductor (NASD: INDI), both up 15%. Celestica (TSE: CLS) added 14%, Cloudflare (NYSE: NET) climbed 12%, and a 10% rally from Nvidia – the portfolio’s largest holding – helped drive the surge. Thanks to this week’s bounce, Nvidia clawed back into positive territory for the year.
Portfolio 2 trailed its siblings but still notched a 3.1% gain, extending its winning streak to five weeks, the longest of the portfolios. About 70% of its holdings ended the week higher. While Portfolio 2 hasn’t delivered the flashy gains, it’s been steadily grinding higher – proof that slow and steady still gets it done.
Portfolio 3 came roaring back, snapping its losing streak with an 8.7% gain. A solid 80% of its holdings finished the week in the green, with Cloudflare’s 12% jump and Alvopetro Energy (TSE: ALV) rising 10%, giving the portfolio a much-needed boost.
The week also brought big news for Shopify (TSE: SHOP), which was announced as the newest addition to the Nasdaq-100. Joining the ranks of the 100 largest non-financial companies on the exchange boosts Shopify’s profile, draws more analyst attention, and increases demand as index funds and ETFs like the Invesco QQQ Trust (NASD: QQQ) are required to buy in. Higher trading volumes are another plus, making it easier for investors to jump in and out.
On the flip side, MongoDB (NASD: MDB) – held in Portfolio 2 – will be leaving the Nasdaq-100 to make room for Shopify. A bittersweet swap, but that’s how index rebalancing goes.
All in all, it was a strong week across the board, with Portfolio 3 back in black, er, green, and all three portfolios showing solid gains. Here’s hoping we’ll have another strong week in the markets and that we all can increase our wealth through investing! 😊

Companies on the Radar
 With markets now back – if not slightly ahead – of where they were before President Trump unleashed his tariff storm, I’ve decided to refocus my radar list on companies that aren’t already in any of my three portfolios. For anyone new to my updates, my radar list is basically a shortlist of stocks I’m curious about and want to dig deeper into. It’s my way of keeping an eye on potential future investments. If a company flunks my initial due diligence, it gets the boot. But if it passes, it stays on my watchlist until either the price looks right, or a better opportunity comes along.
With that in mind, I’m saying goodbye (for now) to three companies already in one of my three portfolios: goeasy Ltd. (TSE: GSY), Dollarama (TSE: DOL), and Brookfield Corporation (TSE: BN). That doesn’t mean I wouldn’t happily add to any of my current holdings if the right opportunity popped up – I’m always ready to add to my best performers. 😊
I’m also dropping Main Street Capital Corp. (NYSE: MAIN) from the radar. It’s still an intriguing company, but I feel there are better – with lower-risk – opportunities out there right now.
Speaking of new opportunities, three new names caught my attention this past week:
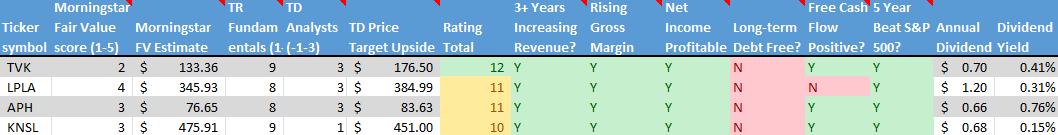
- TerraVest Industries (TSE: TVK): A Canadian mid-cap diversified industrial player serving sectors from agriculture to energy, mining, utilities, and construction.
- Amphenol Corporation (NYSE: APH): A global large-cap leader in electrical, electronic, and fiber optic connectors across a wide range of industries.
- Kinsale Capital Group (NYSE: KNSL): A large-cap specialty insurance provider focused on the US market.
They join the lone holdover from last week:
- LPL Financial Holdings Inc. (NASD: LPLA): A US large-cap brokerage and advisory platform that’s riding the long-term tailwinds of the wealth management boom.
As always, these are not buy recommendations – be sure to do your own research and make decisions that align with your personal financial goals!
The Radar Check was last updated May 16, 2025.

That’s a wrap for this week, thanks for reading – may your portfolio stay green and your dividends steady. See you next time!