For the past few weeks, I’ve been talking about tariffs – what they are, how they affect consumers, and how they affect the Canadian dollar. But tariffs rarely happen in isolation. When one country imposes them, the other often fires back with its own set of retaliatory tariffs. With this week’s announcement of sweeping US tariffs on imports from almost all trading partners, it’s the perfect time to discuss the next round of the trade war: counter tariffs.
What Are Counter Tariffs?
Counter tariffs are retaliatory taxes placed on imports in response to tariffs imposed by another country. Think of it as a trade war’s return volley – countries use them to push back against what they see as unfair trade practices and to protect their own industries.
For example, if the US slaps tariffs on Canadian steel, Canada might respond with tariffs on US agricultural products or machinery. This tit-for-tat approach can escalate quickly, affecting businesses, consumers, and the broader economy.
Canada’s Retaliatory Tariffs
In response to the US’s higher tariffs on Canadian steel, aluminum, and other products, Canada rolled out its own set of retaliatory tariffs. These counter tariffs targeted a range of US exports, including agricultural goods, machinery, and consumer products.
How Will These Tariffs Impact the US Economy?
Retaliatory tariffs don’t just hurt the country they’re aimed at – they ripple through businesses, consumers, and trade relationships. In the US, prices on imported goods could climb, making everyday purchases more expensive. American exporters, especially in agriculture and manufacturing, might see demand drop as Canadian buyers look elsewhere. Supply chains could take a hit too, raising costs for American businesses that rely on Canadian imports. And if prices keep rising, inflation could become another headache for the economy.
What Happens If More Countries Retaliate?
It’s not just Canada. The US has imposed tariffs on almost all its trading partners, affecting countries worldwide, including China, Mexico, the European Union, and Japan. If they all retaliate, the economic fallout could be even greater. American industries that rely on exports might see sharp declines in sales, while inflationary pressures push prices higher across the board. Economic growth could take a hit, with some estimates suggesting these trade disputes could shave up to 0.4% off US GDP. And if tensions escalate further, markets could become more volatile as investors react to shifting global trade policies.
The Impact on Canada
While Canada’s counter tariffs are meant to push back against US trade measures, they could also bring some challenges at home. Higher tariffs on American goods mean Canadian consumers may face rising prices, especially for products that don’t have easy substitutes. Businesses that rely on American imports for raw materials could see their costs climb, which might eat into profits or even force them to raise prices.
Inflation could become another concern. If costs keep rising, it could strain household budgets and put pressure on the broader economy. Certain industries, like manufacturing and agriculture, could be hit the hardest, depending on which goods are targeted. And if the standoff drags on, businesses may struggle with uncertainty, making it harder to plan and invest.
In the end, while counter tariffs aim to level the playing field, they also create economic headwinds. How much damage they do – and how long the standoff lasts – will depend on whether Canada and the US can find common ground, not to mention how other trading partners respond.
With President Trump taking aim at America’s trading partners this past week – and them firing back – investors had plenty to digest. Let’s take a look at how tariffs shook things up and what else moved the markets this past week ….
Items that may only interest or educate me ….
Canadian Economic news, US Economic news, Tariffs for all, ….
Canadian Economic news
This past week’s key economic data that the Bank of Canada (BoC) considers when deciding whether to raise or lower the interest rate.
Trade Surplus
Canada’s trade balance took a sharp turn in February, flipping from a surplus of a downwardly revised C$3.13 billion in January to a deficit of C$1.52 billion. That’s a big miss compared to analysts’ expectations of a C$3.55 billion surplus.
Exports tumbled 5.5% to C$70.11 billion, with declines across 10 of 11 product categories – especially in energy products and motor vehicles. Meanwhile, imports inched up 0.88% to C$71.63 billion, as businesses adjusted inventories ahead of potential US tariff changes.
Despite the unexpected deficit, trade activity remains strong, with both exports and imports still hovering near record levels. The real question is whether this is just a one-month blip or the start of something bigger. With new tariffs in play, I’d bet on the latter. ☹
Labour Force Survey (LFS)
Canada’s job market hit a rough patch in March. According to Statistics Canada, the country lost 32,600 jobs (-0.2%) – the first decline since January 2022 and a sharp contrast to analyst expectations of a 10,000-job gain. This follows February’s modest 1,100-job increase. On an annual basis, employment is still up 1.7%, but the latest drop suggests momentum may be fading.
As expected, the unemployment rate inched up to 6.7% from 6.6%, marking its first rise since November 2024. The decline was driven by a loss of 62,000 full-time jobs, partially offset by gains in part-time positions. Wages provided a small silver lining, with average hourly earnings up 3.6% year-over-year – though that’s a slight slowdown from February’s 3.8% increase.
Economic uncertainties continue to weigh on hiring, with inflation, shifting consumer habits, and new US tariffs on key Canadian exports – including steel, aluminum, and automobiles – adding pressure. These trade disruptions have hit manufacturing and supply chains hard, and the latest job numbers suggest the effects are rippling through the broader economy.
Canadian market volatility
The S&P/TSX 60 VIX (VIXC), which tracks expected volatility in the Canadian market, showed signs of investor unease this week. It opened at 16.23, and unlike its US counterpart, the VIXC remained range-bound between 14.25 and 15.6 for most of the week. But as tensions escalated over new US tariffs and Canada’s retaliatory response, the VIXC jumped to 19.43 – signalling that market uncertainty wasn’t just an American problem. By Friday, it had settled slightly, closing the week at 18.39 – above the calm zone, but not high enough to suggest panic among investors… unlike its American cousin (how’s that for a fine example of foreshadowing? 😊)
For those unfamiliar with the VIXC, think of it as the Canadian market’s stress meter. A reading below 10 signals strong investor confidence, 10 to 20 is business as usual, and anything above 20 suggests uncertainty is starting to take hold.
US Economic news
This past week’s key data points that the Federal Reserve (Fed) considers when deciding whether to raise or lower the interest rate.
Labour data
The latest updates from the Job Openings and Labor Turnover Survey (JOLTS), the ADP Employment Report, and the Employment Situation Summary (ESS) offer a snapshot of the US labour market – showing continued resilience, but also some signs of stress on the horizon.
JOLTS
The latest JOLTS report from the US Bureau of Labor Statistics showed job openings held fairly steady in February at 7.568 million, down slightly from January’s upwardly revised 7.762 million – and well below the 8.445 million from a year ago. The data came in just under forecasts of 7.616 million. The ratio of job openings to unemployed persons dipped to 1.07 from 1.2, suggesting a gradual cooling in demand for workers.
This softening is likely tied to rising economic uncertainty, especially around tariffs on imports. Still, demand for labour remained strong.
(Quick reminder: JOLTS tracks job openings as of the last business day of the month—in this case, February.)
ADP
The ADP report showed private payrolls grew by 155,000 in March – nearly double February’s upwardly revised 84,000 and well above expectations of 105,000. The manufacturing sector led the gains, while hiring in construction cooled. Wages remained firm, with job-stayers seeing a 4.6% year-over-year increase and job-changers landing a 6.5% bump.
ESS
March’s headline jobs report landed with a positive surprise. According to the BLS, the US economy added 228,000 jobs, a solid jump from February’s 151,000 and well above the 12-month average of 158,000. Analysts were expecting just 135,000, making this a stronger-than-expected report.
The unemployment rate edged up to 4.2% from 4.1%, continuing to bounce around the narrow 4.0% –4.2% range it’s been in since May 2024. Wage growth was steady, with average hourly earnings rising 0.3% month-over-month, matching February’s pace. Year-over-year wage growth ticked down slightly to 3.8% from 4.0% in February, just under the 3.9% economists had forecasted.
While the labour market still looks solid, the slight uptick in unemployment and cooling wage momentum may give the Fed some breathing room – especially with trade tensions ramping up.
Implications
The labour market was holding up reasonably well before this month’s full-blown trade wars kicked off. Despite growing concerns over tariffs and broader economic uncertainty, hiring remained resilient, with job gains beating expectations and wage growth holding steady.
That said, some early signs of stress are starting to show. Job openings have fallen, and the ratio of openings to unemployed workers has dipped. The unemployment rate has crept up to 4.2%, and wage growth, while still positive, is gradually cooling. These are subtle shifts, but they suggest the labour market’s momentum may be slowing.
Now that the US has launched trade disputes with all its major partners, the real test begins. The question isn’t whether the labour market is still strong – it is – but whether it can stay that way in the face of rising economic headwinds. The next few months will be key in showing whether this resilience holds – or if cracks start to form.
American market volatility
The CBOE Volatility Index (VIX), often referred to as the market’s “fear gauge,” opened the week at an already elevated 21.70 as investors braced for the fallout from new US tariffs and the expected retaliation from key trading partners. Volatility remained high, with the VIX bouncing between 21.0 and 25.0 for much of the week. But the day after the tariffs were announced, uncertainty spiked, sending the VIX to a three-week high of 29.96. Things didn’t calm down from there – the next day, the fear gauge surged into the 40s, closing the week at 45.31, a five year high.
While that’s a big jump, it’s still well below the panic levels of past crises—like the 82.69 spike on March 16, 2020, during the COVID market meltdown, or the all-time high of 89.53 during the 2008 financial crisis. Still, markets clearly aren’t shrugging off the current trade war drama.
For those new to the VIX, think of it as the stock market’s stress meter. A reading below 12 signals calm waters, 12 to 20 reflects normal market swings, and anything above 20 suggests growing uncertainty. When it pushes past 30, markets are in full-blown turmoil.
Tariffs for all
After weeks of threats, delays, and partial rollouts, President Trump has officially launched what could be a full-scale global trade war. The newly announced tariffs are one of the most sweeping increases in trade barriers in recent history. Here’s what’s changing:
- A 10% Baseline Tariff will now apply to all imports, except for goods that meet the rules of the United States-Mexico-Canada Agreement (USMCA).
- Country-Specific Tariffs will hit certain nations even harder. China faces a 34% tariff on imports (on top of existing tariffs), the European Union gets hit with 20%, and Vietnam sees the highest at 46%.
- Automobile Tariffs will rise to 25% for all foreign-made cars starting at midnight. Canadian-made vehicles are partially exempt, but only for their US sourced components.
- De Minimis Exemption Closure – Starting May 2, items valued under $800, which were previously exempt from tariffs, will now face a steep 54% tax. This exemption has long allowed low-value goods to enter the US tariff-free, benefiting businesses and individuals who ship small items across borders. Its removal means significantly higher costs for imported low-value products.
In 2024, the average US tariff rate sat at just 2.5%, generating roughly $83 billion in revenue. With these sweeping new measures, some investment firms estimate the average tariff rate will jump to around 29%. If import volumes hold steady, that means a massive surge in tax revenue—but also a major cost increase for businesses and consumers.
The administration argues that these tariffs will strengthen domestic manufacturing and reduce reliance on foreign goods. Some of the revenue is expected to fund infrastructure projects and support American industry, though the exact details are still unclear. For now, businesses, investors, and trading partners are bracing for the impact.
Canada Fires Back
Canada didn’t just sit on the sidelines after the US ramped up tariffs on Canadian steel, aluminum, and other products. Instead, it fired back with its own set of retaliatory tariffs, targeting a wide range of American exports – everything from agricultural goods to machinery to everyday consumer products. While Canada was spared in Wednesday’s latest round of US tariffs, the federal government responded by slapping a 25% tariff on US made vehicles that don’t meet USMCA standards – mirroring the 25% duty President Trump imposed on Canadian cars.
The goal? To send a clear message: if you hit us with tariffs, we’ll hit you back. But while these counter tariffs are meant to level the playing field, they also come with risks. Canadian businesses that depend on US imports could see their costs go up, and consumers might feel the pinch at the checkout as certain products become more expensive.
It’s a classic case of economic push and pull. The longer the standoff lasts, the more pressure it could put on both economies – raising prices, squeezing profits, and creating uncertainty for businesses trying to plan ahead.
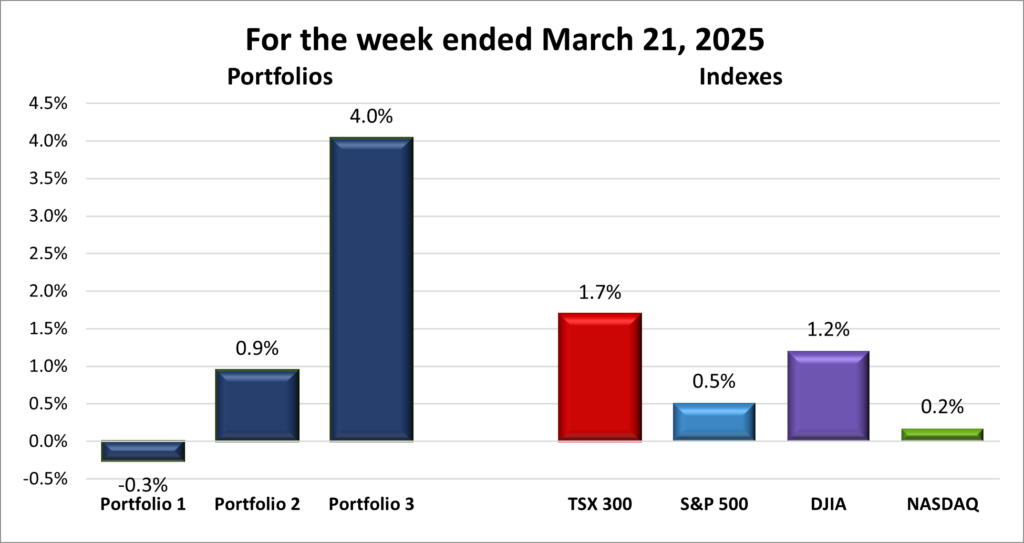
Weekly Market and Portfolio Review
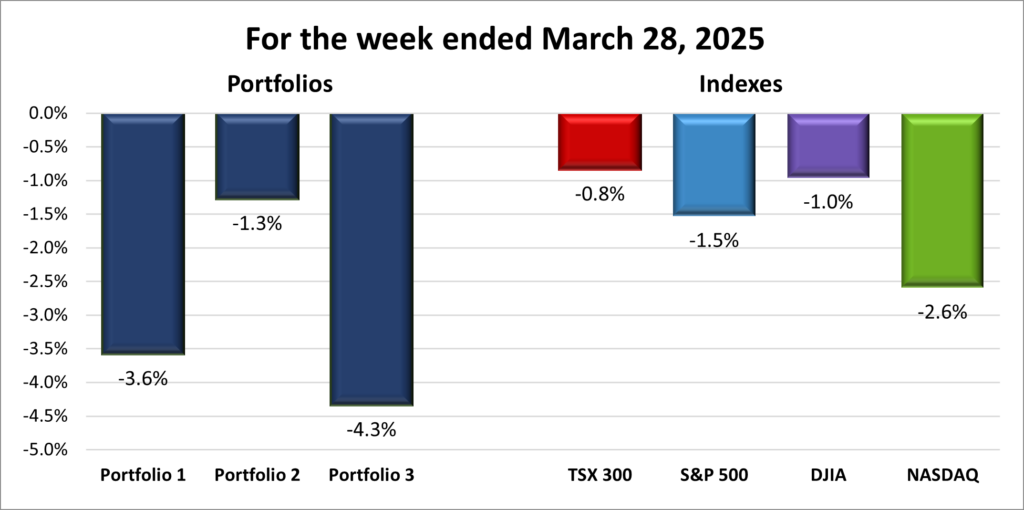
For the week, the TSX (SPTSX) fell 6.3%, the S&P 500 (SPX) dropped 9.1%, the DJIA (INDU) sunk 7.9% and the Nasdaq (CCMP) plunged 10.0%.
| Index | Weekly Streak |
| TSX: | 2 – week losing streak |
| S&P: | 2 – week losing streak |
| DJIA: | 2 – week losing streak |
| Nasdaq: | 2 – week losing streak |
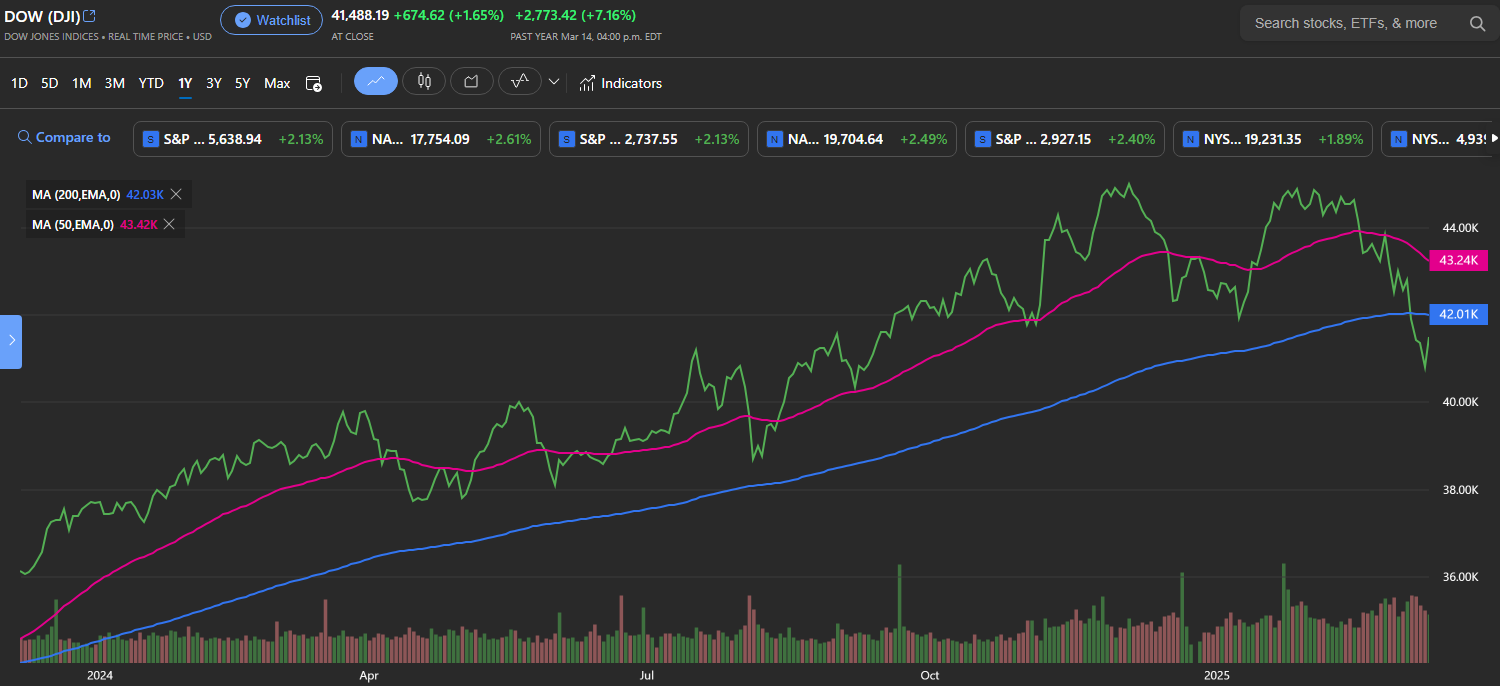
![]() Thanks to a sweeping round of unnecessary US tariffs – what The New York Times called “the dumbest trade war ever” – markets just had their worst week since March 2020, when COVID first rocked the world. As shown in the weekly graph above, everything was cruising along… until Wednesday afternoon, when President Trump officially launched a trade war against nearly every country on Earth.
Thanks to a sweeping round of unnecessary US tariffs – what The New York Times called “the dumbest trade war ever” – markets just had their worst week since March 2020, when COVID first rocked the world. As shown in the weekly graph above, everything was cruising along… until Wednesday afternoon, when President Trump officially launched a trade war against nearly every country on Earth.
Normally, a blockbuster US jobs report would’ve stolen the spotlight. But not this time. Markets tanked, and the damage was historic. The Toronto Stock Exchange Composite Index (TSX), the S&P 500 (S&P), and Dow Jones Industrial Average (DJIA) all slid into correction territory (10%+ declines from recent highs), while the Nasdaq Composite (Nasdaq) plunged into a full-blown bear market, down more than 20%. In just two days, companies in the S&P shed a jaw-dropping US$5 trillion in value – surpassing even the worst of March 2020. The ‘Magnificent Seven’ alone lost US$1.8 trillion in market cap.
So… how did we get here?
At the start of the week, markets were uneasy. Investors were on edge, unsure how steep the tariffs might be. Still, despite the nerves, markets drifted slightly higher through Wednesday. Then, after the closing bell, President Trump dropped the hammer: a 10% tariff floor on almost all trading partners, with many facing much higher rates. It’s the biggest tariff hike in over a century, dismantling a global trading system in place since the end of World War II. The new tariffs, covering over 180 countries, take effect April 5 and 9.
Markets were stunned – and reacted swiftly. Stocks plunged in after-hours trading Wednesday, and by Thursday’s close, the S&P was down 4.8%, wiping out US$2.4 trillion in value. The Nasdaq fell nearly 5.9% – its worst day since early 2020. The DJIA dropped 3.9%, its fifth-worst day on record. In Canada, the TSX dropped “only” 3.8% – its biggest one-day loss since June 2020.
As if that wasn’t enough, China retaliated Friday morning with 34% tariffs of its own, effective April 10, sending markets tumbling once again. And to make matters worse, Fed Chair Jerome Powell warned the tariffs could fuel inflation and slow economic growth—two things investors really don’t want to hear.
The big fear now? That this spirals into a global trade war, tipping the US into recession – and possibly dragging the rest of the world with it. It’s a sharp reversal from November, when investors were cheering the new administration and hoping for tax cuts and business-friendly policies. Instead, markets have been retreating ever since President Trump returned to office.
Canada may not have been named among the worst 25 offenders, but we didn’t get off easy. A new 25% tariff on foreign-made vehicles includes Canadian cars – though it only applies to non- US content. The US also stuck with earlier tariffs: 10% on Canadian energy exports and 25% on steel and aluminum. In total, the TSX dropped 8.4% over those two days.
With US tariffs now at their highest levels since the 1940s, the pressure on the economy – and inflation – is almost certain to rise. And with that, investor uncertainty is only deepening. The question now is how businesses and households will respond.
If there’s a silver lining, it’s this: the Fed may now be more inclined to cut rates sooner – maybe even as early as June – to help cushion the blow. But the damage has already been done. And the road ahead looks anything but smooth.
| Portfolio | Weekly Streak |
| Portfolio 1: | 3 – week losing streak |
| Portfolio 2: | 2 – week losing streak |
| Portfolio 3: | 2 – week losing streak |
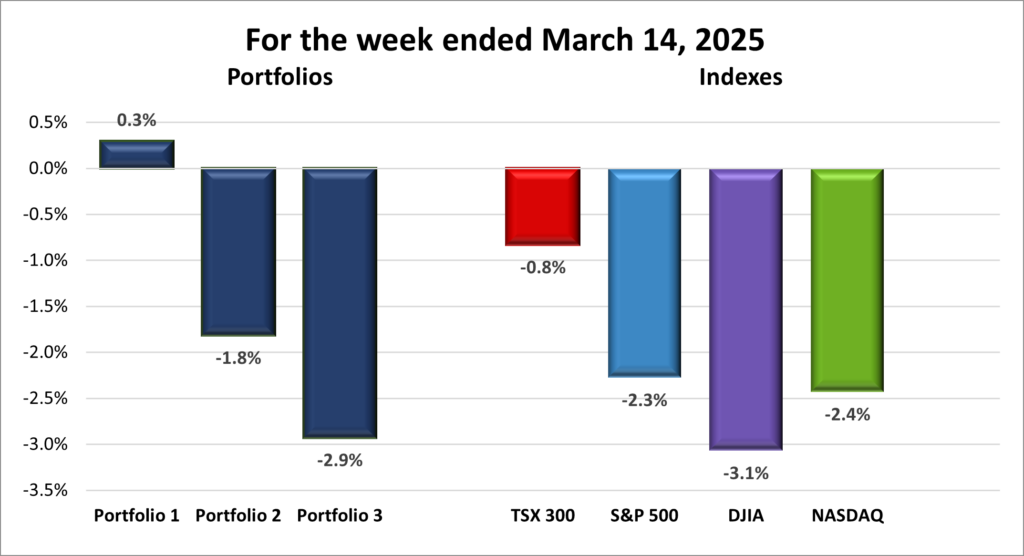
![]() This week wasn’t kind to my portfolios either – especially with the mega-cap tech stocks that had been doing the heavy lifting the past two years suddenly taking a nosedive. There were way too many double-digit losers to list, so instead I decided to highlight the rare bright spots: the companies that actually managed to finish the week in the green.
This week wasn’t kind to my portfolios either – especially with the mega-cap tech stocks that had been doing the heavy lifting the past two years suddenly taking a nosedive. There were way too many double-digit losers to list, so instead I decided to highlight the rare bright spots: the companies that actually managed to finish the week in the green.
Portfolio 1 had a rough ride, dropping 10.4%. Only three companies – just 6% of the portfolio – managed to post gains. Honestly, I was surprised it wasn’t a complete shutout. The trio that pulled it off? Telus (TSE: T), Celsius Holdings (NASD: CELH), and Andlauer Healthcare (TSE: AND). Meanwhile, names like Nvidia (NASD: NVDA) tumbled more than 10%, leading a tech-heavy slide.
Portfolio 2 fared the best of the bunch, though that’s not saying much. It fell 5.1%, with four companies – or 14% of the holdings – managing to fight off the tariff-induced selloff. The winners this week were Fortis (TSE: FTS), Telus, Alimentation Couche-Tard (TSE: ATD), and Dollarama (TSE: DOL).
And then there’s Portfolio 3, which had the worst week of them all. It plunged 10.6%, and not a single holding posted a gain. Not even a fractional uptick. Just… ouch. 😞
After a week like this, it’s tempting to want to hit the eject button – but weeks like these are also a reminder of why staying invested and focused on the long-term matters. Volatility is part of the investing game, especially when global events stir up this much uncertainty. For now, I’m holding steady keeping an eye on how markets digest the tariffs, how other countries respond, and how both the BoC and the Fed react to slowing economies and rising inflation. The last time markets dropped this far, they rebounded strongly over the next year and a half. Here’s hoping next week brings a bit more calm – and marks the start of another strong rebound. 🤞

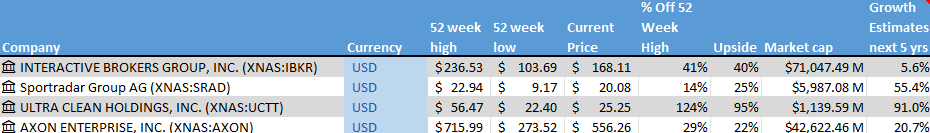
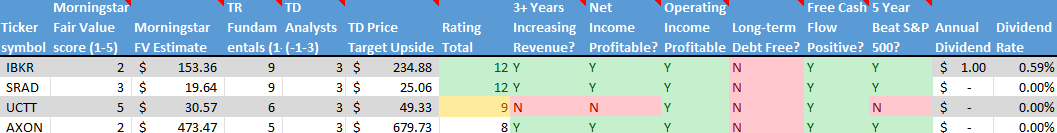
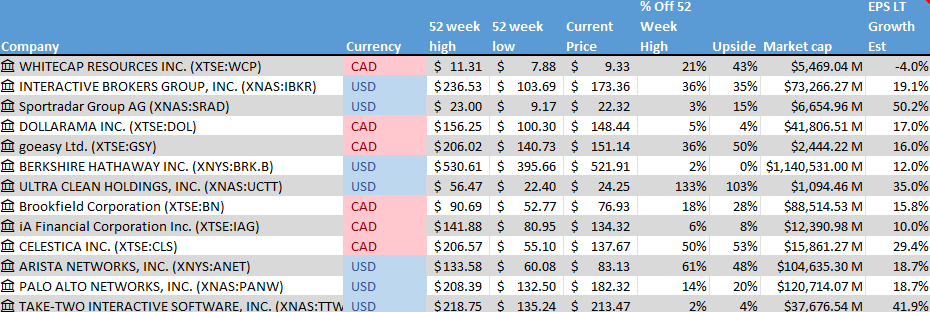
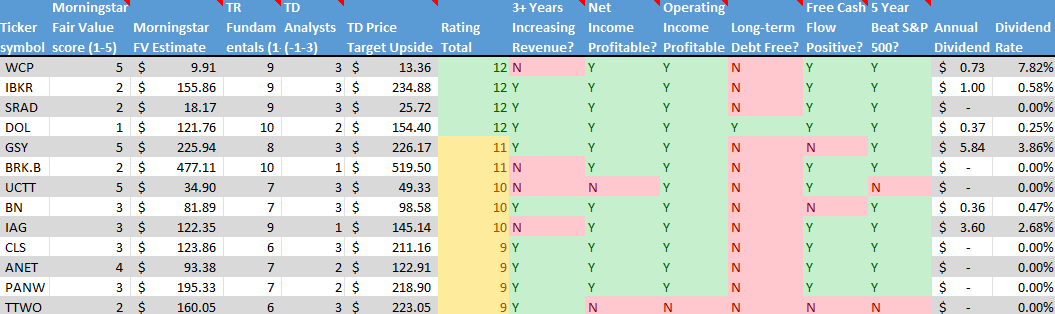
Companies on the Radar
 My radar list kicked off the week with nine companies, but with economic uncertainty mounting – thanks to tariffs (essentially another form of taxes) and companies bracing for lower revenues and profits – I’m shifting my focus toward dividend-paying stocks. These companies provide a steady income stream, helping to offset market turbulence while adding resilience and reducing overall portfolio risk.
Tariffs create headwinds for businesses, especially high-growth companies that rely on global supply chains and international markets. Rising costs and trade disruptions can squeeze earnings, leading to stock price volatility and slower expansion. That’s why dividend-paying companies are looking more attractive to me right now. They tend to be well-established, financially stable, and less dependent on aggressive growth strategies. Their dividends act as a cushion during market downturns, and reinvesting those payouts can help compound returns over time – an added bonus for long-term investors like me.
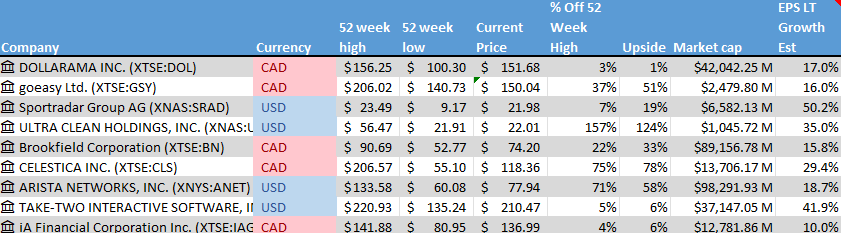
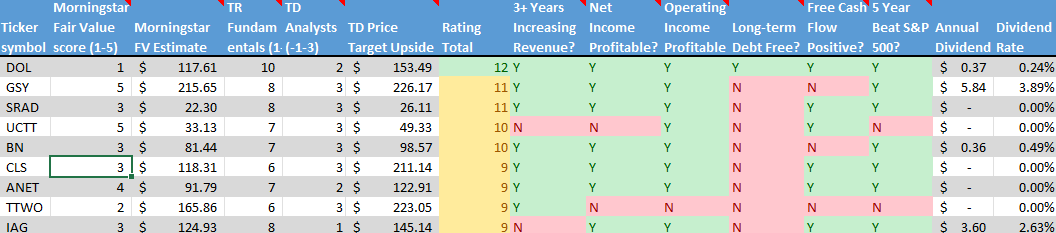
With this in mind, I’ve pushed non-dividend payers like Sportradar Group AG (NASD: SRAD), Ultra Clean Holdings (NASD: UCTT), Celestica Inc. (TSE: CLS), Arista Networks ((NYSE: ANET), and Take-Two Interactive Software (NASD: TTWO) to the outer edges of my radar. That doesn’t mean they’re off the table entirely – if one of these stocks drops to a price that’s too good to ignore, I’ll seriously consider becoming an owner.
With five companies moving to the sidelines, two new names have caught my attention: Barrick Gold Corporation (TSE: ABX) and LPL Financial Holdings Inc. (NASD: LPLA). Barrick, a large-cap Canadian company, is one of the world’s largest gold and copper miners, with operations spanning the globe. LPLA, a large-cap US firm, provides an integrated brokerage and investment advisory platform for independent financial advisors.
With these to new additions, my list is down to the six companies, including the four holdovers from last week listed below:
- Brookfield Corporation (TSE: BN): A large cap Canadian alternative asset manager and REIT/Real Estate Investment Manager.
- Dollarama: A large cap Canadian company that operates a growing chain of discount stores across Canada and is expanding into South America.
- goeasy Ltd. (TSE: GSY): A mid cap Canadian company that provides non-prime leasing and lending services to consumers in Canada.
- iA Financial Corporation (TSE: IAG): A large cap Canadian company that provides insurance products in Canada and the US.
As always, these are not buy recommendations – be sure to do your own research and make decisions that align with your personal financial goals!
The Radar Check was last updated April 4, 2025.


That’s a wrap for this week—see you next time! Happy investing!
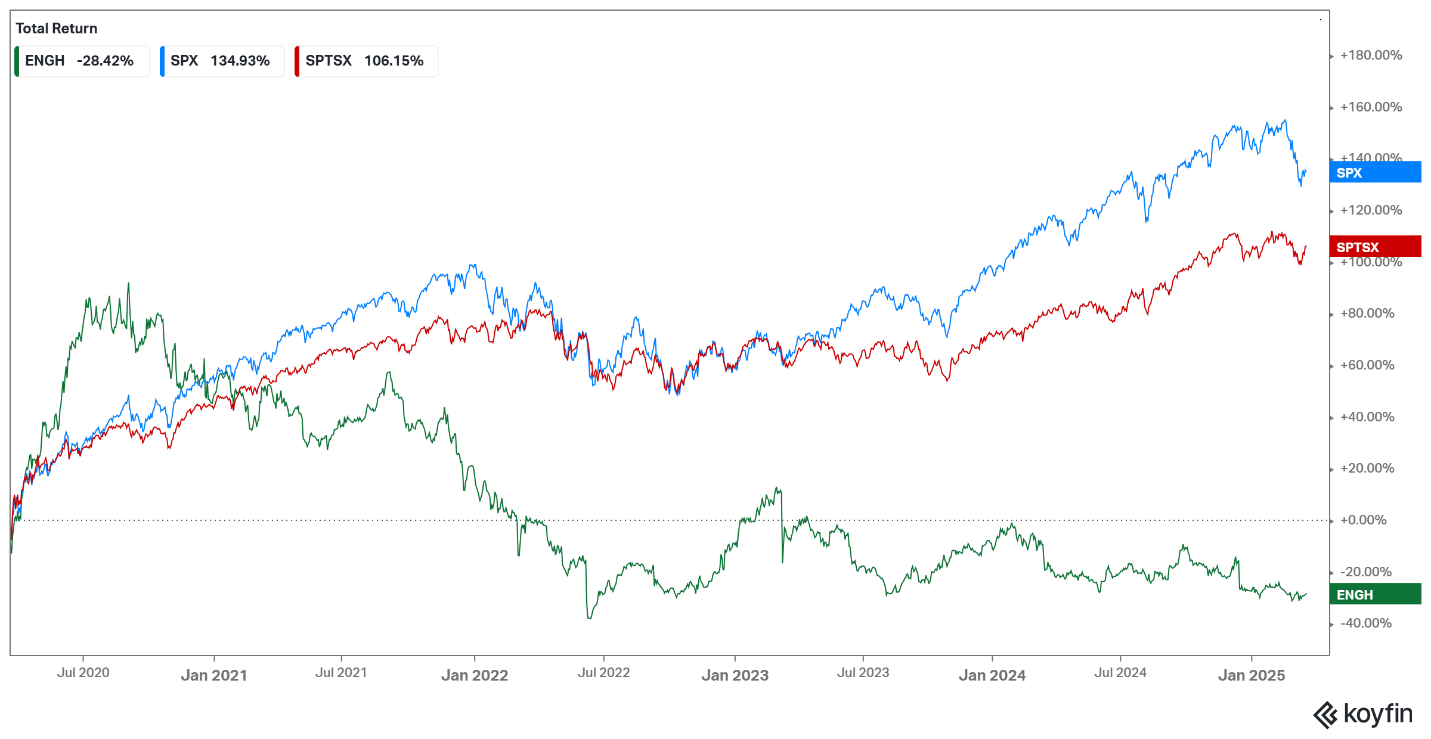 By selling some shares, I’ve freed up cash for better opportunities while keeping a foot in the door in case Enghouse regains momentum. For now, I’ll hold onto a smaller position to collect dividends and see if the company can turn things around.