I originally planned to kick off this update with an in-depth look at dividends—a topic I’ve been wanting to discuss for a while. However, two things changed that plan. First, the discussion on dividends grew much larger than I anticipated, making it tough to fit within this post. Second, an unexpected market-shaking event took centre stage: the rise of a new artificial intelligence (AI) player, sending ripples through the markets and making waves among the current AI leaders.
Rather than glossing over this event, I felt it warranted a more detailed discussion. This week, China’s DeepSeek AI entered the scene, disrupting expectations and raising major questions about the future of AI investments. While the dividend discussion is still on my mind, I decided to give it its own standalone post, which you can find here.
With that out of the way, let’s jump into the big story that set the tone for the week: the emergence of DeepSeek AI and the surprise it delivered to the markets.
DeepSeek AI: Disrupting Reshaping Magnificent 7 and the Markets
![]() A Chinese AI startup, DeepSeek, has just turned the tech world on its head with the launch of DeepSeek-R1 – a powerful yet cost-efficient AI model. Unlike competitors that pour hundreds of millions into development, DeepSeek-R1 was built for less than US$6 million—a fraction of the cost.
A Chinese AI startup, DeepSeek, has just turned the tech world on its head with the launch of DeepSeek-R1 – a powerful yet cost-efficient AI model. Unlike competitors that pour hundreds of millions into development, DeepSeek-R1 was built for less than US$6 million—a fraction of the cost.
Why is this such a big deal? It raises serious questions for the biggest players in AI. If DeepSeek can create a cutting-edge model at a bargain price, what does that mean for companies like Nvidia (NASD: NVDA), Microsoft (NASD: MSFT), and Alphabet’s (NASD: GOOGL) Google, which have spent billions on AI? Investors didn’t like the uncertainty, and the markets reacted accordingly.
Why Did DeepSeek AI Shake the Markets?
- Cost Shock – Companies like OpenAI and Google spend fortunes on AI, but DeepSeek showed that cutting-edge models don’t need to break the bank. Investors are now wondering if the big players have been overspending.
- Performance Surprise – Despite its budget-friendly development, DeepSeek-R1 performs just as well—if not better—than ChatGPT or Google’s Gemini. This unexpected leap has raised concerns about whether US tech giants are at risk of losing their edge.
- The Open-Source Disruptor – DeepSeek went open source, meaning its code is available for anyone to use or tweak. This move could upend the pay-to-play model used by companies that rely on selling proprietary AI tools.
How DeepSeek’s Innovation Challenges the Magnificent 7
The Magnificent 7—Apple (NASD: AAPL), Microsoft, Google (Alphabet), Amazon (NASD: AMZN), Meta (Facebook) (NASD: META), Tesla (NASD: TSLA), and Nvidia—felt the ripple effects of DeepSeek’s debut. Here’s how the damage unfolded:
- Nvidia: The hardest hit – its stock plunged 17% in a single day. Nvidia’s business thrives on selling high-end AI chips, but DeepSeek’s approach suggests fewer expensive chips may be needed in the future. That’s a direct threat to Nvidia’s growth.
- Microsoft, Google, and Apple: These heavyweights also took a hit as investors began questioning the massive sums they’ve invested in AI. Cheaper and more efficient rivals like DeepSeek could pressure these companies to rethink their strategies.
What’s Next for the Big Tech Giants?
DeepSeek has raised the bar, but the Magnificent 7 aren’t out of the game. Here’s what they might focus on:
- Cut Costs Without Cutting Corners – DeepSeek proved you can build innovative AI without a massive budget. Big players may need to streamline their processes to remain competitive.
- Strategic Open Source – DeepSeek’s open-source success highlights the power of collaboration. Companies like Google and Microsoft might explore more open approaches to foster innovation while managing costs.
- Relentless Innovation – The AI race isn’t just about cost – it’s about creativity. Expect tech giants to double down on smarter algorithms and next-gen designs to stay ahead.
- Global Adaptability – DeepSeek’s AI isn’t just affordable; it’s bilingual and globally tailored. US tech companies may need to develop more localized solutions to maintain relevance in international markets.
Nvidia’s AI Dominance Under Threat
Nvidia faces the toughest challenge of all. Its dominance relies on the demand for high-powered AI chips, but if companies can achieve similar results with cheaper hardware, demand could soften. Investors are understandably questioning whether Nvidia’s AI-fueled growth can last.
A Wake-Up Call for Investors
DeepSeek AI just proved that the AI industry is anything but predictable. Its rise is pushing technology companies to rethink their strategies, potentially ushering in an era of faster, cheaper innovation. Whether this is a short-term shakeup or the start of a major shift, one thing is clear: the AI race just got a lot more competitive.
For us investors, DeepSeek is a wake-up call that disruption and volatility can come from the least expected corners. While AI insiders might have seen this coming, it blindsided me – and the markets. I thought holding shares in the top AI companies meant smooth sailing for at least another year. As I’ve said before, the markets hate surprises, and that was evident with the sharp sell-off on Monday. Still, moments like these often create opportunities, and this shakeup was no exception. 😊
Now that you know what rattled the markets to kick off the week, let’s review how the markets fared the rest of the past week. With a whirlwind of economic news, earnings reports, and central bank rate announcements, there’s a lot to consider – so grab your drink of choice and, as Daenerys Targaryen would say, “Let’s begin.” 😊
Items that may only interest or educate me ….
Canadian Economic news, US Economic news
Canadian Economic news
This past week’s key economic data that the Bank of Canada (BoC) considers when deciding whether to raise or lower the interest rate.
Bank of Canada rate decision
As widely expected, the BoC kicked off 2025 with another rate cut, lowering its benchmark rate by 0.25% to 3.0%—its sixth consecutive reduction. Governor Tiff Macklem pointed to easing inflation, which has stayed at or below the bank’s 2% target since August, as a key reason for the move.
While inflation is under control, a new threat is emerging: US trade policy. Macklem acknowledged that the risk of tariffs played a significant role in the Bank of Canada’s decision. He warned that potential tariffs from the US could be a “major source of uncertainty” for Canada’s economy and could cause a serious shock if trade tensions escalate. Broad, severe tariffs would not only slow growth but also drive-up prices, putting the BoC in a tough position. By cutting rates now, the BoC hopes to cushion the impact if these tensions intensify.
For us investors, lower interest rates usually bring some upside – cheaper borrowing, more consumer spending, which often leads to rising stock prices. However, the BoC made it clear they’re keeping a close eye on the evolving trade situation. If tensions escalate, markets could face more volatility, and the economic outlook could shift quickly.
Gross Domestic Product (GDP)
Canada’s economy shrank more than expected in November, with GDP falling 0.2% after growing 0.3% in October. Analysts had only expected a 0.1% drop, so this came as a bit of a disappointment. The slowdown was widespread, with 13 of 20 industries contracting. On an annual basis, GDP growth cooled to 1.5%, down from 1.9% in October.
One of the key factors behind the decline was work stoppages in transportation services (trucking and rail) and at ports, which disrupted economic activity. However, there’s some good news – early estimates suggest the economy rebounded in December, growing 0.2%, thanks to gains in retail trade, manufacturing, and construction. For the fourth quarter, GDP is expected to rise by 1.8%.
Looking ahead, the Bank of Canada (BoC) has lowered its 2025 growth forecast from 2.1% to 1.8%, largely due to slower population growth. But there’s another wildcard in play: if the US moves forward with a 25% tariff on Canadian imports this weekend, the BoC may have to revise its forecast even lower.
So, why does GDP matter to us investors? It’s a key indicator of economic health, showing how much the country is producing. The BoC keeps a close eye on GDP to make decisions about interest rates, inflation control, and economic stability. A weaker economy could increase the chances of rate cuts, while stronger growth might push the BoC to hold rates steady for longer.
Canadian market volatility
Canada’s Volatility Index (VIXC) had a bumpy ride this week, opened at 16.69 before settling at 14.53 at the close of the Friday session. Concerns over interest rates, weak economic data, and looming US tariffs on Canadian exports kept market jitters high, triggering several swings in the index.
If you’re new to the VIXC (traded as VIXI on the TSX), think of it as the market’s fear gauge. A reading below 10 signals smooth sailing, while 10 to 20 reflects typical market ups and downs. When it jumps past 20, uncertainty is on the rise, and things could get choppy. This week’s quick recovery and lower close suggest investors aren’t panicking over the tariff risk—at least not yet. 😊
US Economic news
This past week’s key data points that the Federal Reserve (Fed) considers when deciding whether to raise or lower the interest rate.
Federal Open Market Committee rate decision
The Fed just wrapped up its first policy meeting of 2025, and as expected, they decided to hit pause on interest rate cuts. After three straight reductions at the end of 2024, the benchmark rate is staying put in the 4.25–4.5% range. But what does that mean for us investors?
The Fed emphasized that while the labour market remains solid, inflation is still a bit too high for comfort – especially the stubborn kind that lingers longer than expected. By keeping rates steady, they’re aiming to bring inflation back to their 2% target without disrupting economic growth.
After cutting rates three times in late 2024, they’re now taking a breather to assess the impact before making their next move. Meanwhile, higher tariffs and other government policies could add another layer of uncertainty. Fed Chair Jerome Powell noted that these potential shifts could significantly influence inflation and economic growth, so the Fed is keeping a close eye on developments before deciding on its next steps.
What This Means for Borrowers and the Markets
- For Americans: If you’ve got a mortgage, personal or business loan, or credit card debt, your interest rates will stay high for now, so borrowing costs won’t be easing up just yet. The stock market might also remain cautious since lower rates – often a boost for stocks – are on hold for the time being.
- For Canadians: While the Fed’s decision doesn’t directly impact us, it could still have ripple effects. A steady US rate might weaken the Canadian dollar, making US imports more expensive and potentially adding to inflation pressures here. It could also lead to more money flowing into US investments, which might tighten financial conditions in Canada.
At the end of the day, the Fed’s job is to keep the US economy growing without letting inflation spiral out of control. While this decision might not change things overnight, it’s something to watch – especially since any big moves by the Fed can influence economic conditions here in Canada. 😊
Consumer Confidence Index (CCI)
Consumer confidence took a hit in January, according to The Conference Board’s latest CCI report, dropping to 104.1 from a revised 109.5 in December – falling short of expectations at 105.6. This unexpected dip suggests growing unease among consumers.
The Present Situation Index, which reflects views on current business and labour market conditions, plunged 9.7 points to 134.3 – a sharp decline that signals rising concerns. Meanwhile, the Expectations Index, which measures short-term outlooks for income, business, and jobs, slipped 2.6 points to 83.9. While it’s still above the key 80 level that often raises recession alarms, the decline hints at mounting uncertainty about what lies ahead.
With inflation still high, interest rates elevated, and job market worries creeping in, consumers are feeling the pressure. While sentiment hasn’t reached crisis levels, the trend suggests that economic challenges are weighing on confidence.
GDP
The latest GDP report from the Bureau of Economic Analysis shows that the US economy lost some momentum in Q4 2024, growing at an annualized 2.3% – falling short of the 2.6% expected by economists and slowing from 3.1% in Q3.
What fueled growth? Consumer spending remained strong, rising at an impressive 4.2% annualized rate. However, weaker business investment and a drag from net exports weighed on the economy, holding back overall GDP growth.
For the full year, the economy expanded 2.8%, slightly below 2023’s 2.9% but still ahead of 2022’s 2.5% – a sign that, despite some headwinds, economic resilience remains.
For us investors, a slowdown in US growth could bring more market swings. Uncertainty tends to fuel volatility, making markets more unpredictable. If the Fed responds by cutting interest rates to support growth, it could weaken the US dollar. For us Canadian investors holding US stocks, a weaker dollar means any gains could shrink when converted back to Canadian dollars.
On the business side, many Canadian companies, particularly in energy and manufacturing, depend on US demand. If the US economy slows, it could hit profits here at home – especially with tariffs already in the mix. Keeping an eye on these cross-border impacts will be key in the months ahead.
A weaker US economy doesn’t just stay south of the border – it ripples through markets, currencies, and trade, meaning we investors need to stay sharp and adaptable. 😊
Personal Consumption Expenditures (PCE)
The latest PCE price index – the Fed’s go-to measure for inflation – came in largely on target. In December, prices rose 0.3%, following a 0.1% increase in November. Over the past year, PCE inflation landed at 2.6%, slightly above November’s 2.4%. In simple terms, this means the cost of goods and services continued to rise, though not at an alarming pace.
Core PCE, which strips out the more unpredictable food and energy prices, ticked up 0.2% for the month (compared to 0.1% in November) and held steady at 2.8% year-over-year. Since core PCE removes the more volatile stuff, it gives us a clearer picture of the overall inflation trend.
Because the Fed uses this report to guide interest rate decisions, investors keep a close eye on it. If inflation heats up too much, the Fed might keep rates higher for longer to cool things down. While inflation is still above the Fed’s 2.0% target, December’s numbers were right in line with expectations, so markets weren’t caught off guard. However, with uncertainty surrounding the impact of President Trump’s planned tariffs, the Fed is likely to wait and see how inflation reacts before making its next move.
American market volatility
The CBOE Volatility Index (VIX), often called the market’s “fear gauge,” kicked off the week at 18.83 and spiked to 22.03 within hours after news of a cheaper Chinese AI assistant shook investors’ confidence in the dominant AI players. But as the week went on, the panic faded, and the VIX steadily drifted lower, closing at 16.44.
For those new to the VIX, think of it as the market’s stress meter. A reading below 12 means calm waters, while 12 to 20 signals normal market swings. If it climbs above 20, nerves are rising, and anything over 30 usually signals real trouble. This week’s cooldown suggests investors have settled down – for now. 😊
Weekly Market and Portfolio Review
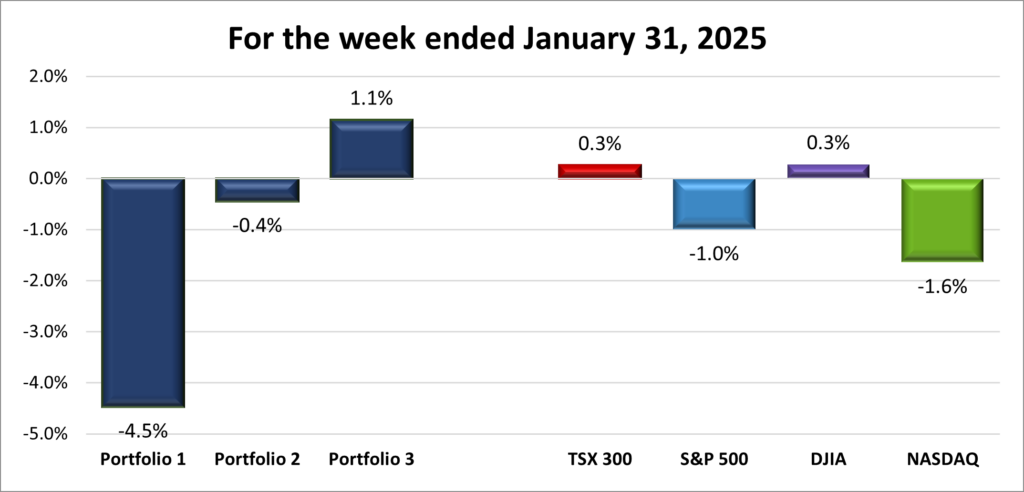
For the week, the TSX (SPTSX) gained 0.3%, the S&P (SPX) fell 1.0%, the DJIA (INDU) increased 0.3% and the Nasdaq (CCMP) dropped 1.6%%.
| Index | Weekly Streak |
| TSX: | 3 – week winning streak |
| S&P: | 1 – week losing streak |
| DJIA: | 3 – week winning streak |
| Nasdaq: | 1 – week losing streak |
![]()
![]() The markets started the week on shaky ground, stumbling out of the gate before recovering some losses. By the end of the week, only the DJIA, which stayed in positive territory throughout, and the TSX, which clawed its way back, managed to post gains. Meanwhile, the S&P and Nasdaq struggled to rebound, with looming tariff concerns ensuring both indexes finished in the red.
The markets started the week on shaky ground, stumbling out of the gate before recovering some losses. By the end of the week, only the DJIA, which stayed in positive territory throughout, and the TSX, which clawed its way back, managed to post gains. Meanwhile, the S&P and Nasdaq struggled to rebound, with looming tariff concerns ensuring both indexes finished in the red.
A major shake-up came when Chinese startup DeepSeek AI unveiled an AI platform that rivaled those developed by American tech giants—at a fraction of the cost. The news sent shockwaves through the markets, raising concerns about the future demand for high-end semiconductors and the energy needed to power them. Tech stocks plunged, but once the initial panic subsided, investors jumped in to buy the dip, helping indexes recover some of the losses.
Once the dust settled, markets found support from a Fed rate pause, strong corporate earnings, and inflation data that aligned with expectations. But the upward momentum was short-lived. President Trump’s long-discussed tariffs on the America’s three biggest trading partners became a reality when the White House confirmed it planned to move forward with the tariffs. While investors had been bracing for this, the official announcement still pressured markets, leading to a late-week pullback.
In Canada, the TSX extended its winning streak to three weeks, proving its resilience despite rising tariff concerns. With Canada firmly in President Trump’s crosshairs, uncertainty loomed over the market. Still, the TSX reached a new record high, boosted by the BoC’s sixth straight rate cut. However, the rally lost steam as news broke that tariffs on Canadian imports would take effect on February 1, stalling its momentum.
All in all, it was a week of navigating familiar risks—rate policy, earnings, economic data, and tech volatility—with an added twist: tariffs. With so much in play, the next few weeks will likely keep us investors on our toes, watching for opportunities as they come. 😊
| Portfolio | Weekly Streak |
| Portfolio 1: | 1 – week losing streak |
| Portfolio 2: | 1 – week losing streak |
| Portfolio 3: | 3 – week winning streak |
![]()
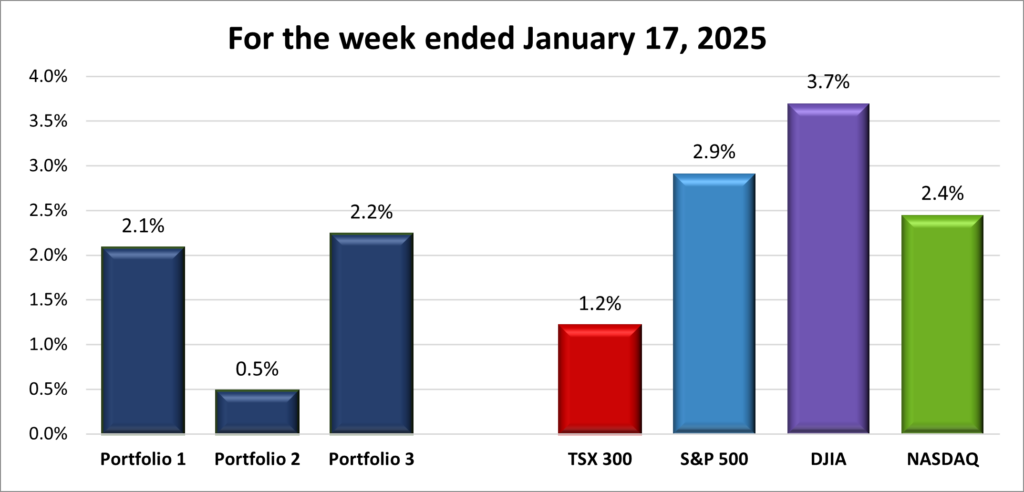
![]() It wasn’t a great week, but it also wasn’t as bad as I expected—thanks to Portfolio 3 managing to post a strong win, as shown in the chart below. With the unexpected market drop early in the week and the tariff announcement on Canada and Mexico, volatility was the name of the game this past week.
It wasn’t a great week, but it also wasn’t as bad as I expected—thanks to Portfolio 3 managing to post a strong win, as shown in the chart below. With the unexpected market drop early in the week and the tariff announcement on Canada and Mexico, volatility was the name of the game this past week.
Portfolio 1 had a rough start, with Celestica (TSE: CLS) and Nvidia both tumbling 17% on Monday. Nvidia’s drop erased roughly US$593 billion in market value—the largest one-day loss in US market history and more than double the previous record loss from September 2024, also set by Nvidia. Fortunately, Nvidia clawed back most of those losses, ending the week down just 3.6%, while Celestica staged an even stronger rebound, turning Monday’s loss into an 18% weekly gain.
Overall, 59% of the portfolio’s holdings finished higher, but it still ended up as the biggest loser among the three portfolios and the four major indexes. Shopify (TSE: SHOP) jumped 13%, while Cloudflare (NYSE: NET) and Kelly Partners Group (OTCM: KPGHF) climbed 12% each. Carnival Corp. (NYSE: CCL) also had a solid week, gaining 10%. On top of that, several stocks hit all-time highs including, Alphabet (Google), Amazon, CrowdStrike (NASD: CRWD), Visa (NYSE: V), and Walmart (NYSE: WMT). Unfortunately, none of that was enough to counter Nvidia’s decline. With Nvidia making up nearly 40% of the portfolio’s value, when it drops, the portfolio follows—and that was exactly the case this week. Adding to the downside, Hammond Power Solutions (TSE: HPS.A) slid 12%, likely weighed down by tariff concerns.
Portfolio 2 had the weakest performance of the three, with only 55% of its holdings finishing higher. The biggest mover was Hammond Power Solutions, down 12%. Otherwise, not much to report.
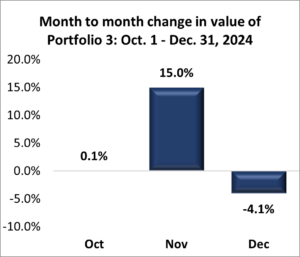
Portfolio 3 was the surprise of the week, managing to edge higher despite Vertiv Holdings (NYSE: VRT) plunging 20% on Monday. Investors quickly bought the dip, pushing Vertiv’s stock back up and helping it end the week nearly 1% higher—not a bad recovery! 😊 Meanwhile, 65% of the portfolio’s holdings posted gains, including Cloudflare, which jumped 12%. On the flip side, Real Matters (TSE: REAL) fell 11%, capping overall gains.
All in all, it was a bumpy week, but given how things started, I’ll take it. Portfolio 3’s unexpected gain helped soften the blow, and seeing some stocks hit all-time highs was a nice silver lining. With tariff concerns looming and volatility sticking around, the next few weeks could be just as unpredictable. But hey, that’s the market—never a dull moment! 😊
Monthly Market and Portfolio Review
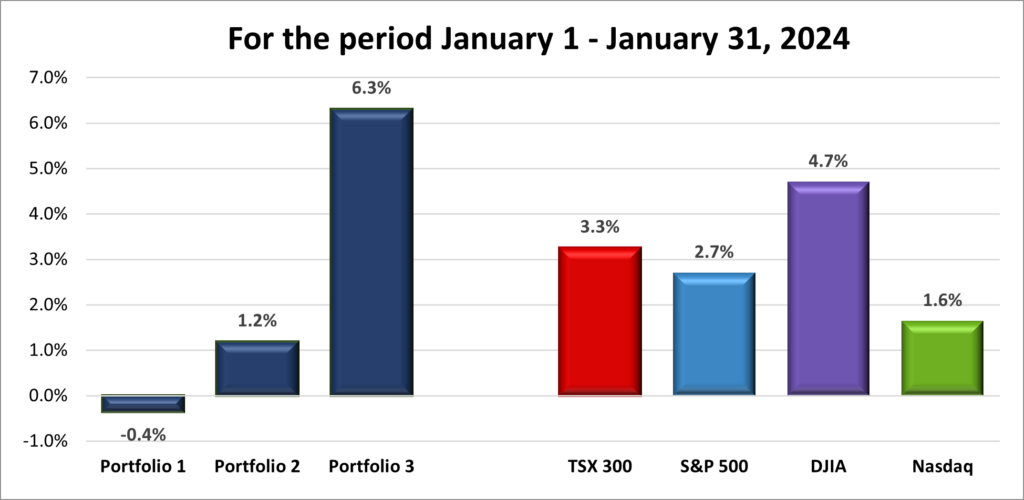
For the month, the TSX (SPTSX) increased 3.3%, the S&P (SPX) rose 2.7%, the DJIA (INDU) surged 4.7% and the Nasdaq (CCMP) gained 1.6%.
![]() January was a comeback month for the markets, with all four major North American indexes finishing in the green and getting back in the win column, as shown in the monthly progress chart above. The rally was fueled by strong earnings, solid economic data, and the Fed’s decision to keep interest rates steady. Excitement around AI also played a big role, pushing technology stocks higher—at least for most of the month. But it wasn’t all smooth sailing. Growing concerns over new trade tariffs on the US’s top three trading partners rattled investors, and AI momentum hit a wall in the final week after a Chinese AI firm introduced a platform that rivaled much pricier American alternatives, raising questions about future AI spending.
January was a comeback month for the markets, with all four major North American indexes finishing in the green and getting back in the win column, as shown in the monthly progress chart above. The rally was fueled by strong earnings, solid economic data, and the Fed’s decision to keep interest rates steady. Excitement around AI also played a big role, pushing technology stocks higher—at least for most of the month. But it wasn’t all smooth sailing. Growing concerns over new trade tariffs on the US’s top three trading partners rattled investors, and AI momentum hit a wall in the final week after a Chinese AI firm introduced a platform that rivaled much pricier American alternatives, raising questions about future AI spending.
Up north, the TSX rode the wave of another interest rate cut, economic growth, and a surge in gold stocks as investors looked for safety amid the tariff uncertainty. But with Canada in the crosshairs of potential trade restrictions, volatility in the Canadian market spiked.
January got the new year off to solid start, with the DJIA and TSX leading the way thanks to their heavier weighting in traditional industries. While strong earnings and AI enthusiasm helped fuel gains, trade tensions kept markets on edge. With tariffs set to take effect on February 1, the next few months could be a wild ride. Buckle up! 😊
![]() As for the three portfolios, I was pleasantly surprised by Portfolio 3’s standout performance in January, crushing the competition by outpacing the next best portfolio fivefold and even outperforming all four major indexes. The only downside? Portfolio 1 ended the month in the red, keeping it from a clean sweep of all portfolios ending in the green. Overall, it was a solid month for the portfolios, but it would’ve been even better if Portfolio 1 had joined the others in the win column—and even better if the other two had matched Portfolio 3’s stellar performance! 😊
As for the three portfolios, I was pleasantly surprised by Portfolio 3’s standout performance in January, crushing the competition by outpacing the next best portfolio fivefold and even outperforming all four major indexes. The only downside? Portfolio 1 ended the month in the red, keeping it from a clean sweep of all portfolios ending in the green. Overall, it was a solid month for the portfolios, but it would’ve been even better if Portfolio 1 had joined the others in the win column—and even better if the other two had matched Portfolio 3’s stellar performance! 😊
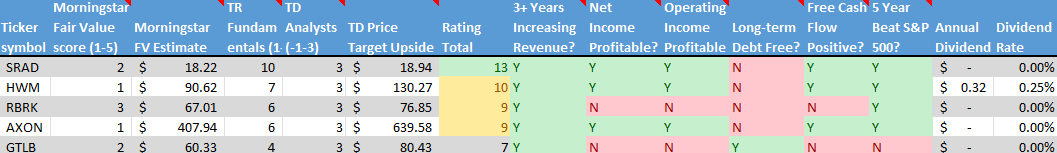
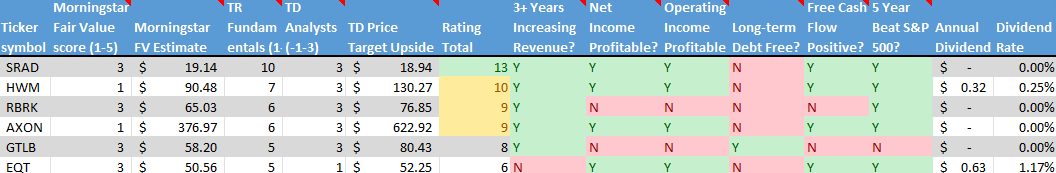
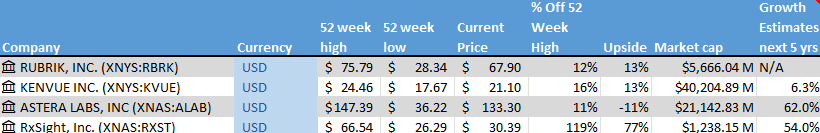
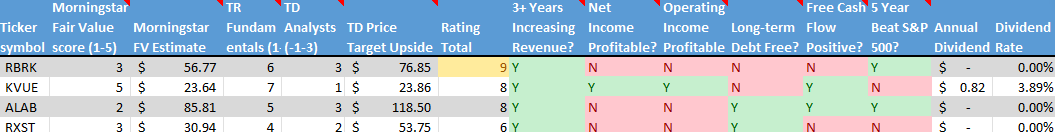
Companies on the Radar
 This past week, no new companies made it onto my radar. However, I did make a change by removing EQT Corporation (NYSE: EQT), the American natural gas company, from the list. While the company’s five-year growth estimate of 113% looks impressive on paper, it’s still just an estimate. Plus, with plenty of Canadian-listed natural gas companies offering similar potential, I’m better off avoiding the extra cost of foreign exchange.
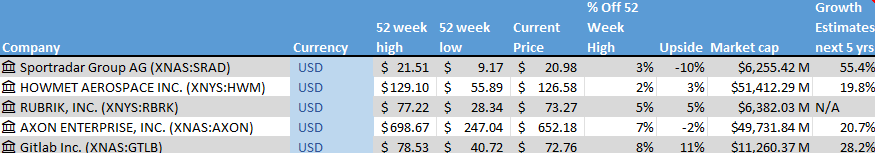
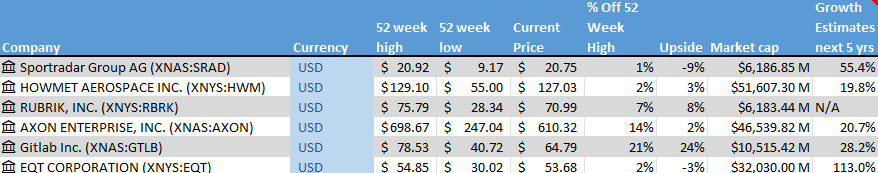
With that, my radar list is now down to these five companies:
- Sportradar Group AG (NASD: SRAD): A mid-cap Swiss company specializing in sports data, content, and integrity services that support businesses in sports, media, and betting industries.
- Howmet Aerospace Inc. (NYSE: HWM): A large-cap American company producing cutting-edge engineered products like airfoils, titanium forgings, and forged aluminum wheels for aerospace, energy, and transportation sectors.
- Rubrik, Inc. (NASD: RBRK): a high-growth, large-cap American cybersecurity firm.
- Axon Enterprise, Inc. (NASD: AXON): A large-cap innovator in body cameras, TASER devices, and cloud-based evidence management software, serving law enforcement and public safety agencies.
- GitLab Inc. (NASD: GTLB): A large-cap American firm offering software tools that developers can use for coding, project management, and workflow automation.
As always, these are not buy recommendations – be sure to do your own research and make decisions that align with your personal financial goals!
The Radar Check was last updated January 31, 2025.
Portfolio Update
Portfolio 1
Portfolio 1 for the week ended January 31, 2025: DOWN ![]()
- CrowdStrike announced they achieved a perfect score on an industry test for ransomware detection, protection, and accuracy, sending the share price up almost 7% for the week. So much for companies leaving CrowdStrike following last year’s botched rollout of an update. 😊
- The US government is weighing additional restrictions on Nvidia’s H20 AI chips exported to China. These chips were specifically designed for the Chinese market to comply with earlier trade restrictions, but they may now face even tighter controls.
Activity
Sold: BCE Inc. (TSE: BCE) I first invested in BCE back in September 2019, drawn by its stability and solid dividend. As the share price fell, the dividend yield climbed to 8.6%, prompting me to buy more shares, thinking the stock had bottomed out. Unfortunately, the price continued to decline, and I’m now concerned that the current 11.9% dividend may not be sustainable.
Over the past five years, BCE’s stock has dropped 45%, while the broader market has posted gains. This underperformance raised a red flag for me. Key concerns include BCE’s high debt levels, which limit its ability to invest in growth, and its inconsistent earnings. Despite a slight increase in free cash flow, the company missed revenue and earnings estimates, signaling potential future struggles.
My biggest concern is BCE’s dividend. With an 11.56% yield, it looks attractive, but if the company’s financial health continues to weaken, a dividend cut could be on the horizon, further dragging down the stock price.
Given these factors, I sold some BCE shares to limit potential losses but kept a few to continue benefiting from the dividend. I’ll reinvest the proceeds into more stable or promising opportunities for growth.
Sold: General Motors (NYSE: GM) I initially invested in GM because I was excited about their innovative Ultium battery powerplant, the promising Cruise robo cars, and their lineup of electric vehicles (EV). However, they recently decided to discontinue the Cruise robo cars to shift their focus towards integrating advanced driver assistance systems (ADAS) into their vehicles. Additionally, GM has turned back to building conventional vehicles, particularly plug-in hybrid electric vehicles (PHEVs), due to challenges they faced with slowing EV sales. None of these prompted me to sell my shares.
However, the looming threat of US tariffs on Canada and Mexico – which could seriously disrupt GM’s tightly integrated supply chain – led me to reluctantly sell my shares. Adjusting to new trade rules won’t happen overnight, and higher costs could weaken sales. If revenues take a hit, the stock price might struggle for a while. Of course, that’s just my take – but I’ve been wrong before! 😊
That said, I still believe GM is a solid long-term investment. The uncertainty around tariffs and supply chain disruptions just made me cautious for now. If things settle, I wouldn’t rule out becoming a shareholder again down the road.
Dividends
Dividends Received this week for the following companies:
No dividends this past week.
Quarterly Reports
General Motors Company
Fourth quarter 2025 financial results on January 28, 2025
Apple Inc.
First quarter 2025 financial results on January 30, 2025
Celestica Inc.
Fourth quarter 2024 financial results on January 30, 2025
Canadian National Railway Company
Fourth quarter 2024 financial results on January 30, 2025
Visa Inc.
First quarter 2025 financial results on January 30, 2025
Portfolio 2
Portfolio 2 for the week ended January 31, 2025: DOWN ![]()
- Guardant Health (NASD: GH) announced their Shield product has been selected by the Abu Dhabi Department of Health for their Blood-Based Colorectal Cancer Screening Program. The Shield test is a non-invasive blood-based screening program for colorectal cancer.
Activity
No significant activity to report this week.
Dividends
Dividends Received this week for the following companies:
Canadian $
South Bow Corp (TSE: SOBO)
US $
No US$ dividends this past week.
Quarterly Reports
Microsoft Corp.
Second quarter 2025 financial results on January 29, 2025
Brookfield Renewable Partners L.P.
Fourth quarter 2024 financial results on January 31, 2025
Portfolio 3
Portfolio 3 for the week ended January 31, 2025: UP ![]()
- The Royal Bank of Canada (TSE: RY) announced they were leaving the Net-Zero Banking Alliance, following a similar move by the other major Canadian banks as well as the big US banks. The Net-Zero Banking Alliance was created to encourage financial institutions to limit the effects of climate change and push toward achieving net-zero emissions.
Activity
No significant activity to report this week.
Dividends
Dividends Received this week for the following companies:
No dividends this past week.
Quarterly Reports
Microsoft Corp.
See report under Portfolio 2.
Real Matters Inc.
First quarter 2025 financial results on January 31, 2025
Brookfield Renewable Partners L.P.
See report under Portfolio 2.
 payouts. Over time, those extra shares generate even more dividends, creating a powerful snowball effect. Personally, I have every new holding in my accounts set to reinvest automatically—it’s a simple step, but the compounding effect over the years could be extraordinary.
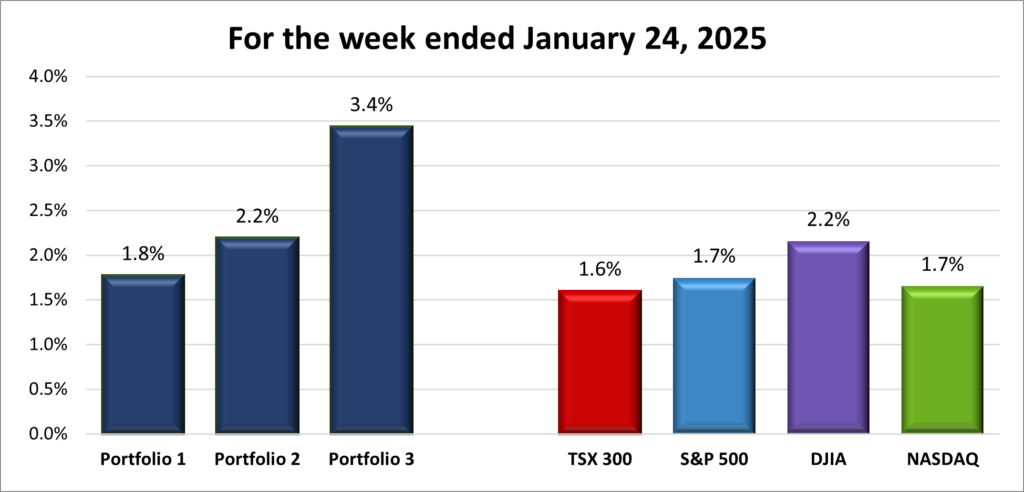


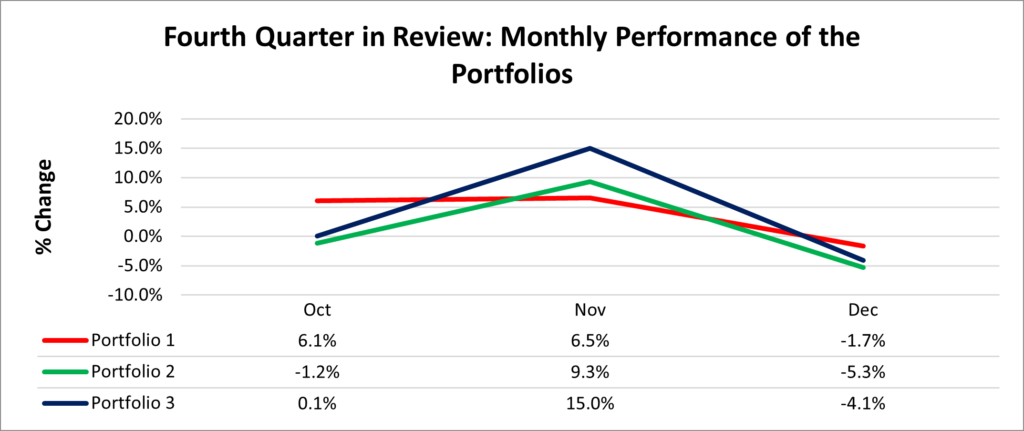
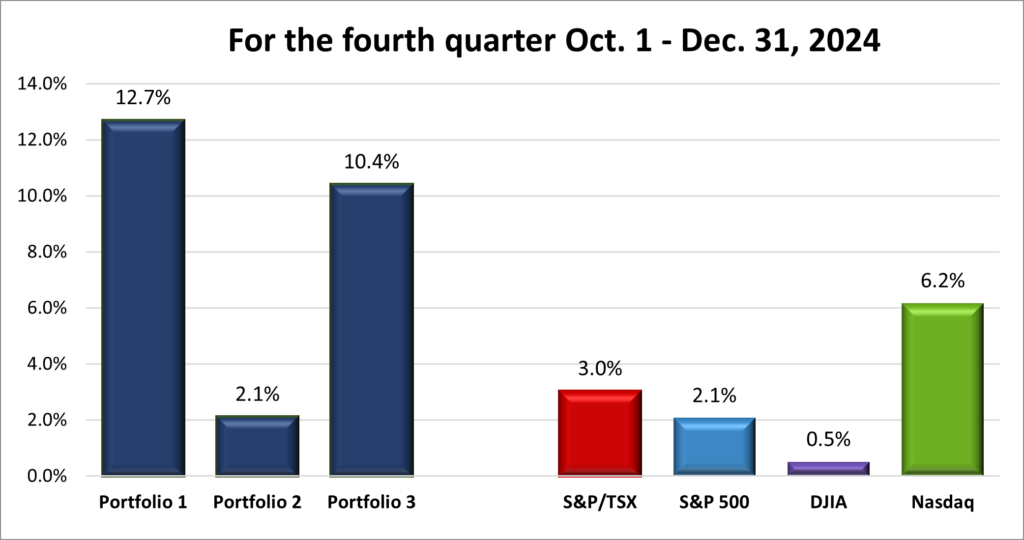
 As we say goodbye to 2024 and step into the new year, it’s the perfect time to reflect on how the North American markets closed out the year. After an impressive third quarter, I was hopeful that the momentum would carry into the fourth—and while it wasn’t a fireworks finish, the markets held steady. All four major indexes – the Toronto Stock Exchange Composite Index (TSX), the S&P 500 Index (S&P), the Dow Jones Industrial Average (DJIA), and the Nasdaq Composite Index (Nasdaq) – posted gains, with the Nasdaq leading the charge, gaining even more steam, while the others navigated a mix of challenges and opportunities.