10 Common Investing Mistakes (And How to Avoid Them!)
Investing is a great way to build wealth, but mistakes can cost you. Trust me – I’ve made plenty. ☹ Whether you’re just starting out or have been at it for a while, knowing what not to do is just as important as knowing what to do.
To help you navigate the investing world with confidence, here are 10 common pitfalls and how to avoid them. The good news? Once you recognize these mistakes, you can sidestep them and make smarter decisions. 😊 Let’s begin!
1. Skipping Research
Jumping into a stock without research is like driving blindfolded. Before investing, understand what the company does, its financial health, and its future prospects. Resources like Yahoo Finance, Bloomberg, and company reports are great places to start. (I also shared my go-to investing tools in my August 15, 2024, post.)
2. Letting Emotions Drive Decisions
Markets rise and fall – it’s normal. But panic selling in a downturn or chasing hype can wreck your returns. Have a strategy and stick to it.
Back in the late ‘90s, I got caught up in dot-com hype and bought 360 Networks just because everyone was talking about it. It went bankrupt a few years later. Lesson learned. ☹
3. Putting All Your Eggs in One Basket
If your portfolio is too focused on one industry (like tech stocks), a downturn can hit hard. Diversification – spreading your investments across sectors – helps manage risk.
Coming from a tech background, my early portfolio was tech heavy. I’ve worked hard to diversify over the years, but my portfolios are still technology oriented. Diversification is key!
4. Ignoring Fees
Fees may seem small, but they add up fast. Frequent stock trading means more transaction costs, while high mutual fund fees can cost you thousands over time.
Low-cost index funds and ETFs help keep more of your money working for you rather than someone else.
5. Chasing Hot Stocks
A stock that soared last year won’t necessarily keep climbing. Instead of chasing past winners, focus on company fundamentals, growth potential, and valuation.
I learned this the hard way during the dot-com bubble – many hyped-up stocks crashed while solid, less sexy companies thrived. Sometimes, the best investments haven’t made headlines yet.
6. Expecting Quick Riches
Investing isn’t a shortcut to wealth. Jumping in and out of stocks often leads to losses (and extra trading fees). Think long-term and let compounding do the heavy lifting.
7. Investing Without a Goal
Would you take a road trip without a destination? Investing works the same way. Define your goals – whether it’s retirement, buying a house, or financial freedom – so your strategy matches your needs.
When I first started, I had no real plan – just a goal to “make money.” Since getting back into investing with clear goals, I make better decisions without stressing over short-term swings.
8. Forgetting About Taxes
The Canada Revenue Agency (or Uncle Sam’s IRS for US investors) always gets its cut. Capital gains, dividends, and interest can eat into returns.
Use tax-advantaged accounts like RRSPs and TFSAs to keep more of your money compounding.
9. Following the Hype
Remember GameStop (NASD: GME)? Just because a stock is popular doesn’t mean it’s a good investment. FOMO (fear of missing out) can be costly – always do your own research and trust your strategy.
⚖️ 10. Ignoring Risk Management
No investment is risk-free, but you can manage risk by diversifying and reviewing your portfolio regularly. Higher returns often come with higher risks, so invest within your comfort level.
Final Thoughts
Mistakes are part of investing, but learning from them is what matters. Stay informed, stick to a plan, and keep emotions in check. And when you do slip up (because we all do!), treat it as a learning opportunity.
Every great investor has stumbled – the key is bouncing back smarter.
Investing is a journey, and avoiding these common mistakes can help you save money and stay on track to reach your goals. The markets are always changing, bringing both opportunities and challenges—and this past week was no exception! Let’s take a look at what moved the markets and how the portfolios fared.
Items that may only interest or educate me ….
Canadian Economic news, US Economic news, Nvidia Beats Estimates, Continues to Drive AI, …
Canadian Economic news
This past week’s key economic data that the Bank of Canada (BoC) considers when deciding whether to raise or lower the interest rate.
Gross Domestic Product (GDP)
Canada’s economy grew 2.6% in the fourth quarter, beating analysts’ expectations of 1.9% and building on the 2.2% growth in the third quarter. This stronger-than-expected performance was driven by household spending, exports, and business investment.
However, on a per capita basis, GDP only inched up 0.2% in the fourth quarter after a 0.1% dip in the previous quarter. For the full year, GDP per capita declined 1.4%, following a decline of 1.3% in 2023 for a second consecutive annual drop.
On a monthly basis, GDP grew 0.2% in December, rebounding from November’s 0.2% decline, though it came in just shy of the 0.3% growth analysts had expected. Both services and goods-producing industries contributed to the gains, with retail and utilities leading the way. Early estimates suggest that January continued the positive trend, with a 0.3% increase.
This latest data highlights a growing economy heading into 2025, supported by steady consumer spending and business activity. That said, external risks like trade tensions could still pose challenges in the months ahead.
Canadian market volatility
Canada’s Volatility Index (VIXC) started the week at 14.46, staying mostly between 13.5 and 15.0 for the rest of the week. Despite renewed tariff threats, the Canadian market appeared unfazed, with the country’s fear gauge slipping to 12.85 by the end of the week. It seems investors have grown numb to the ongoing trade uncertainties.
For those unfamiliar with the VIXC (traded as VIXI on the Toronto Stock Exchange), think of it as Canada’s market “stress-o-meter.” Readings below 10 indicate calm seas, while 10 to 20 signals typical market ups and downs. If the VIXC climbs above 20, it’s a sign of rising uncertainty, and things can start to feel a bit more turbulent.
US Economic news
This past week’s key data points that the Federal Reserve (Fed) considers when deciding whether to raise or lower the interest rate.
Consumer Confidence Index (CCI)
Consumer confidence took a sharp hit in February, according to the latest CCI report from The Conference Board. The index dropped to 98.3, down from 105.3 in January – its biggest monthly decline since August 2021. Economists had expected a smaller dip to 103, making this drop a surprise.
The Present Situation Index, which measures sentiment on current business and job conditions, slipped 3.4 points to 136.5. The bigger concern is the Expectations Index, which gauges the outlook for the next six months. It fell 9.3 points to 72.9, dropping below the key 80-point recession warning level for the first time since June 2024.
Confidence declined across most age and income groups, and inflation expectations jumped – with consumers now expecting prices to rise 6% over the next year, up from 5.2% in January. This reflects growing concerns about stubborn inflation and rising costs for essentials.
Why does this matter? Consumer spending drives two-thirds of the US economy. If people start feeling uneasy about their finances, they may cut back, potentially slowing economic growth. While confidence held steady last year, recent months show a downward trend amid inflation worries, economic uncertainty, and potential trade tariffs.
This latest drop also coincides with President Trump’s return to office and his administration signaling possible tariffs on imports from American allies. While it’s too early to say how this will play out, uncertainty over trade policies could be weighing on sentiment.
This drop in confidence signals growing consumer caution—something to keep an eye on as markets respond to shifting sentiment.
Gross Domestic Product (GDP)
The US economy continued to grow in the fourth quarter, with GDP rising 2.3%, according to the second estimate from the Bureau of Economic Analysis (BEA). That’s a slight bump from the initial 2.2% estimate and in line with analysts’ expectations. However, it marks a slowdown from the 3.1% growth recorded in the third quarter.
The growth was fueled by consumer and government spending, though business investment declined, which could indicate some caution among companies. For the full year of 2024, the economy expanded by 2.8%, driven by steady consumer spending, investment, government spending, and exports.
While the economy is still moving forward, this report suggests a slower, more cautious pace of growth. Households are still spending, but inflation and economic uncertainty might be making them a bit more careful. Meanwhile, businesses pulling back on investment could impact certain sectors that rely on big capital spending.
For investors, this cooling growth might mean more measured corporate earnings ahead, and possibly a shift in market sentiment. A slowdown isn’t necessarily bad – it just means the economy is settling into a more moderate pace after a strong stretch. 😊
Personal Consumption Expenditures (PCE)
The latest PCE price index report from the BEA showed inflation ticked up 0.3% in January, matching December’s increase. On a year-over-year basis, inflation cooled slightly to 2.5%, down from 2.6% in December.
The Fed’s preferred inflation measure, core PCE (which excludes food and energy prices), also ticked up 0.3% for the month, a slight increase from 0.2% in December. Annually, core PCE rose 2.6%, in line with expectations but down from 2.9% a year ago.
While inflation is still easing, it remains above the Fed’s 2% target, suggesting the road to lower inflation could be bumpy. Despite this progress, the Fed is expected to hold interest rates steady at 4.25% – 4.5% for now. A March rate cut is unlikely, with most analysts not expecting any moves until at least June, assuming inflation continues to cool and economic conditions support it. However, ongoing uncertainty – such as tariff threats and potential government job cuts – could impact consumer confidence and spending, adding another layer of complexity to the Fed’s decision-making.
American market volatility
The CBOE Volatility Index (VIX) – often called the market’s “fear gauge” – started the week at 18.08 and hovered between 17.50 and 20.0 before spiking to 22.31, its highest level since December 19, 2024. It then closed the week at 20.78, reflecting heightened market anxiety.
For most of the week, the VIX held steady between 17.5 and 20, as investors grappled with concerns over tariffs and their potential impact on an economy already showing signs of slowing. However, volatility surged on Friday, pushing the VIX to 22.31 after a heated exchange in which President Trump and Vice President Vance criticized Ukraine’s President Zelensky for not showing enough gratitude for US support, sparking fresh geopolitical tensions. The index later eased slightly but still closed the week elevated at 19.63, signaling lingering market uncertainty.
For those new to the VIX, think of it as the market’s stress meter. A reading below 12 means calm waters, while 12 to 20 signals normal market swings. Above 20, investors are getting nervous, and anything over 30 usually signals serious turmoil. With the VIX closing above 20, it suggests traders are feeling uneasy about what’s ahead.
Nvidia Beats Estimates, Continues to Drive AI
With a market cap north of US$3 trillion, Nvidia (NASD: NVDA) is one of the most closely watched stocks, and this week’s earnings report was arguably the most anticipated in a long time. Investors were eager to see whether demand remained strong for Nvidia’s high-end processors, given its dominance in artificial intelligence (AI) hardware. The company’s chips are essential for AI applications across big tech, IT infrastructure, and sectors like architecture and engineering, making Nvidia’s financial performance a key indicator of the AI industry’s health.
Fortunately, Nvidia didn’t disappoint yet again. The company beat expectations, reporting record fourth-quarter revenue of $39.3 billion – up 12% from the previous quarter and a staggering 78% year-over-year. Full-year revenue hit $130.5 billion, marking an eye-popping 114% increase from the prior year. Earnings per diluted share for the quarter were $0.89, up 14% sequentially and 82% from a year ago. Not bad. 😊
Investors initially cheered Nvidia’s strong results, which reaffirmed its leadership in AI and data centres. The report was further proof that the company remains at the epicentre of the AI revolution and a strong validation of its strategy and growth drivers. However, concerns over potential margin pressures and whether Nvidia can sustain its rapid growth sparked some unease. This led investors to question whether the AI-driven rally that has propelled markets over the past two years is losing steam. As a result, heavyweight tech stocks saw a selloff as investors rotated into more defensive sectors.
Now the second-largest company in North America, Nvidia’s stock moves the S&P 500 and other indexes more than any company except Apple. The AI boom – led by Nvidia and a handful of other key players – has been a major driver behind the S&P’s record-breaking rally over the past two years, accounting for more than 20% of the index’s total return last year.
CEO Jensen Huang highlighted surging demand for Blackwell AI supercomputers and rapid advancements in AI technology as key performance drivers. So far, there hasn’t been a demand slump for Nvidia’s next-gen processors since DeepSeek broke onto the scene. Some key takeaways:
- AI and Data Centre Dominance: Nvidia’s continued strength in these segments isn’t by chance – it’s the result of years of focused R&D and strategic investment, solidifying its competitive edge.
- Explosive Revenue Growth: The company’s ability to post double-digit percentage gains quarter-over-quarter and year-over-year reinforces its steep growth trajectory, though it also raises expectations for future performance.
- Strong Guidance and Market Confidence: Nvidia’s upbeat outlook, particularly around AI supercomputers, has reassured investors. However, external risks like supply chain challenges and broader economic trends are still factors to watch.
For everyday investors, this report underscores Nvidia’s role as a bellwether for AI and the semiconductor space. Its ability to sustain this growth in an increasingly competitive landscape is a testament to both its innovation and market position.
Weekly Market and Portfolio Review
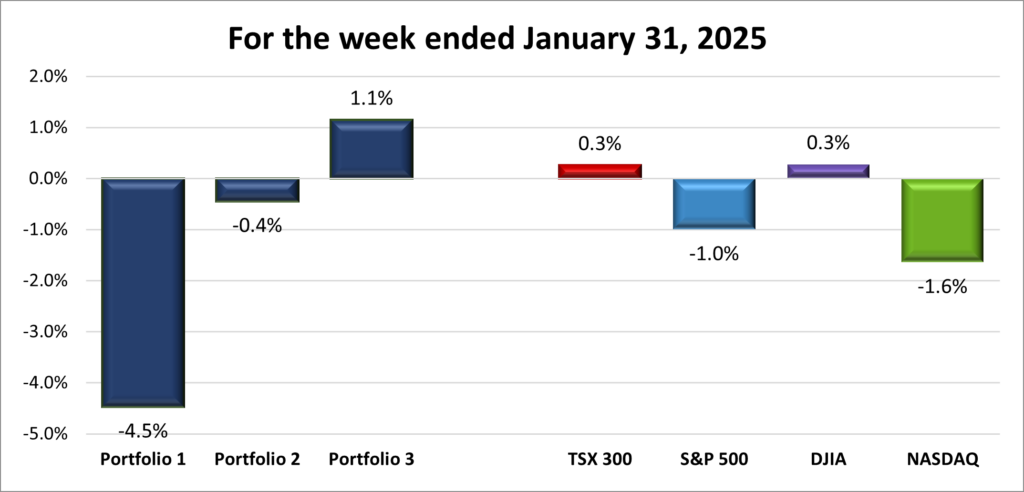
For the week, the TSX (SPTSX) advanced 1.0%, the S&P 500 (SPX) fell 1.0%, the DJIA (INDU) added 1.0% while the Nasdaq (CCMP) dropped 3.5%.
| Index | Weekly Streak |
| TSX: | 1 – week winning streak |
| S&P: | 2 – week losing streak |
| DJIA: | 1 – week winning streak |
| Nasdaq: | 2 – week losing streak |
![]()
![]() Markets wrapped up a volatile week, with the Toronto Stock Exchange Composite Index (TSX) and the Dow Jones Industrial Average (DJIA) starting winning streaks, while the S&P 500 Index (S&P) and the Nasdaq Composite Index (Nasdaq) extended their losses. Investors grappled with mixed corporate earnings, signs of a slowing US economy, geopolitical tensions, and renewed tariff threats.
Markets wrapped up a volatile week, with the Toronto Stock Exchange Composite Index (TSX) and the Dow Jones Industrial Average (DJIA) starting winning streaks, while the S&P 500 Index (S&P) and the Nasdaq Composite Index (Nasdaq) extended their losses. Investors grappled with mixed corporate earnings, signs of a slowing US economy, geopolitical tensions, and renewed tariff threats.
Once again, tariffs took centre stage. President Trump’s threat of 25% tariffs on the European Union added to concerns that prolonged trade uncertainty could weigh on economic growth. While investors are increasingly tuning out the rhetoric, businesses face real challenges planning for the future, potentially delaying investments and hiring. Meanwhile, Trump’s efforts to dismantle parts of the federal bureaucracy have fueled further uncertainty, driving consumer confidence to its sharpest decline since August 2021.
The Nasdaq suffered its worst week since September 2023 after Nvidia posted better-than-expected results but concerns over potential profit-margin pressure and whether it can sustain its rapid growth had investors second-guessing the AI rally. This sparked a selloff in heavyweight tech stocks as investors shifted toward more defensive sectors.
On Friday, markets got a lift from better-than-expected US inflation data, but the good news was overshadowed by a heated exchange between Trump and Ukraine’s President Zelensky over US financial and military aid. The fallout left a US – Ukraine rare earth minerals deal unsigned, complicating peace talks and adding to geopolitical tensions.
Looking ahead, next week brings key jobs data from both Canada and the US, along with the potential implementation of US tariffs on Canadian goods starting March 4. Hopefully, markets can shake off the uncertainty and find some momentum in the week ahead.
| Portfolio | Weekly Streak |
| Portfolio 1: | 2 – week losing streak |
| Portfolio 2: | 1 – week winning streak |
| Portfolio 3: | 2 – week losing streak |
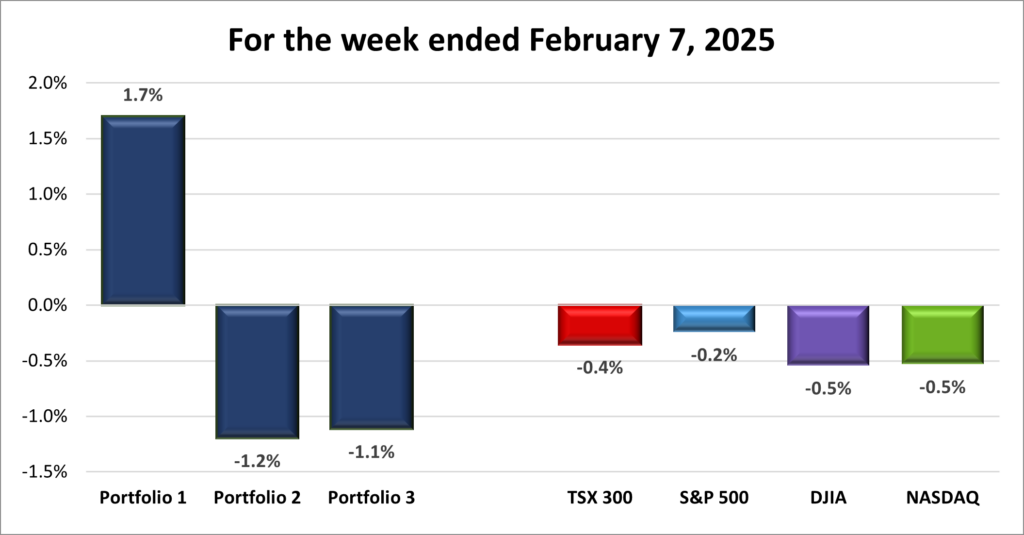
![]() It was a choppy week, and unfortunately, the technology sector – especially the Magnificent 7 companies – took a beating. Since all three portfolios have a tech bias, they weren’t spared from the turbulence. As shown in the weekly performance chart below, all three finished in the red. Not exactly the week I was hoping for. ☹
It was a choppy week, and unfortunately, the technology sector – especially the Magnificent 7 companies – took a beating. Since all three portfolios have a tech bias, they weren’t spared from the turbulence. As shown in the weekly performance chart below, all three finished in the red. Not exactly the week I was hoping for. ☹
Portfolio 1 had the toughest time, tumbling 2.6% as only 35% of its holdings managed gains. There were a few bright spots—Berkshire Hathaway (NYSE: BRK.B) hit an all-time high, and BSR Real Estate Investment Trust (TSE: HOM.U) surged 11%. But that wasn’t enough to offset some steep declines, with Celsius Holdings (NASD: CELH) dropping 23%, Navitas Semiconductor Corp (NASD: NVTS) falling 21%, and Andlauer Healthcare Group (TSE: AND) slipping 11%.
Portfolio 2 was the only one to eke out a gain, inching up 0.1% with 37% of its holdings ending in the green. No major swings, but South Bow (TSE: SOBO) hit a record high.
Portfolio 3 landed somewhere in between, declining 1.2% with only 26% of its holdings ending higher – the lowest percentage of winners among the three. There were no standout gainers, and the biggest loss came from TELUS Digital (TSE: TIXT), which sank 11%.
Despite the rough week, volatility is part of the game – especially with a tech-heavy focus. With key economic data on deck next week, a shift in sentiment could help turn things around. If you’re investing in high-growth, volatile tech stocks, you’ve got to be ready to take a few bruises along the way. Here’s hoping for fewer bruises and a stronger showing next week! 😊

Monthly Market and Portfolio Review
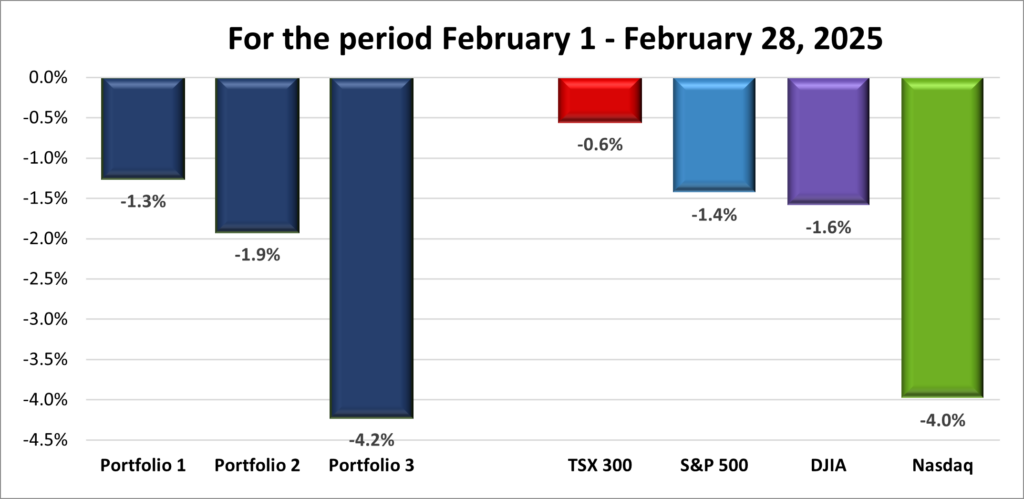
For February, the TSX (SPTSX) slipped 0.6%, the S&P 500 (SPX) lost 1.4%, the DJIA (INDU) slid 1.6% and the Nasdaq (CCMP) plunged 4.0%.
![]() February was quite the ride for the North American markets, with plenty of ups and downs. As shown in the monthly progress chart above, the American markets experienced a big drop at the end of the month, giving back much of the gains seen earlier in February.
February was quite the ride for the North American markets, with plenty of ups and downs. As shown in the monthly progress chart above, the American markets experienced a big drop at the end of the month, giving back much of the gains seen earlier in February.
Several factors contributed to the wild swings in the market. One of the biggest drivers was the announcement of potential tariffs on Canada, Mexico, and China, which caused initial uncertainty. While this sparked worries about how these tariffs might impact the economy, by month’s end, many investors began to tune out the ongoing tariff threats. Still, concerns about how tariffs might hurt consumer confidence were felt throughout the month.
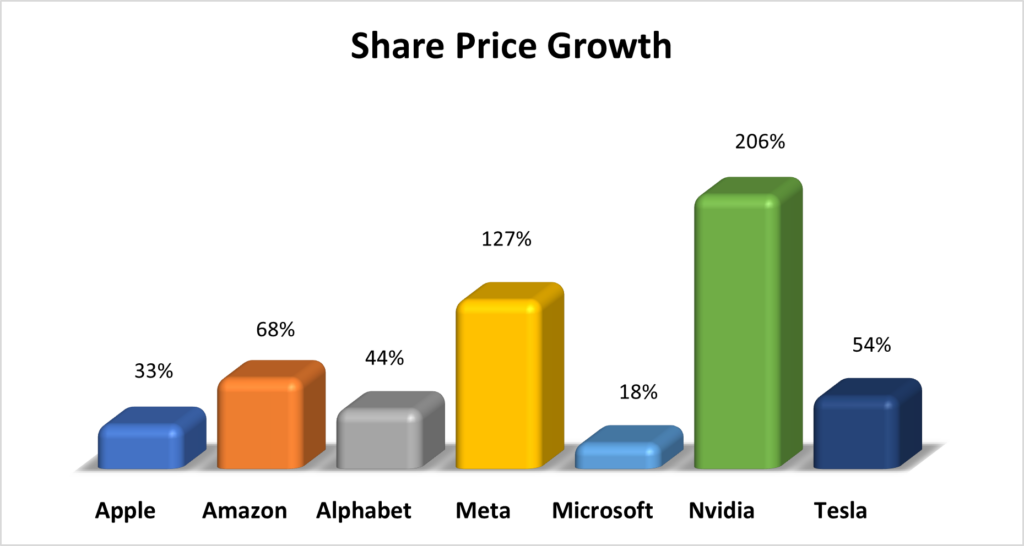
The technology sector, always a rollercoaster, was hit hard. Companies like Nvidia and Tesla (NASD: TSLA) saw their stock prices drop, driven by mixed earnings reports and shifts in market sentiment. On top of that, weaker-than-expected consumer confidence, rising inflation worries, and the fear of higher interest rates put additional pressure on the markets. Many investors were concerned that potential trade wars could lead to rising prices, longer-lasting higher interest rates, a cooling job market, and a slowing economy
Meanwhile, in Canada, the tariff situation was front and centre. The ongoing uncertainty surrounding US trade policies, especially the looming threat of new tariffs, created volatility in Canadian markets as investors worried about how it would impact business investments. However, the outlook wasn’t all doom and gloom. Canada’s economy showed resilience, with growth projected to rise to 1.8% in 2025 – outpacing its potential output. Inflation was expected to remain near the Bank of Canada’s 2% target, providing some stability. Plus, strong earnings from Canada’s big six banks and a growing GDP helped offset some of the market losses.
As February wrapped up, markets faced increased uncertainty with the ongoing Ukraine-Russia conflict, inflation concerns, and signs of a slowing US economy. Meanwhile, Canada’s economy showed signs of growth, though the lingering threat of tariffs remained a wildcard.
![]() With all four indexes ending February in the red, it’s no surprise all three portfolios followed suit. Still, that doesn’t make it any less disappointing. ☹ Last month, I had hoped Portfolio 3’s 6.5% gain would set the tone – but I should have specified positive gains. Instead, all three landed in the red.
With all four indexes ending February in the red, it’s no surprise all three portfolios followed suit. Still, that doesn’t make it any less disappointing. ☹ Last month, I had hoped Portfolio 3’s 6.5% gain would set the tone – but I should have specified positive gains. Instead, all three landed in the red.
Portfolio 1 started strong with a two-week win streak but was dragged down by the Magnificent 7 selloff, ending the month down 1.3%. Concerns over slowing AI growth hit tech stocks hard.
Portfolio 2 seesawed between red and green weeks before finishing down 1.9%. It was the least volatile of the three, staying within 1.2% of the flatline.
Portfolio 3 took the biggest hit, dropping 4.2%. Other than a strong second week, it lost ground in three of the four weeks – tough to get ahead when you’re always playing defense.
February didn’t go as I’d hoped, but that’s the reality of investing – ups, downs, and plenty of surprises. With earnings season wrapped up, March will be driven by economic data, tariff concerns, and ongoing political and geopolitical uncertainty. A rebound is always possible, but volatility looks likely. Here’s to a stronger month ahead – hopefully with greener pastures where the bulls can run wild! 😊
Companies on the Radar
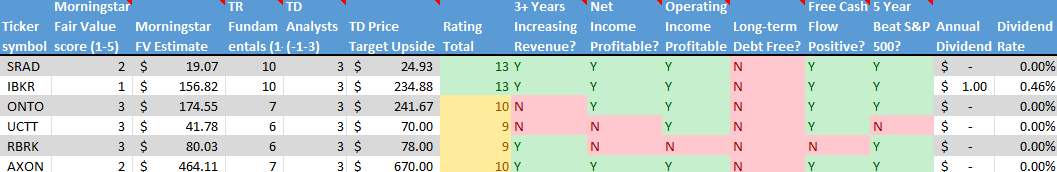
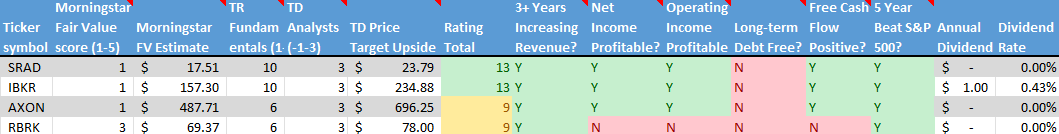
 No new companies caught my attention this past week, but as expected, I dropped Onto Innovation (NYSE: ONTO). When a stock lands on my radar, I aim to sum it up in a sentence or two for this ‘Companies on the Radar’ section. No matter how hard I tried, I just couldn’t clearly explain what Onto Innovation actually does – and if I can’t understand it, I’m not investing in it. With so many great companies out there, I stick to Charlie Munger’s advice: ‘If something is too hard, we move on to something else.’ So, I did. 😊
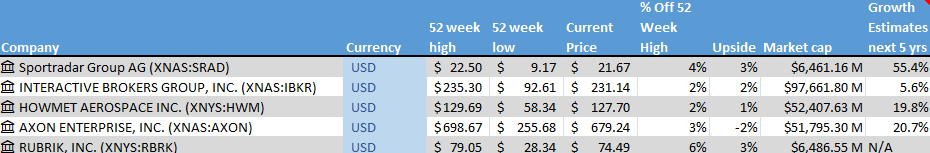
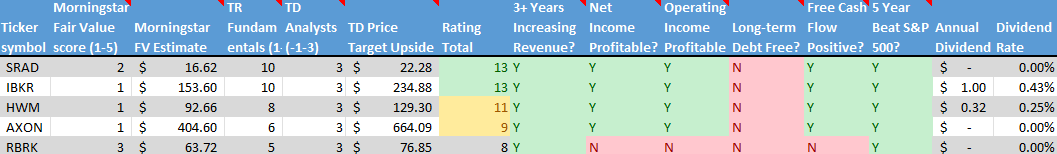
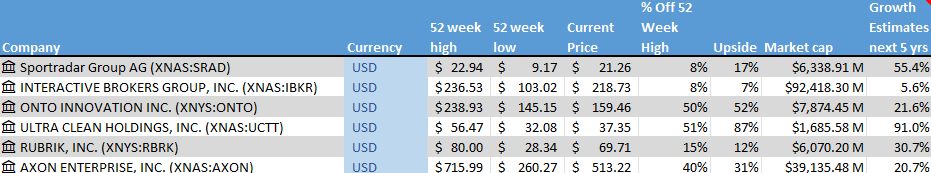
With that decision, my radar list is down to five companies below:
- Sportradar Group AG (NASD: SRAD): A mid-cap Swiss company specializing in sports data, content, and integrity services that support businesses in sports, media, and betting industries.
- Interactive Brokers (NASD: IBKR), a large-cap, American online brokerage firm known for its advanced trading platform used by professional of all levels.
- Ultra Clean Holdings (NASD: UCTT): a small cap American company that specializes in critical components and ultra-high purity cleaning and analytical services in the chips industry.
- Rubrik, Inc. (NASD: RBRK): a high-growth, large-cap American cybersecurity firm.
- Axon Enterprise, Inc. (NASD: AXON): A large-cap American innovator in body cameras, TASER devices, and cloud-based evidence management software, serving law enforcement and public safety agencies.
As always, these are not buy recommendations – be sure to do your own research and make decisions that align with your personal financial goals!
The Radar Check was last updated February 28, 2025.


Portfolio Update
Portfolio 1
Portfolio 1 for the week ended February 28, 2025: DOWN ![]()
- Amazon’s (NASD: AMZN) cloud division, Amazon Web Services (AWS), has unveiled its own quantum computing chip, Ocelot, entering the race alongside Alphabet’s (NASD: GOOGL) Google and Microsoft (NASD: MSFT). While still a prototype with only a fraction of the power needed for practical applications, AWS believes Ocelot could shorten its path to a commercial quantum system by as much as five years.
Activity
No significant activity to report this week.
Dividends
Dividends Received this week for the following companies:
Companies followed by DRIP (Dividend Re-Investment Plan) indicate additional shares were purchased with the dividend. Any cash leftover was added to the cash balance.
Canadian $
Dream Industrial Real Estate Investment Trust (TSE: DIR.UN) DRIP
Decisive Dividend Corp (TSE: DE)
US $
Costco Wholesale Corp (NASD: COST)
Quarterly Reports
Navitas Semiconductor
Fourth quarter 2024 financial results on February 24, 2025
The Bank of Nova Scotia
First quarter 2025 financial results on February 25, 2025
The Home Depot
Fourth quarter 2024 financial results on February 25, 2025
Andlauer Healthcare Group Inc.
Fourth quarter 2024 financial results on February 26, 2025
Nvidia Corporation
Fourth quarter 2024 financial results on February 26, 2025
Magnite, Inc.
Fourth quarter 2024 financial results on February 26, 2025
TD Bank Group
First quarter 2025 financial results on February 27, 2025
Docebo Inc.
Fourth quarter 2024 financial results on February 28, 2025
Portfolio 2
Portfolio 2 for the week ended February 28, 2025: UP ![]()
Activity
No significant activity to report this week.
Dividends
Dividends Received this week for the following companies:
Canadian $
Dream Industrial Real Estate Investment Trust (TSE: DIR.UN) DRIP
US $
No US$ dividends this past week.
Quarterly Reports
The Bank of Nova Scotia
See report under Portfolio 1.
Portfolio 3
Portfolio 3 for the week ended February 28, 2025: DOWN ![]()
- Microsoft announced they have cancelled numerous leases for significant data centre capacity in the US, suggesting a potential oversupply as they build out their AI infrastructure to meet the growing demand.
Activity
No significant activity to report this week.
Dividends
Dividends Received this week for the following companies:
Canadian $
Enghouse Systems Ltd (TSE: ENGH)
US $
No US$ dividends this past week.
Quarterly Reports
Magnite, Inc.
See report under Portfolio 1.
TD Bank Group
See report under Portfolio 1.
Royal Bank of Canada
First quarter 2025 financial results on February 27, 2025


 The Magnificent Seven isn’t just a legendary Western movie anymore—it’s also the nickname for the seven technology giants shaping the future and dominating stock markets. These companies aren’t just industry leaders; they’re innovators, disruptors, and the driving forces behind some of the biggest trends in artificial intelligence (AI), cloud computing, automation, and renewable energy.