
Dividend Fallacy
When a friend told me they were choosing stocks based on dividend yields, it got me thinking—how many of us have fallen into this same trap? High dividend yields can feel like a golden ticket, but are they always as good as they seem? Let’s look at two common pitfalls: the “dividend fallacy” and the “dividend trap.”
First, let’s define dividend yield. It’s the percentage of a stock’s price paid out as dividends each year. For example, if a stock costs $100 and pays a $5 annual dividend, its yield is 5%. While this metric is useful, focusing on it alone can lead to trouble. Dividend yield is only one piece of a much bigger puzzle.
Take this example: You spot a stock offering a 10% dividend yield and think it’s a steal. But what if that yield is high because the stock price recently plummeted after poor earnings? A falling stock price can artificially inflate the yield, creating the illusion of a great opportunity. If the company can’t maintain its payouts, it might cut the dividend, and the stock price could fall further. In the end, you’re left with less income and a shrinking investment.
This is where the “dividend fallacy” comes in—the assumption that higher yields always mean better investments. Some companies offer big payouts to attract investors, even when their profits can’t sustain them. If they’re paying out more than they earn, those dividends are at risk, and so is your investment. Meanwhile, focusing too much on yield might make you miss other important factors, like whether the company is growing or if its stock price has room to rise.
The “dividend trap” takes this one step further. It happens when you buy a stock for its high yield alone, only to discover the company is struggling. Sometimes, a high yield signals financial trouble, not stability. For instance, a high yield might result from the stock price dropping sharply, which increases the yield percentage. While this might look attractive at first glance, it often signals that the market has concerns about the company’s health. If the company pays out most of its profits as dividends, it has little flexibility to reinvest in growth or handle financial setbacks. This lack of flexibility can leave investors vulnerable during challenging times.
So, how do you avoid these pitfalls? Don’t chase high yields blindly. Instead, ask yourself: Can the company afford the dividend? Is the yield high because the stock price is falling? Does the company have room to grow and reinvest? Looking at the bigger picture—such as the company’s financial health, growth potential, and total return—can help you make smarter decisions.
Investing is about the long game, and while high yields can be tempting, they’re not the full story. By digging deeper, you’ll avoid common pitfalls and build a portfolio that stands the test of time. 😊
Now that we’ve covered the risks of chasing high dividend yields, let’s take a step back and look at how the broader markets performed this week—and what it all means for my three portfolios…
Items that may only interest or educate me ….
Canadian Economic news, US Economic news, …
Canadian Economic news
This past week’s key economic data that the Bank of Canada (BoC) considers when deciding whether to raise or lower the interest rate.
Consumer price Index (CPI)
Statistics Canada reported that inflation cooled by 0.4% in December, following a flat reading in November. On a yearly basis, inflation eased to a three-month low of 1.8%, matching analysts’ expectations and dipping slightly below November’s 1.9%. December also marked the fifth consecutive month where inflation remained at or below the BoC’s 2% target – a bit of good news for Canadians! 😊
Month over month, ‘Transportation’ prices saw the largest increase, rising 1.8%, while ‘Clothing and footwear’ saw the sharpest decline, falling 3.0%. Annually, ‘Shelter’ costs, which include mortgages and rent, continued to lead price growth at a growth rate of 4.5%, though that’s down slightly from November’s 4.6%. On the flip side, ‘Clothing and footwear’ posted the largest annual drop, tumbling 4.5%.
Core CPI, which excludes the often-volatile food and energy categories, also pointed to easing pressures. It declined by 0.1% month over month for the second straight month, although the annual rate edged up to 2.1% from November’s 1.9%.
December’s decline in inflation was largely driven by the temporary GST sales tax break introduced mid-month, giving Canadians a welcome reprieve. While the overall trend points to slowing inflation, higher costs for essentials like food and shelter remain a strain. The tax break has provided some breathing room, but with its expiration looming on February 15, 2025, and the potential for new US tariffs as early as February 1, inflationary pressures could resurface.
These developments complicate the BoC’s upcoming meeting on January 29. However, the BoC will need to carefully weigh the temporary relief from the GST holiday against the broader inflationary trends and economic conditions before making their decision.
Retail Sales
Canada’s retail sales were unexpectedly flat in November, according to Statistics Canada’s Thursday report, missing the anticipated 0.2% increase. This followed a 0.6% rise in October. On a brighter note, annual sales grew 1.6%, edging up from October’s 1.5% and beating expectations of 0.8%.
Breaking it down by industry, ‘Motor vehicle and parts dealers’ led the pack with a 2.0% monthly increase, while ‘Building material and garden equipment and supplies dealers’ took a hit, dropping 2.1%. Year-over-year, ‘Motor vehicle and parts dealers’ also shone, with a 5.8% gain. Meanwhile, ‘Gasoline stations and fuel vendors’ saw sales decline 5.1% year-over-year, marking the third straight month of falling sales in this category.
Core retail sales—which exclude the often-volatile auto and fuel categories—dropped 1.0% in November, the steepest monthly decline in six months, compared to a modest 0.2% gain in October. However, on an annual basis, core sales still managed to rise by 0.8%, though this was slower than October’s 1.8%.
Retail sales are a key early indicator of GDP growth, accounting for nearly 40% of total consumer spending. Unfortunately, this latest data paints a less optimistic picture for next week’s GDP report. Some analysts believe the softer numbers reflect consumers postponing purchases ahead of the GST tax break that began in mid-December. On a brighter note, early indicators suggest sales bounced back in December. Here’s hoping those forecasts prove correct! 😊
Canadian market volatility
Canada’s Volatility Index (VIXC) saw a brief surge this week, opening at 13.58 and jumping above 19 on tariff concerns. However, the spike was short-lived, as the index quickly settled below 16 within 30 minutes. From there, the VIXC drifted lower throughout the week, closing at a calmer 12.99.
For those unfamiliar with the VIXC (listed as VIXI on the Toronto Stock Exchange), think of it as a measure of market jitters. Readings under 10 indicate calm waters, while levels between 10 and 20 reflect normal market fluctuations. If it shoots above 20, it signals growing uncertainty and the potential for more turbulence. This week’s quick recovery and lower close suggest that markets might be shrugging off the tariff worries—for now. 😊
US Economic news
This past week’s key data points that the Federal Reserve (Fed) considers when deciding whether to raise or lower the interest rate.
Consumer Sentiment Index (CSI)
The University of Michigan’s January CSI brought a bit of a surprise, marking its first drop in six months. The index slipped to 71.1, missing analysts’ expectations of 73.2. That’s a 3.9% decline from December’s 74.0 and 10% lower than this time last year.
Breaking down the components: the Current Economic Conditions Index, which reflects how consumers feel about their finances right now, edged down to 74.0 from 75.1 in December—a 1.5% drop—and is 9.6% below where it stood in January 2024. On the other hand, the Index of Consumer Expectations, which looks at optimism about the next six months, fell more sharply to 69.3, down 5.5% from December and 10.1% year-over-year.
Overall, the decline in sentiment highlights growing concerns about inflation and unemployment. The drops were consistent across income, wealth, and age groups, suggesting a broad-based anxiety. To complicate matters, some consumers are rushing to make purchases early, hoping to avoid price hikes tied to potential tariffs.
Consumer sentiment is a key indicator of how people might spend in the months ahead, so this decline could signal caution in the economy. Let’s hope this is just a blip on the radar and not the start of a larger trend! 😊
American market volatility
The CBOE Volatility Index (VIX), often called the market’s “fear gauge,” began the week at 16.46 and steadily drifted lower, closing at 14.85. Optimism around the new administration’s policies, including the delay of potential tariffs, helped ease investor fears and stabilize markets, contributing to the decline in the VIX.
For those new to the VIX, it tracks expected market volatility over the next 30 days. Think of it like a stress meter for the market: below 12 suggests calm and smooth sailing, while 12 to 20 signals routine ups and downs. When the VIX climbs above 20, it means nerves are rising, and anything over 30 often points to significant market tension or even a potential crisis. This week’s lower reading reflects a more relaxed mood among investors. 😊
Weekly Market and Portfolio Review
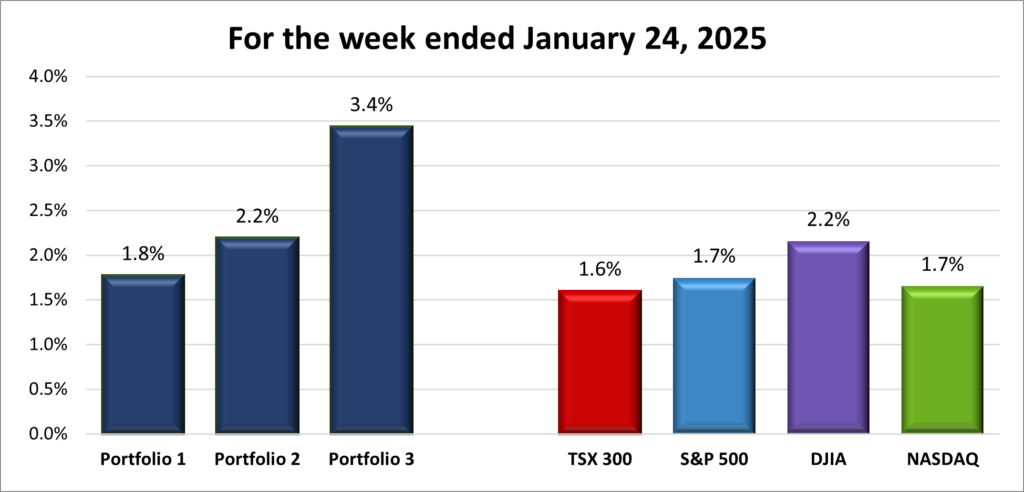
For the week, the TSX (SPTSX) climbed 1.6%, the S&P 500 (SPX) rose 1.7%, the DJIA (INDU) advanced 2.2% and the Nasdaq (CCMP) increased 1.7%.
| Index | Weekly Streak |
| TSX: | 2 – week winning streak |
| S&P: | 2 – week winning streak |
| DJIA: | 2 – week winning streak |
| Nasdaq: | 2 – week winning streak |
![]() The first week of President Trump’s second term ended on a high note, with all four major indexes posting weekly gains, as shown in the chart above. Markets rallied on strong corporate earnings and optimism over the administration’s business-friendly stance. The S&P closed at a record high, and the DJIA hit its highest level in over a month, with all three US indexes stringing together four straight winning sessions.
The first week of President Trump’s second term ended on a high note, with all four major indexes posting weekly gains, as shown in the chart above. Markets rallied on strong corporate earnings and optimism over the administration’s business-friendly stance. The S&P closed at a record high, and the DJIA hit its highest level in over a month, with all three US indexes stringing together four straight winning sessions.
Investors’ hopes for lower taxes and reduced regulations overshadowed their concerns about proposed tariffs, which could raise costs and spark inflation. In a speech to the World Economic Forum, President Trump urged central banks to cut interest rates, called on OPEC to lower oil prices, and reaffirmed plans for broad tariffs starting February 1. While lower rates and cheaper oil appeal to investors, the tariff threat dampened enthusiasm.
Meanwhile, the TSX stretched its winning streak to nine sessions – the longest since October 2021 – driven by gold-mining stocks, optimism about US growth, and lower-than-expected CPI inflation data. With inflation easing, the BoC could be on track to cut rates, adding more momentum to Canadian equities.
As the first week of the presidency shows, this administration could bring both opportunities and risks. Pro-business policies have lifted markets, but tariffs remain a wildcard, particularly for the Canadian economy.
Looking ahead, next week should be action-packed with rate decisions from the BoC and the Fed, plus earnings from major tech giants. After a calm start to the year, things are about to heat up. Stay tuned! 😊
| Portfolio | Weekly Streak |
| Portfolio 1: | 2 – week winning streak |
| Portfolio 2: | 2 – week winning streak |
| Portfolio 3: | 2 – week winning streak |
![]() After the ups and downs of the first two weeks of the year, I wasn’t sure what to expect heading into this past week. But the start of President Trump’s second term brought a pleasant surprise for all three portfolios, each gaining at least 1.8%, as shown in the chart below. Investor optimism gave a nice lift to heavyweight technology companies, which benefited my tech-heavy portfolios. That said, it wasn’t all smooth sailing – declining oil and natural gas prices created headwinds for energy holdings, limiting the overall weekly gains.
After the ups and downs of the first two weeks of the year, I wasn’t sure what to expect heading into this past week. But the start of President Trump’s second term brought a pleasant surprise for all three portfolios, each gaining at least 1.8%, as shown in the chart below. Investor optimism gave a nice lift to heavyweight technology companies, which benefited my tech-heavy portfolios. That said, it wasn’t all smooth sailing – declining oil and natural gas prices created headwinds for energy holdings, limiting the overall weekly gains.
Portfolio 1 had a strong week, with 71% of its holdings closing in the green. By Thursday, it was leading the charge among all portfolios and indexes, bolstered by a rally in technology stocks, including Amazon (NASD: AMZN), which hit an all-time high. However, a Friday pullback in the tech sector caused the portfolio to slip behind the other two. Thankfully, its largest holding, Nvidia (NASD: NVDA), posted a weekly gain, helping secure a positive finish for the week.
Portfolio 2 had an even better week, increasing in value by 2.2% on the strength of 71% of its holdings finishing in the green. Leading the way was Guardant Health (NASD: GH), which jumped an impressive 26% after gaining expanded Medicare coverage for its Guardant Reveal test for colon cancer.
Portfolio 3 stole the show this week, with 77% of its holdings moving higher and outperforming the other portfolios as well as all four indexes. The crown jewel? Vertiv Holdings (NYSE: VRT), which hit a new all-time high, adding an extra spark to the portfolio’s impressive run. Sometimes, being third in line means first in performance! 😊
Overall, while there weren’t any jaw-dropping surprises, a steady gains across all three portfolios made for a solid week. As the tortoise said to the hare, “Slow and steady wins the race.” 😊
Companies on the Radar
 Once again, my radar list has seen some reshuffling! This time, though, the stocks leaving – Kenvue Inc. (NYSE: KVUE), Astera Labs, Inc. (NASD: ALAB), and RxSight, Inc. (NASD: RXST) – didn’t make their way into one of my portfolios. Here’s why:
- Kenvue didn’t offer the growth potential I’m looking for right now.
- Astera Labs is a strong player in semiconductors, but my portfolios already have plenty of chip exposure. If I weren’t so semiconductor-heavy, this one would stay on my radar longer.
- RxSight faced stiff competition from the five new names I added to the list – sometimes, it’s just about finding better fits!
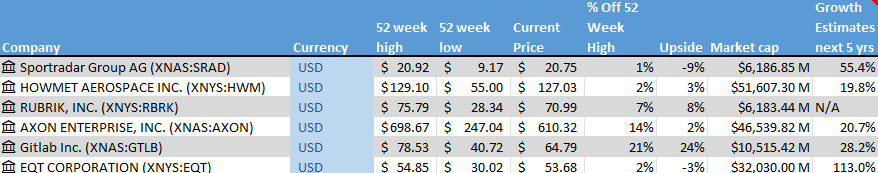
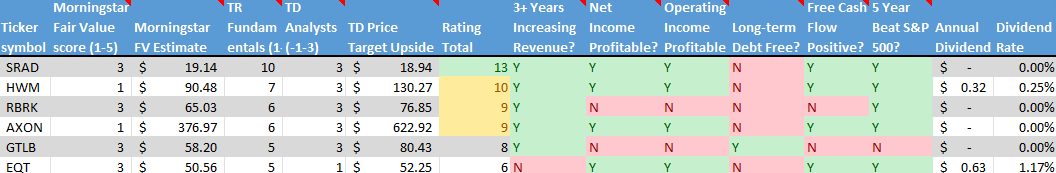
That leaves Rubrik, Inc. (NASD: RBRK), the high-growth, large-cap American cybersecurity firm, as the lone holdover. Joining it on my radar list are these five new additions:
- Sportradar Group AG (NASD: SRAD): A mid-cap Swiss company specializing in sports data, content, and integrity services that support businesses in sports, media, and betting industries.
- Howmet Aerospace Inc. (NYSE: HWM): A large-cap American company producing cutting-edge engineered products like airfoils, titanium forgings, and forged aluminum wheels for aerospace, energy, and transportation sectors.
- GitLab Inc. (NASD: GTLB): A large-cap American firm offering software tools that developers love for coding, project management, and workflow automation.
- Axon Enterprise, Inc. (NASD: AXON): A large-cap innovator in body cameras, TASER devices, and cloud-based evidence management software, serving law enforcement and public safety agencies.
- EQT Corporation (NYSE: EQT): A vertically integrated, large-cap natural gas company, focused on production and midstream operations – a powerhouse in the energy sector.
This latest radar list is a great mix of innovation, steady growth, and untapped potential. Now, the fun part begins: taking a closer look at these companies and deciding if any will make the leap into one of the portfolios. 😊
As always, these are not buy recommendations – be sure to do your own research and make decisions that align with your personal financial goals!
The Radar Check was last updated January 24, 2025.
Portfolio Update
Portfolio 1
Portfolio 1 for the week ended January 24, 2025: UP ![]()
- TD Bank (TSE: TD) and the Bank of Nova Scotia (TSE: BNS) have dropped out of the Net-Zero Banking Alliance. Both banks stated that they have the necessary internal capabilities to continue their climate work independently. This comes on the heels of six major US banks withdrawing from the Alliance.
- Alphabet’s (NASD: GOOGL) announced they plan to invest another US$1 billion in artificial intelligence (AI) startup AnthropicAI.
In other Google related news, Britain’s anti trust regulator, the Competition and Markets Authority (CMA), has started an investigation into Google’s and Apple’s (NASD: AAPL) smartphone operating systems, app stores and browsers. The CMA is looking to see if the two companies are using their mobile system dominance to favour their own apps and services and pushing unfair terms on developers. - General Motors (NYSE: GM) announced they are recalling certain 2025 Chevrolet Equinox EV all-wheel drive electric vehicles (EV). The National Highway Traffic Safety Administration found that the vehicles’ adaptive cruise control may not engage the brakes properly, due to faulty brake module software, increasing the risk of a crash. GM dealers will update the software free of charge.
Activity
Sold: A covered call option on some Nvidia shares Back in November 2024, I decided to try something a bit different with my Nvidia shares: I placed a covered call options order [link to Nov8]. For those unfamiliar with the term, a covered call lets you generate income from stocks you already own. Here’s how it works: instead of just selling my shares outright, I was paid a premium upfront for agreeing to sell them at an agreed price, in this case $150 per share, if Nvidia’s price reached that level. Essentially, I got paid to wait, and if Nvidia hit $150, the shares would be taken as agreed—with a little extra bonus. If the share price didn’t reach the strike price by the expiration date, I’d keep both the shares and the premium.
When the option expired at the end of November, Nvidia’s share price was below $150, so the buyer didn’t exercise the option because it was cheaper for them to buy the shares on the open market. That meant I kept my shares and the premium.
This past week, I decided to place another covered call for some of my Nvidia shares. As with the November trade, I set the strike price at $150 per share, with the option expiring on February 7, 2025. If Nvidia’s share price hits $150, the shares will go to the buyer, and I’ll trim my position as planned. If it doesn’t, I’ll keep the premium and my shares.
Either way, I’m happy with the outcome. 😊 If the shares are sold, my portfolio becomes less concentrated, giving me extra cash to invest elsewhere. If they’re not sold, I’ve earned a bit of income while holding onto a stock I still like. It’s a win-win strategy that fits nicely with my goals.
Dividends
Dividends Received this week for the following companies:
Companies followed by DRIP (Dividend Re-Investment Plan) indicate additional shares were purchased with the dividend. Any cash leftover was added to the cash balance.
Canadian $
Dream Industrial Real Estate Investment Trust (TSE: DIR.UN) DRIP
Decisive Dividend Corp (TSE: DE) DRIP
BCE Inc (TSE: BCE) DRIP
US $
No US$ dividends this past week.
Quarterly Reports
No quarterly reports this past week.
Portfolio 2
Portfolio 2 for the week ended January 24, 2025: UP ![]()
- Guardant Health announced that Palmetto GBA, a Medicare administrative contractor, approved coverage for the company’s Guardant Reveal test to monitor for disease recurrence in colorectal cancer patients after curative intent therapy, expanding the prior coverage that only covered monitoring in the early post-surgical setting.
Activity
No significant activity to report this week.
Dividends
Dividends Received this week for the following companies:
Canadian $
Brookfield Infrastructure Partners LP (TSE: BIP.UN) DRIP
Dream Industrial Real Estate Investment Trust (TSE: DIR.UN) DRIP
US $
No US$ dividends this past week.
Quarterly Reports
No quarterly reports this past week.
Portfolio 3
Portfolio 3 for the week ended January 24, 2025: UP ![]()
- TD Bank announced Chief Global Anti-Money Laundering Officer Herbert Mazariegos has stepped down and has been replaced by Jacqueline Sanjuas. Considering the huge fine TD received from US regulators over money laundering, this shouldn’t be a surprise to anyone.
Activity
No significant activity to report this week.
Dividends
Dividends Received this week for the following companies:
Canadian $
goeasy Ltd (TSE: GSY)
TD US Equity Index ETF (TSX: TPU)
US $
No US$ dividends this past week.
Quarterly Reports
No quarterly reports this past week.