
Hints of a US rate cut
This past week, the US Federal Reserve (Fed) announced that it would keep the benchmark interest rate at 5.5%, a move that was widely expected. However, the Fed also hinted at the possibility of a rate cut in September, as inflation cools and the labour market shows signs of slowing. The Federal Open Market Committee (FOMC) unanimously agreed to maintain the federal funds rate in the 5.25% to 5.5% range, where it has been for the past year.
Fed officials noted that while job gains have slowed and the unemployment rate has slightly increased to 4.1%, it remains relatively low. Inflation is trending down, though it is still “somewhat elevated.” Fed Chair Jerome Powell mentioned that while there was discussion about cutting rates, a “strong majority” felt it was not the right time. However, he indicated that a September rate cut “could be on the table,” suggesting the economy is nearing a point where a policy rate reduction might be warranted.
Their goal is to achieve a ‘soft landing,’ where inflation returns to the Fed’s 2% target without harming economic growth. However, potential challenges remain. One concern is the possibility of inflation rising again. Another is the political pressure from Republican lawmakers, who have cautioned that lowering rates before the November election could be seen as a political move. They do not want the Democrats to be able to take credit for lowering borrowing cost that would help consumers and businesses alike. However, the Fed said they only thing they were concerned about was the state and direction of the economy and the progress of inflation back to its 2% annual target. Their decisions are driven by data, not politics.
Overall, the Fed’s announcement was in line with expectations, maintaining the rate at 5.5%. However, if inflation continues its downward trend or the economy slows more than anticipated, a rate cut in September is likely on the table. The coming months will be pivotal in determining whether the Fed can successfully navigate a soft landing without jeopardizing economic stability or getting caught up in political debates.
In the meantime, let’s see what happened this past week….
Items that may only interest or educate me ….
Canadian Economic news, US Economic news, How can I beat the TSX or S&P? ….
Canadian Economic news
This past week’s key economic data that the Bank of Canada (BoC) considers when deciding whether to raise or lower the interest rate.
Gross Domestic Product (GDP)
GDP is a key indicator of a country’s economic health, measuring the total value of goods and services produced within an economy over a specific period. This metric offers valuable insights into overall economic performance, helping the BoC make informed decisions on interest rates to promote price stability, full employment, and sustainable economic growth.
This week, Statistics Canada reported GDP growth slowed to 0.2% in May, following a 0.3% increase in April, which was slightly above analysts’ expectations of 0.1% growth. The ‘Goods-producing industries’ saw a 0.4% increase, driven by a 0.9% rise in the ‘Agriculture, forestry, fishing and hunting’ subsector, although ‘Mining, quarrying, and oil and gas extraction’ fell by 0.6%. Meanwhile, the ‘Services-producing industries’ grew by 0.1%, with ‘Accommodation and food services’ up 0.9%, offsetting a 0.9% decline in ‘Retail trade.’
Year-over-year, GDP increased by 1.1%, with ‘Goods-producing industries’ up by 0.1% and ‘Services-producing industries’ rising by 1.4%. The ‘Mining, quarrying, and oil and gas extraction’ subsector led the ‘Goods-producing industries’ with an 8.0% increase, while ‘Manufacturing’ declined by 2.1%. In the ‘Services-producing industries,’ ‘Transportation and warehousing’ gained 3.3%, while ‘Management of companies and enterprises’ dropped by 33.3%.
Looking ahead, Statistics Canada estimates a modest 0.1% growth in GDP for June, with a forecasted annualized growth of 2.2% for the second quarter, surpassing the BoC’s previous estimate of 1.5%. This suggests that while the Canadian economy is performing better than expected, it is still being driven by higher immigration rather than improved productivity and operating below its potential.
The official report will be released on August 30, 2024.
Canadian market volatility
Over the past week, Canada’s Volatility Index (CVIX) saw a significant rise, jumping from 13.14 to a peak of 22.46 before settling at 18.48—a 40% increase. This surge followed the release of new US employment data, which pointed to a slowing labour market and reignited fears of a potential economic slowdown in the world’s largest economy. Such concerns are likely to have ripple effects on Canada’s economy.
Tracked as the VIXI on the Toronto Stock Exchange (TSE), the CVIX measures expected market volatility. A reading below 10 signals a calm and stable market, while 10 to 20 indicates moderate volatility and normal fluctuations. Readings above 20 suggest high volatility and significant market uncertainty. With the CVIX at 18.48, it indicates a market environment where volatility is somewhat elevated but not extreme, suggesting a cautious but not panicked investor sentiment.
US Economic news
This past week’s key data points that the Fed considers when deciding whether to raise or lower the interest rate.
Labour data
Three key reports provide a monthly snapshot of the US labour market: Job Openings and Labor Turnover Survey (JOLTS), ADP National Employment Report, and Employment Situation Summary (ESS). Analyzing these reports reveals trends in employment, wage growth, and potential future economic policy.
Labor Department’s Job Openings and Labor Turnover Survey (JOLTS)
The June JOLTS report revealed a higher than expected 8.184 million job openings as of the last day of the month, nearly matching the upwardly revised 8.230 million from May. Analysts had predicted around 8.0 million openings. The job openings rate remained steady at 4.9%, with the number of openings decreasing by 914,000 from June 2023. The ratio of job openings to unemployed persons dropped to 1.2 from 1.24 in May, indicating a slight cooling in the labour market.
On a monthly basis, ‘Accommodation and food services’ saw the largest increase, adding 120,000 job openings, while ‘Manufacturing of non-durable goods’ experienced a decline of 88,000 openings. Year-over-year, ‘Arts, entertainment, and recreation’ increased by 5,000, and ‘State and local government’ added 48,000 job openings.
Overall, the JOLTS report points to a slight decrease in job openings and a lower ratio of job openings to unemployed workers, suggesting a cooling labour market. However, the number of job openings still exceeds pre-pandemic levels, indicating a relatively strong demand for workers.
ADP Employment Report
The July ADP Employment report revealed that private payrolls increased by just 122,000 jobs, falling short of the 150,000 jobs analysts had expected and well below June’s upwardly revised 155,000 gain. Additionally, wage growth slowed, with annual increases dropping to 4.8% from 4.9% in June. Employees who stayed in their positions saw wages rise by 4.8%, while those who switched jobs experienced a wage increase of 7.2%, down from 7.7% in June. Overall, job creation slowed, and pay gains continued to decelerate, highlighting a cooling labour market.
Bureau of Labor Statistics’ Employment Situation Summary (ESS).
The July ESS data brought some surprises. Nonfarm payrolls increased by only 114,000, falling short of the expected 175,000 and down from June’s 206,000. The unemployment rate also caught analysts off guard, rising to 4.3% from 4.1%, contrary to predictions that it would remain steady. Just a year ago, the unemployment rate was a much lower 3.5%. On the wage front, annual average earnings grew by 3.6% in July, down from June’s 3.9% pace and slightly below the forecasted 3.7%.
These figures suggest a cooling US economy and labour market. The unexpected rise in unemployment indicates more people are either losing jobs or struggling to find employment. Additionally, the deceleration in annual average earnings growth signals reduced wage pressure. Combined, these factors point to slowing economic momentum, potentially prompting the Fed to consider lowering interest rates to stimulate growth and raising concerns about a potential recession.
Conclusion
The July labour market data signals a cooling economy characterized by slowing job creation, rising unemployment, and decelerating wage growth. If these trends persist, the risk of an economic recession increases. This situation heightens concerns and puts additional pressure on the Fed to consider lowering interest rates at their next meeting in September.
American market volatility
The CBOE Volatility Index (VIX), often called the market’s “fear gauge,” surged to 29.44, its highest level since October 2023, before settling at 23.39, marking a 42% increase from 16.38 at the start of the week. This spike was driven by disappointing earnings from major technology companies, weaker-than-expected labour data, and economic indicators suggesting a faster-than-expected slowdown, raising fears of a potential recession.
The VIX gauges expected market volatility over the next 30 days. Readings below 12 suggest calm and stability, while 12 to 20 indicates normal fluctuations. Levels between 20 and 30 point to heightened volatility and uncertainty, and above 30 is starting to get extreme and signals high stress, often seen during crises. The recent uptick in the VIX indicates a period of heightened market tension and suggests that investors are anticipating more volatile conditions in the near term.
Consumer Confidence Index
The Conference Board’s Consumer Confidence Index (CCI) for July increased unexpectedly to 100.3, up from a downwardly revised 97.8 in June, slightly surpassing analysts’ expectations of 99.7. Despite this rise, consumer confidence remains within the tight range observed over the past two years.
The Present Situation Index, which assesses consumers’ perceptions of current business and labour market conditions, dipped slightly to 133.6 from June’s revised 135.3. This indicates that while people may feel somewhat better about the current labour market, concerns about inflation and higher prices persist. Meanwhile, the Expectations Index, reflecting consumers’ outlook over the next six months on income, business, and labour market conditions, rose to 78.2 in July from 72.8 in June. Notably, this marks the sixth consecutive month the Expectations Index has stayed below the critical 80 mark, often signaling a potential recession.
Overall, the combination of these sub-indexes suggests that while consumers feel somewhat confident about their current situation, largely due to a strong labour market, there is growing unease about a slowing economy. The CCI, with a score above 100, indicates optimism, while a score below 100 suggests a more pessimistic outlook. The Expectations Index is particularly crucial, as a reading below 80 can be an early warning sign of an economic downturn.
How can I beat the TSX or S&P?
Out of one million investors worldwide, about 90% are institutional or professional investors, leaving retail investors like us in the minority. When you aim to beat the TSX or S&P 500, you are essentially saying you will outperform over 50% of all investors, including those professionals with their teams of analysts and extensive resources. That is a tall order, and the odds are not in your favour. Instead, consider setting your own personal investment goals.
When investing, focusing too much on beating the TSX or S&P 500 might not be the best approach for several reasons:
- Long-Term Focus Over Short-Term Gains: Investing with a long-term perspective often leads to better results than chasing short-term market performance. The markets can be volatile, and trying to outperform them in the short term can lead to high-risk decisions.
- Different Goals and Risk Tolerance: Your personal financial goals, risk tolerance, and investment time horizon are unique. The TSX and S&P 500 are benchmarks for broad market performance, but your investment strategy should be tailored to your specific needs and circumstances.
- Diversification: Aiming to beat a specific index might lead to an overly concentrated portfolio, increasing risk. Diversification across different asset classes, sectors, and geographic regions can reduce risk and provide more stable returns over time.
- Market Timing Challenges: Consistently beating the market requires precise timing, which is extremely difficult even for seasoned, professional investors. Markets are influenced by countless factors, many of which are unpredictable.
- Costs and Taxes: Trying to beat the market often involves frequent buying and selling, which can lead to higher transaction costs and taxes. These costs can eat into your returns, making it harder to outperform the benchmarks.
- Psychological Stress: Focusing on beating the market can lead to unnecessary stress and emotional decision-making. It is easy to become overly focused on short-term fluctuations and lose sight of your long-term investment strategy.
Instead of aiming to beat the TSX, S&P 500, or even a friend’s portfolio, it is more beneficial to focus on building a diversified portfolio aligned with your financial goals, risk tolerance, and investment horizon. By setting clear goals and planning your portfolio to achieve them, you can avoid the pressure of constantly trying to outperform others or the market. This approach allows you to make the right investment decisions based on your personal objectives, rather than making impulsive moves to keep up with an index or peers. Consistent, disciplined investing and sticking to your plan can lead to satisfactory returns, making it less important what a stock index or others are doing. By moving the goalposts in your favour, you can focus on your own financial journey and success.
Weekly Market Review
Monday: it was a choppy day in the markets as investors await what will be a busy week of news for the markets, headlined by the Fed’s latest announcement on US interest rates. The Toronto Stock Exchange Composite Index (TSX) and the Dow Jones Industrial Average (DJIA) ended lower, while the S&P 500 Index (S&P) and the Nasdaq Composite Index (Nasdaq) ended barely in positive territory. Oil prices fell after Israeli officials said they were trying to avoid widening the Middle East conflict after Hezbollah fired missiles into Israel.
In Canada, investors adopted a wait-and-see approach, anticipating the Fed’s next move and the release of second-quarter earnings for major Canadian companies and US tech giants. In trading, Basic Materials (miners and fertilizer manufacturers) had the biggest gains, while the Technology sector had the biggest drop.
In the US, the July labour data and earnings reports from some of the biggest technology companies comes out this week. Investors will be looking to see if all the money invested in artificial intelligence (AI) is starting to payoff. In trading, Consumer Staples climbed the most, while the Energy sector lost the most ground.
Tuesday: another mixed day for the indexes with the TSX and DJIA advancing, and the S&P and Nasdaq declining. Investors are hoping tomorrow that the Fed signals they are preparing to lower the benchmark interest rate in September. Oil prices continued to slide as investors are concerned about lower demand from China and the likelihood that OPEC+ nations will increase supplies. In after hours trading, Microsoft (NASD: MSFT) slipped almost 5% when its revenues from its cloud computing segment came in lower than expected.
In Canada, the TSX’s smaller exposure to Technology stocks prevented the TSX being dragged lower by technology stocks like the technology-oriented S&P and Nasdaq. In trading, Healthcare posted the biggest gain, while the Technology sector recorded the biggest loss.
In the US, investors are eagerly awaiting earnings reports from major tech companies, hoping to see if their substantial investments in AI are beginning to pay off. There’s growing concern that these investments may not deliver the returns investors had anticipated, putting pressure on the big tech firms. In trading, Energy was the big winner on the day, while Technology was the biggest loser.
Wednesday: investor optimism that US interest rates would fall in September sent all four indexes soaring. The Fed announced they were holding the interest rate at 5.5% but said a rate cut in September could be in the cards. The price of oil rose as tensions increased in the Middle East after Israel killed a top Hamas leader.
In Canada, riding on the good news out of the US, the TSX set a record high close that saw all sectors advance. Leading the way was the Energy sector, with Consumer Staples trailing the pack.
In the US, investors stormed back into technology stocks sending the S&P and Nasdaq to their best one-day performance since February. In trading on Wall Street, Technology gained the most, while Healthcare lost the most.
Thursday: yesterday the markets giveth, today the markets taketh as all four indexes ended sharply lower. Weak US economic data led to global concerns that the US economy is slowing faster than expected. Oil prices were lower despite growing tensions in the Middle East.
In Canada, the TSX had its biggest drop in six months as a result of the weaker US economic news and declining oil prices. In trading, Telecommunications Services advanced the most, while Technology had the biggest loss.
In the USA, disappointing earnings from several semiconductor companies weighed heavily on the indexes Investors are increasingly concerned that the Fed may have delayed lowering interest rates for too long, leading to a recession. In trading, the Utilities sector posted the biggest gain, while Technology saw the biggest decline.
Friday: the indexes tumbled after a weaker-than-expected US labour report raised concerns about a potential recession. Oil prices fell as concerns about lower demand outweighed supply constraints caused by tensions in the Middle East. The price of oil posted its fourth straight weekly decline.
In Canada, the TSX was dragged lower on concerns the US economy was headed for a recession. In trading, Telecommunications Services and Utilities were the only sectors to end higher, while Technology sank the furthest.
In the US, investors exiting technology companies weighed on the indexes and sent the Nasdaq into a correction, where the index falls more than 10% from its last closing high. In trading on Wall Street, Consumer Staples advanced the most, while Consumer Cyclicals fell the farthest.
Weekly Market and Portfolio Review
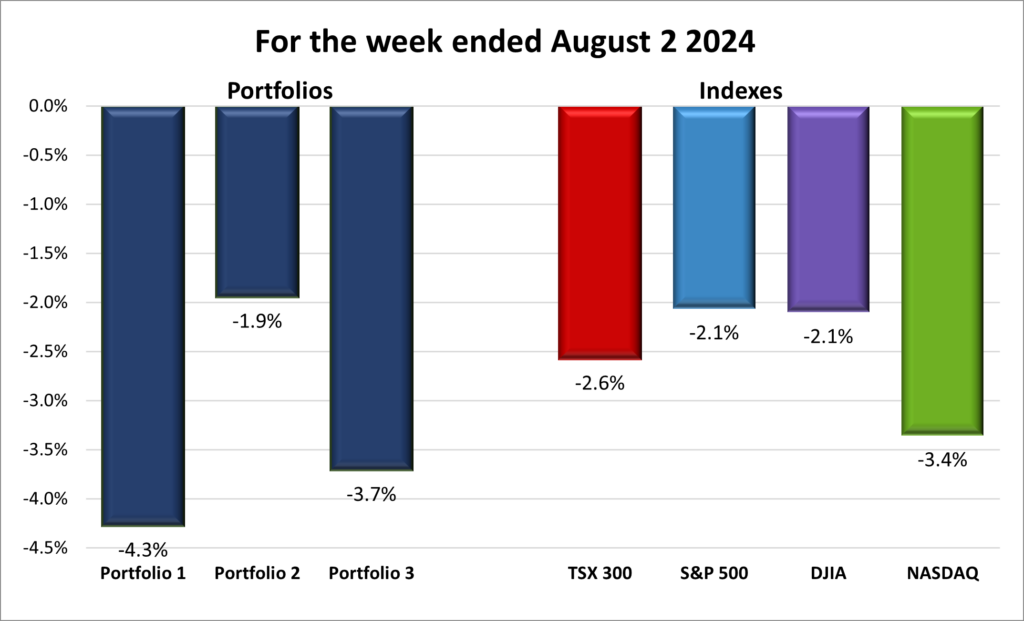
For the week, the TSX (SPTSX) lost 2.6%, the S&P 500 (SPX) dropped 2.1%, the DJIA (INDU) fell 2.1% and the Nasdaq (CCMP) plunged 3.4%.
| Index | Weekly Streak |
| TSX: | 1 – week losing streak |
| S&P: | 3 – week losing streak |
| DJIA: | 1 – week losing streak |
| Nasdaq: | 3 – week losing streak |
![]() It was a challenging week in the markets, with all four major North American indexes falling by at least 2%. Initially, there was hope that the Fed’s announcement about a possible interest rate cut in September would spur a rally, but instead, the markets took a sharp downturn in the final two days of the week, as shown in the chart above.
It was a challenging week in the markets, with all four major North American indexes falling by at least 2%. Initially, there was hope that the Fed’s announcement about a possible interest rate cut in September would spur a rally, but instead, the markets took a sharp downturn in the final two days of the week, as shown in the chart above.
Midweek, the Fed held the US interest rate steady at 5.5% while leaving the door open for a September rate cut. This brief optimism lifted the indexes, but the mood soured quickly. Weaker-than-expected US employment data ignited fears of a recession. With inflation still higher than desired, rising unemployment rates, and declining consumer spending, the markets reacted negatively. The Nasdaq officially entered correction territory, falling 10% from its record high set earlier in July.
Adding to the gloom were lackluster earnings reports. Tech companies’ second-quarter results raised concerns about ballooning costs from investments in AI infrastructure with only modest gains to show for it. Following disappointing reports from Alphabet (NASD: GOOGL) and Tesla (NASD: TSLA) the previous week, Microsoft and Amazon’s results this past week further rattled investors. On the bright side, earnings growth seems to be spreading beyond the tech giants and all the AI hype.
In Canada, the TSX set a record high midweek but then tumbled 3.8% by week’s end, snapping a five-week streak of weekly gains. Fears of a potential US recession erased gains from the past three weeks.
Investors are now questioning whether the Fed has waited too long to begin lowering rates. Earlier in the year, the Fed was lauded for its efforts to guide the economy towards a ‘soft landing’—bringing inflation down to the 2% target without triggering a recession. Now, concerns are growing that the Fed may have delayed too long and might struggle to cut rates swiftly enough to achieve the desired outcome.
As we move forward, investors will be keenly watching for signs of economic stabilization. The prospect of a rate cut brings a glimmer of hope, but reassurance is needed that the US economy remains robust. A slowdown is manageable, but not to the point of triggering a recession. Strong earnings reports could significantly ease concerns about a slowing economy. Ideally, this market volatility will prove to be a temporary blip, presenting potential buying opportunities. Let’s hope for calmer waters and a more positive outlook in the coming weeks. 😊
| Portfolio | Weekly Streak |
| Portfolio 1: | 3 – week losing streak |
| Portfolio 2: | 1 – week losing streak |
| Portfolio 3: | 3 – week losing streak |
![]() At the end of Thursday’s trading session, all three portfolios were showing promising gains of at least 1%. Fast forward to Friday, and the markets took a nosedive, dragging all three portfolios down, way down, as shown in the chart below.
At the end of Thursday’s trading session, all three portfolios were showing promising gains of at least 1%. Fast forward to Friday, and the markets took a nosedive, dragging all three portfolios down, way down, as shown in the chart below.
Portfolio 1 had a roughest week, dropping 4.3%. Only 20% of its companies posted weekly gains. The lone bright spot was Nvidia, the largest holding in the portfolio, which surged 13% on Wednesday, adding a record $329 billion in value in a single day. This remarkable gain, however, was sandwiched between a 9% drop in the two days prior and a 10% drop in the two days following. Despite this volatility, Nvidia’s mid-week spike helped it avoid a significant weekly loss.
Unfortunately, many other stocks in Portfolio 1 experienced significant declines of 10% or more. Notable drops included Pinterest (NASD: PINS) down 22%, Lattice Semiconductor (NASD: LSCC) down 19%, indie Semiconductor (NASD: INDI) down 17%, CrowdStrike (NASD: CRWD) down 16%, Navitas Semiconductor (NASD: NVTS) down 16%, Cameco Corp (TSE: CCO) down 15%, Carnival Corporation (NYSE: CCL) down 14%, Celestica (TSE: CLS) down 12%, Celsius Holdings (NASD: CELH) down 11%, and The Trade Desk (NASD: TTD), Rivian Automotive (NASD: RIVN), Datadog (NASD: DDOG), Lightspeed Commerce (TSE: LSPD), and Skyworks Solutions (NASD: SWKS), all down 10%.
Despite a challenging week, Portfolio 2 fared better than the other two portfolios, with a smaller overall loss of 1.9%. Over 85% of the companies in Portfolio 2 experienced a decline in share prices. Among those that did drop in value, only Supremex (TSE: SXP) saw a significant decrease, losing 11% of its value.
Portfolio 3 had a tough week as well, losing 3.7% of its value. I thought 85% of the companies in Portfolio 2 falling was bad, but Portfolio 3 topped that with 90% of its companies declining in value. Significant losses were posted by Telus International (TSE: TIXT) down 35%, Lithium Americas (Argentina) Corp (TSE: LAAC) down 15%, and Lithium Americas (TSE: LAC) down 13%.
To paraphrase Marvin the Martian, it was not a good week, not a good week at all. Stock market fluctuations like this past week are part of the distractions investors must deal with. Hopefully, we will not have to deal with fluctuations of this magnitude for a very, very long time. 😊
Monthly Market and Portfolio Review
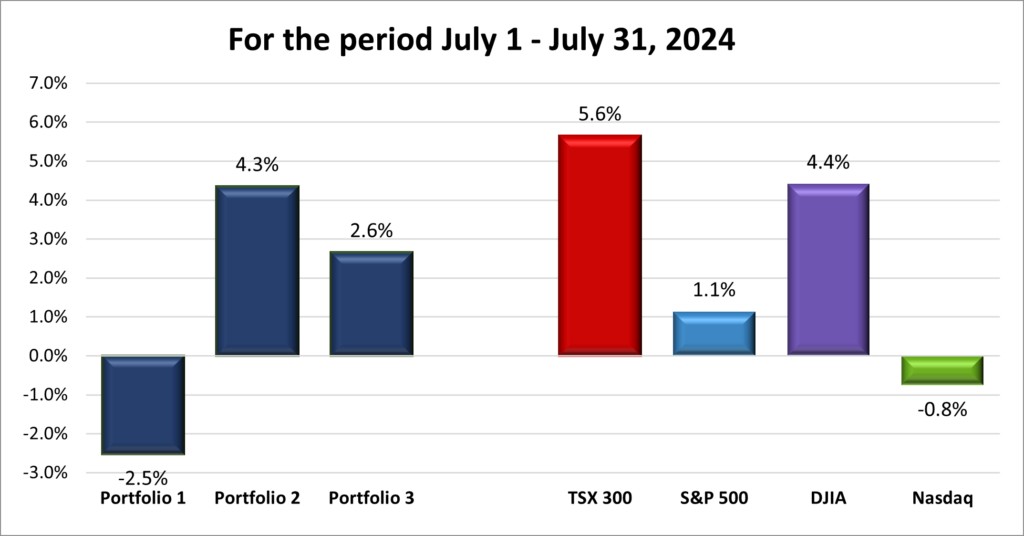
For the month, the TSX (SPTSX) surged 5.6%, the S&P 500 (SPX) rose 1.1%, the DJIA (INDU) advanced 4.4% and the Nasdaq (CCMP) slumped 0.8%.
![]() As illustrated in the chart above, July started strong for all four major indexes but experienced a mid-month slide. The TSX and DJIA remained in the green throughout the month, with the TSX surging 5.6% and the DJIA advancing 4.4%. In contrast, the growth-oriented Nasdaq and S&P fell into the red in the last week. However, a strong rally on the final day of July pushed the S&P into positive territory, recording a 1.1% gain for the month, and limited the Nasdaq’s losses to just 0.8%.
As illustrated in the chart above, July started strong for all four major indexes but experienced a mid-month slide. The TSX and DJIA remained in the green throughout the month, with the TSX surging 5.6% and the DJIA advancing 4.4%. In contrast, the growth-oriented Nasdaq and S&P fell into the red in the last week. However, a strong rally on the final day of July pushed the S&P into positive territory, recording a 1.1% gain for the month, and limited the Nasdaq’s losses to just 0.8%.
The TSX was the top-performing index for July, achieving its largest monthly advance since November 2023, setting a record close along the way. The BoC shifted its focus from curbing inflation to stimulating economic growth, lowering the benchmark interest rate a second time and signaling more possible rate cuts as inflation trends toward their 2% target.
In the US, the S&P, DJIA, and Nasdaq each set record high closes several times during the month, driven by positive economic news: a slowing economy, cooling labour market, and falling inflation. This trifecta boosted investor optimism, fueling expectations of a September Fed rate cut. As confidence grew, investors rotated out of heavyweight tech companies into value stocks and small-cap companies that had been overlooked during the 18-month AI fuelled rally.
The AI-driven rally began to lose momentum as investors began to question whether big tech companies could meet rising expectations and if substantial AI investments would pay off. Consequently, small-cap stocks appeared more attractive, leading to a significant selloff during the last full week of July, wiping out hundreds of billions in value from the Magnificent 7 tech giants. Many of these companies rebounded later, recovering some losses. Growth stocks, particularly those of the big tech companies, were likely due for a pullback after a strong May and June.
The market rally is broadening beyond the big tech companies that have driven it most of the year. Investors are moving money to other sectors and non-tech companies, promoting a more sustainable and beneficial broader rally. While the rotation out of the AI fuelled technology companies is not great for my three portfolios, a broader rally is more sustainable and good for the overall market, which is good for me.
July ended on a high note after Fed Chair Powell hinted that an interest rate cut could happen “as soon as the next meeting” in September. Let us hope he is right and that the markets maintain this positive momentum for the rest of the year! 😊
![]()
![]() July delivered a mixed performance across the three portfolios as you can see in the chart below. Portfolios 2 and 3 enjoyed gains of 4.3% and 2.6%, respectively, while Portfolio 1 faced a setback, dropping 2.5%. All three portfolios maintained the positive momentum from June, but Portfolios 1 and 3 stumbled mid-month.
July delivered a mixed performance across the three portfolios as you can see in the chart below. Portfolios 2 and 3 enjoyed gains of 4.3% and 2.6%, respectively, while Portfolio 1 faced a setback, dropping 2.5%. All three portfolios maintained the positive momentum from June, but Portfolios 1 and 3 stumbled mid-month.
Portfolio 1 had been riding high on the AI-driven tech stock rally over the past 18 months. However, the shift in investor focus to other sectors and smaller companies hit this portfolio hard. The 40% plunge in CrowdStrike following a global IT shutdown from a flawed software update did not help either. ☹
Portfolio 2 stood out as the top performer for the month, consistently posting weekly gains thanks to its diverse sector exposure. Initially boosted by strong performances from Microsoft and MongoDB (NASD: MDB), it extended its winning streak to five weeks, driven by broad-based gains across a majority of its holdings.
Portfolio 3 had a bumpy ride, with early-month advances followed by two consecutive weekly losses. Although most stocks in the portfolio showed consistent gains, the dollar value of the declining stocks outweighed those that rose.
Overall, July turned out better than expected. Despite recent drops in Portfolios 1 and 3, the month wasn’t as bad as it seemed. Here’s hoping Portfolio 1 gets back on track and all three portfolios increase in value in the coming months! 😊
Companies on the Radar
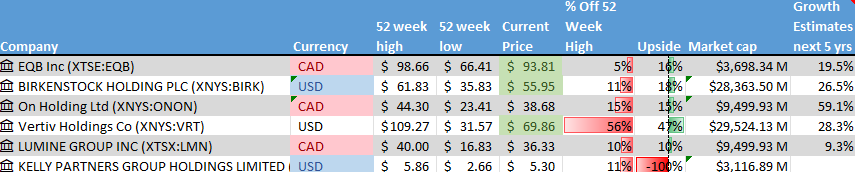
 No new companies came onto my radar this past week, which is just as well since I already have six companies on my watchlist, as listed below.
- Equitable Bank (TSE: EQB), a mid sized (when the number of outstanding shares times the shares prices is between $2 billion to $10 billion) Canadian bank, considered Canada’s 7th bank, that provides financial services to consumers and businesses.
- Birkenstock Holding plc (NYSE: BIRK), a medium cap British company that has been making shoes since 1774.
- On Holding AG (NYSE: ONON), a medium cap Swiss company, founder-run, sports products company.
- Vertiv Holdings (NYSE: VRT), a large American company that designs and builds infrastructure and continuity solutions to businesses around the world.
- Lumine Group (TSE: LMN), a young Canadian mid sized company that acquires communications and media software companies, and then strengthens and grows those companies.
- Kelly Partners Group (OTCM: KPGHF), a small Australian accounting firm that is growing through serial acquisition of other small accounting firms in Australia. They have recently expanded into the USA and other English-speaking countries.
Please keep in mind that these are only companies that have piqued my interest. This is not a recommendation or financial advice. You should do your own research or contact a professional before making any investment decisions.
The Radar Check was last updated August 2, 2024.
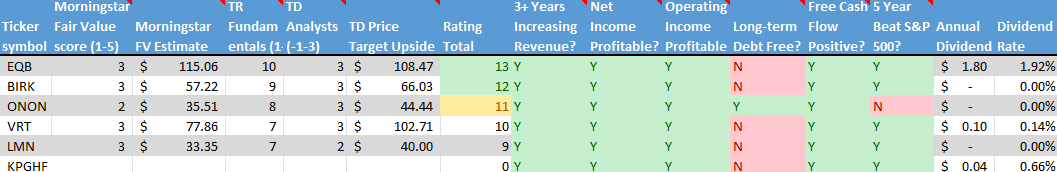
NOTE: Morningstar and Thomson-Reuters analysis is unavailable for Kelly Partners Group most likely because it is a small-cap Australian company with a market value of less than US$360 million and primarily listed on the Australian Stock Exchange. While you can invest in Kelly Partners through the Over-the-Counter Market (OTCM) here in North America, the analysis is not as readily available as it is for companies on major North American exchanges like the Toronto Stock Exchange, New York Stock Exchange, and Nasdaq.
Unlike other non-North American companies I have investigated, even Yahoo! Finance did not have any information under the Analysis tab for Kelly Partners. This means I could not get any ratings during my usual radar check.
Portfolio Update
Portfolio 1
Portfolio 1 for the week ended August 2, 2024: DOWN ![]()
- CrowdStrike is facing the backlash from shareholders after a mishandled software update. The company is being sued by investors who allege that CrowdStrike’s assurances about its technology were materially false and misleading, leading to a flawed update that disrupted systems globally.
- General Motors (NYSE: GM) is changing its employee performance rating system. Employee bonuses will be tied to the rating they receive from the new system.
Activity
No significant activity to report this week.
Dividends
Dividends Received this week for the following companies:
Companies followed by DRIP (Dividend Re-Investment Plan) indicate additional shares were purchased with the dividend. Any cash leftover was added to the cash balance.
Canadian $
Bank of Nova Scotia (TSE: BNS) DRIP
Toronto-Dominion Bank (TSE: TD) DRIP
US $
No US$ dividends this past week.
Quarterly Reports
Lattice Semiconductor Corporation
Second quarter 2024 financial results on July 29, 2024
Skyworks Solutions, Inc.
Third quarter 2024 financial results on July 30, 2024
Pinterest, Inc.
Second quarter 2024 financial results on July 30, 2024
PayPal Holdings, Inc.
Second quarter 2024 financial results on July 30, 2024
Cameco Corporation
Second quarter 2024 financial results on July 31, 2024
TMX Group Limited
Second quarter 2024 financial results on July 31, 2024
Andlauer Healthcare Group Inc.
Second quarter 2024 financial results on July 31, 2024
Lightspeed Commerce Inc.
First quarter 2025 financial results on Aug 1, 2024
Cloudflare, Inc.
Second quarter 2024 financial results on Aug 1, 2024
BCE Inc.
Second quarter 2024 financial results on July 31, 2024
Trisura Group Ltd.
Second quarter 2024 financial results on Aug 1, 2024
Apple Inc.
Third quarter 2024 financial results on Aug 1, 2024
Amazon.com, Inc.
Second quarter 2024 financial results on Aug 1, 2024
Telus Corporation
Second quarter 2024 financial results on Aug 2, 2024
Portfolio 2
Portfolio 2 for the week ended August 2, 2024: DOWN ![]()
- Walt Disney (NYSE: DIS) announced “Deadpool & Wolverine” was the largest domestic opening of the year, bringing in US$ 205 million over the weekend.
- Guardant Health (NASD: GH) announced the US Food and Drug Administration approved its Shield blood test as a “primary screening option” for colorectal cancer in patients 45 and older. With this approval, the test can now be offered by healthcare providers and is also the first blood test for this type of cancer that meets the requirements for Medicare reimbursement.
- TC Energy (TSE: TRP) announced they plan to sell a minority stake in their Canadian NGTL System and Foothills pipeline assets to specific First Nations communities in Alberta . As part of the deal, TRP has entered into a partnership with those communities to operate the pipelines. The deal will help TRP lower the amount of debt of their books.
Activity
No significant activity to report this week.
Dividends
Dividends Received this week for the following companies:
Companies followed by DRIP (Dividend Re-Investment Plan) indicate additional shares were purchased with the dividend. Any cash leftover was added to the cash balance.
Canadian $
Bank of Nova Scotia (TSE: BNS) DRIP
TC Energy Corp (TSE: TRP)
Dollarama (TSE: DOL)
US $
No US$ dividends this past week.
Quarterly Reports
Hammond Power Solutions Inc.
Second quarter 2024 financial results on Jul 25, 2024
Microsoft Corp.
Fourth quarter 2024 financial results on Jul 30, 2024
Fortis Inc.
Second quarter 2024 financial results on Jul 31, 2024
TC Energy Corporation
Second quarter 2024 financial results on Aug 1, 2024
Canadian Natural Resources Limited
Second quarter 2024 financial results on Aug 1, 2024
Telus Corporation
See report under Portfolio 1.
Brookfield Renewable Partners L.P.
Second quarter 2024 financial results on Aug 2, 2024
Portfolio 3
Portfolio 3 for the week ended August 2, 2024: DOWN ![]()
- Telus International announced they were rebranding to Telus Digital Experience (TELUS Digital). The name change will occur sometime in the third quarter of 2024.
Activity
No significant activity to report this week.
Dividends
Dividends Received this week for the following companies:
Companies followed by DRIP (Dividend Re-Investment Plan) indicate additional shares were purchased with the dividend. Any cash leftover was added to the cash balance.
Canadian $
Toronto-Dominion Bank (TSE: TD)
US $
No US$ dividends this past week.
Quarterly Reports
Microsoft Corp.
See report under Portfolio 2.
Real Matters Inc.
Third quarter 2024 financial results on Aug 1, 2024
Cloudflare, Inc.
See report under Portfolio 1.
Brookfield Renewable Partners L.P.
See report under Portfolio 1.
TELUS International (Cda) Inc.
Second quarter 2024 financial results on Aug 2, 2024