
For the past three weeks, economic news—covering economic output, labour markets, and inflation—has dominated market movements. This focus shifted this past week as over 40% of the S&P 500 companies reported their earnings. Strong reports, especially from the largest companies, could likely sustain the market’s upward trajectory. However, if earnings reports are underwhelming, the markets may continue the recent pullback.
Additionally, key updates such as the US economic growth data and the Federal Reserve’s preferred inflation measure were released. Ideally, the Fed wants the economy to stay strong while inflation cools down.
Let’s see how this shift toward corporate performance and the latest economic updates impacted the markets over the last week…
Items that may only interest or educate me ….
Canadian Economic news, US Economic news, Does it take a lot of time to invest in stocks? ….
Canadian Economic news
This past week’s key economic data that the Bank of Canada (BoC) considers when deciding whether to raise or lower the interest rate.
Bank of Canada Minutes
With a focus on keeping inflation under control, the BoC’s Governing Council met on April 10th and decided to hold the benchmark interest rate steady at 5.0%, a 23-year high. During their deliberations, they discussed the global economy, the Canadian economy, and the latest inflation data. The minutes from the meeting also reveal a divided council, with differing opinions on the timing of potential rate cuts.
Among the six members, some argued that the economy was performing well, bolstered by stronger-than-expected consumer spending, and continued economic growth in the US. These members believed these factors could prevent a slowdown in core inflation and preferred waiting for more evidence of sustained decreases in inflation before considering rate reductions.
Conversely, other members pointed to the considerable progress made in reducing inflation, which has dipped below 3%, with core inflation also on a downward trend. They expressed concerns that maintaining high rates for too long could unnecessarily suppress economic activity.
Despite these differing views, the council agreed inflation was still too high, but there was a consensus that inflation was likely to continue its decline, supported by favorable indicators such as easing inflation pressures and a cooling job market. The council unanimously agreed that any future rate cuts should be gradual to prevent reigniting inflationary pressures.
In a post-meeting press conference, Governor Tiff Macklem mentioned that a rate cut in June was possible, but it would be contingent on forthcoming data confirming the continued slowdown in inflation. The latest inflation data, released after the April 10 meeting, showed a 2.9% rise in prices in March and a third consecutive month of cooling core inflation. Continued signs of decreasing inflation in April and May could pave the way for a rate cut in June.
Canadian market volatility
Over the past week, Canada’s Volatility Index (VIXC), measured by the TSX 60 VIX, fell more than 10% from last week’s 15.29 to 13.67. This decrease in volatility is likely due to higher commodity prices, easing tensions in the Middle East, and strong corporate earnings.
Often referred to as Canada’s ‘fear gauge,’ the VIXC provides insights into expected volatility within the Canadian stock markets. Typically, readings above 20 signify high volatility, while those below 20 indicate lower levels. With the current reading at 13.67, it suggests that the market remains well below the threshold for high volatility
Retail Sales
Statistics Canada’s February Retail Sales report revealed a 0.1% decline, marking the second consecutive month of declines following a 0.3% drop in January. This was contrary to analysts’ expectations of a 0.1% increase. Year-over-year, retail sales increased by 1.2%. The most significant monthly gain was seen in ‘motor vehicle and parts dealers,’ while the largest annual increase was in ‘general merchandise retailers,’ which rose by 9.3%. On the downside, ‘gasoline stations and fuel vendors’ experienced the largest monthly and annual declines, dropping 2.2% and 4.0%, respectively.
Excluding the volatile sectors of ‘gasoline stations and fuel vendors’ and ‘motor vehicle and parts dealers,’ core retail sales remained unchanged in February, although they showed a 2.4% increase on an annual basis.
The continued decline in retail sales suggests that higher interest rates are still exerting pressure on the Canadian economy. However, a silver lining exists; reduced consumer spending could lead to decreased inflation, potentially encouraging the Bank of Canada to lower the benchmark rate in June.
US Economic news
This past week’s key data points that the Federal Reserve (Fed) considers when deciding whether to raise or lower the interest rate.
Personal Consumption Expenditure (PCE)
The Commerce Department’s Bureau of Economic Analysis’ latest PCE inflation report rose 0.3% in March after a similar increase in February. Year over year, the PCE increased 2.7% in March after rising 2.5% in February. Analysts had been expecting a monthly increase of 0.3% and a yearly increase of 2.6%. The majority of the increase was the result of higher spending on goods such as fuel and food, and services such as healthcare.
Excluding the volatile food and energy components, core PCE rose 0.3% in March. On an annual basis, core PCE came in at 2.8%, matching the February pace. Analysts had projected increases of 0.3% monthly and 2.7% year over year.
While the monthly pace of inflation growth matched expectations, both the headline PCE (all items) and core PCE were higher than expected. The recent data will not provide the Fed with “greater confidence” that inflation is declining and all but eliminates the chances of a June rate cut.
PCE is a crucial indicator of consumer confidence and economic health. Strong PCE growth suggests consumers are spending more, which can boost economic activity. Conversely, weak PCE growth might indicate a slowdown in consumer spending, potentially impacting economic growth.
While PCE and the Consumer Price Index (CPI) both measure inflation, PCE tracks the prices of a wider range of goods and services consumed by all households and non-profit institutions. This includes spending financed by others, like employer-provided health insurance. CPI focuses on the prices of goods and services purchased for out-of-pocket expenses by urban households only. It excludes items like employer-paid health insurance. CPI might tend to show slightly higher inflation rates due to its focus on out-of-pocket expenses
Here is an analogy: Imagine tracking grocery prices for a family. CPI might only look at the price changes for items they always buy, while PCE might consider if they switch to cheaper options due to price hikes.
Of the two, PCE is considered a more comprehensive measure of inflation by the Fed, often using it to guide its monetary policy (interest rate) decisions.
Gross Domestic Product (GDP)
The Commerce Department’s Bureau of Economic Analysis released its advance estimate for the first quarter of 2024, showing GDP growth slowed to an annual pace of 1.6%, an almost two year low and down considerably from the 3.4% increase in the fourth quarter of 2023. This latest rate fell below the analysts’ projection of 2.4%.
This growth was primarily driven by increases in consumer spending, residential and non-residential fixed investments, and government spending across all levels. However, these gains were partially offset by a decrease in private inventory investment. In terms of consumer spending, there was a notable rise in spending on services like healthcare, insurance, and financial services, which was tempered by a decline in spending on goods such as vehicles and parts.
GDP is a key indicator of a country’s economic health. A rising GDP generally signifies a growing economy, while a falling GDP suggests a slowdown. This latest reports suggests the American economy is slowing.
It is important to note that this “advance” estimate is based on source data that are incomplete or subject to further revision. The “second” estimate, which will include more complete data, is scheduled to be released on May 30, 2024.
American market volatility
The CBOE Volatility Index (VIX), often referred to as the market’s fear gauge, ended the week at 15.03, representing a decline of more than 20% from the previous week’s reading of 18.71. Lower tensions in the Middle East and strong corporate earnings have helped reduce the VIX. As the VIX remains below the 20-point threshold commonly associated with heightened volatility, the lower reading signals that investor anxiety is decreasing in the near term.
Consumer Sentiment Index (CSI)
The University of Michigan’s final CSI for this month registered at 77.2, slightly below analysts’ expectations of 77.9 and a near 3% decrease from March’s 79.4. Despite the monthly dip, the index has risen over 21% annually from last year’s 63.7. The modest monthly decline is likely attributable to persistent inflation and a slowing economy. Nevertheless, consumer sentiment has remained relatively stable, fluctuating narrowly between 75 and 80 throughout the year, suggesting that consumers see little change in the economic outlook.
The CSI is a key measure of consumer confidence in the economic direction of the US, with higher values indicating greater consumer optimism.
Does it take a lot of time to invest in stocks?
The short answer is “No, investing in stocks doesn’t necessarily require a lot of time.” However, investing in stocks can take as much or as little time as you choose. If you prefer a hands-off approach, consider investing in a low-cost S&P 500 (S&P) index fund. This type of fund tracks the top 500 stocks on major US exchanges, providing good diversification and mirroring the performance of the S&P 500 with minimal effort on your part. This strategy is an excellent starting point for beginners.
However, if you’re interested in a more hands-on approach, you could spend a considerable amount of time learning about the stock market, researching potential investments (reading financial statements, and articles about the company, etc.), and actively trading. The depth of your involvement depends on how much time you have available, your interest in market dynamics, and your investment goals.
For those who find themselves in between these two approaches, it can be exciting to look for potential breakout companies, akin to finding the next Amazon.com (NASD: AMZN). A hybrid approach might be ideal, offering a balance of risk and opportunities for higher returns. To build a balanced portfolio, you might start with foundational investments in an S&P 500 index fund and a TSX index fund that tracks the Toronto Stock Exchange. This provides a solid base while you periodically explore individual stocks to add to your portfolio.
Ultimately, your investment strategy should fit into your lifestyle. If you’re pressed for time, a passive strategy like investing in an index fund might be preferable. But if you stumble upon a company that excites you, it could be worth exploring further. Remember, the key is to enjoy the process and integrate it into your life in a way that feels rewarding.
Weekly Market Review
Monday: the markets started the week with all four indexes – the Toronto Stock Exchange Composite Index (TSX), the S&P 500 Index (S&P), the Dow Jones Industrial Average (DJIA), and the Nasdaq Composite Index (Nasdaq) – ending higher. Investors are betting that the big technology companies will start to see revenues boosted by their investments in artificial intelligence (AI). Oil prices dipped due to easing tensions in the Middle East and concerns over lower demand resulting from inflation.
In Canada, the TSX stretched its winning streak to four days, riding the coattails of a rebound in the American markets. In trading, Consumer Staples and Industrials posted the biggest gains, while Basic Materials (miners and fertilizer manufacturers) and Healthcare were the only Canadian sectors to end lower.
In the US, the S&P got back over 5000, snapping six straight days of losses. The Nasdaq also broke a six-day losing streak thanks to the rise in technology stocks. In trading, the Financials and Technology sectors recorded the largest gains, while Telecommunications Services and Basic Materials were the only American sectors to end in the red.
Tuesday: investors were bullish ahead of earnings from the big technology companies and the key PCE inflation data on Friday, sending all four indexes into positive territory for the day. Oil inched higher as investors gained confidence in an improved global economic outlook.
In Canada, a rebound in technology stocks pulled the TSX to its highest point in a week. In trading, every sector ended the day higher, led by Technology and Healthcare, with Utilities and Energy trailing the pack.
In the USA, strong earnings from some of the technology heavyweights sent the Nasdaq soaring, gaining almost 1.6% today. As well as being buoyed by technology stocks, the S&P also received a boost from General Motors (NYSE: GM) strong first quarter report. In trading, in a day of broad-based gains Technology and Healthcare were the big winners, while Basic Materials was the only sector to end in the red.
Wednesday: it was a mixed day for the four major North American indexes as investors hope first quarter earnings reports from the big technology companies can jumpstart the rally.
In Canada, the TSX slid lower for the first time in six days of trading. Retail sales for February came in lower than expected, providing more data that the Canadian economy continues to slow. In trading, Consumer Staples and Utilities advanced the most while Industrials and Telecommunications Services declined the most.
In the US, the Nasdaq ended higher, the S&P was flat, while the DJIA ended lower. Investors are waiting for the latest GDP and PCE inflation data due later this week to get a sense of when the Fed could lower the interest rate. In trading, Consumer Staples and Utilities posted the biggest gains, while Industrials and Healthcare recorded the biggest daily losses.
Thursday: the indexes started the session sharply lower and spent the rest of the day recovering those early losses. At the end of the trading day, only the TSX was able to get back into positive territory. The latest US GDP data showed the American economy grew much less than expected, while inflation remained above 3%. Oil prices rose on concerns of increased conflict in the Middle East.
In Canada, higher commodity prices lifted the resource heavy TSX into the green, overcoming the disappointing economic and inflation news out of the US. In trading, Basic Materials, Energy and Consumer Staples were the only Canadian sectors to gain ground, while Technology and Healthcare dropped the most.
In the US, besides the latest economic news, disappointing earnings and forward guidance from Meta Platforms (NASD: META) weighed on the indexes during regular trading hours. In the after-hours market, strong earnings reports from Alphabet (NASD: GOOGL) and Microsoft (NASD: MSFT) lifted the indexes. Hopefully, this upward momentum carries over into tomorrow’s session. In trading, Energy and Basic Materials posted the biggest gains, while Telecommunications Services and Technology posted the biggest losses.
Friday: the positive sentiment from Alphabet’s and Microsoft’s earnings reports helped restore investors’ confidence in technology stocks, propelling all four indexes higher. Oil prices rose on supply concerns in the Middle East.
In Canada, higher commodity prices, helped by a rally in technology stocks, pushed the TSX into positive territory. In trading, Basic Materials and Healthcare posted the biggest gains, while Telecommunications Services and Utilities were the only Canadian sectors to end in the red.
In the US, the S&P snapped three weeks of weekly losses and the Nasdaq snapped a four week weekly losing streak. Both posted their largest weekly gains since November 2023. The latest PCE inflation report was in line with expectations, showing a slight increase in the annual pace of inflation. In trading, the Technology and Consumer Cyclicals sectors advanced the most, while Utilities, Energy, and Consumer Staples were the only American sectors to end lower.
Weekly Market and Portfolio Review
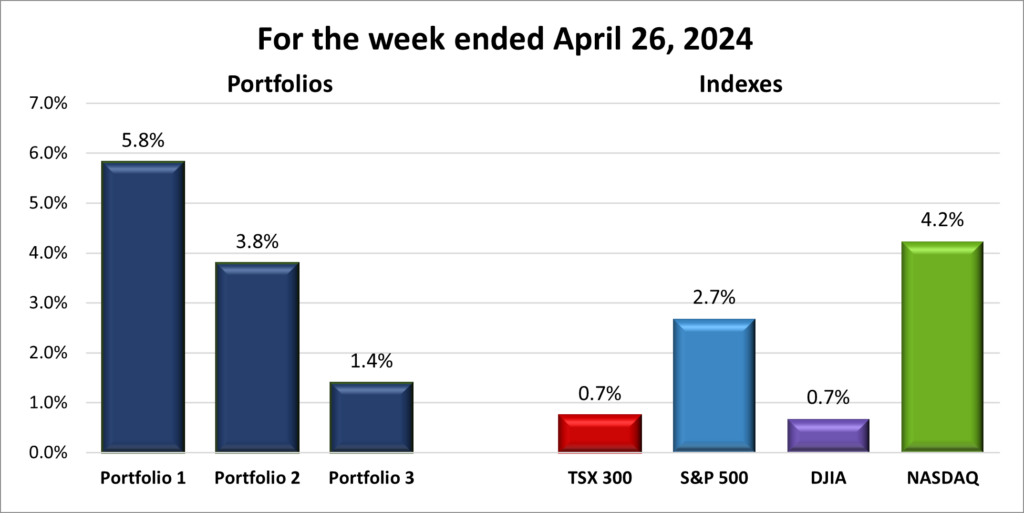
For the week, the TSX (SPTSX) gained 0.7%, the S&P 500 (SPX) rose 2.7%, the DJIA (INDU) advanced 0.7% and the Nasdaq (CCMP) surged 4.2%.
| Index | Weekly Streak |
| TSX: | 1 – week winning streak |
| S&P: | 1 – week winning streak |
| DJIA: | 2 – week winning streak |
| Nasdaq: | 1 – week winning streak |
![]() After three challenging weeks, all four major North American indexes finally posted a weekly gain. The Nasdaq, in particular, had its strongest week since November, indicating a robust rebound.
After three challenging weeks, all four major North American indexes finally posted a weekly gain. The Nasdaq, in particular, had its strongest week since November, indicating a robust rebound.
Economically, however, the picture remained less optimistic. The latest GDP delivered a double whammy: slowing economic growth coupled with persistent inflationary pressures, hinting at potential stagflation—a situation where the economy decelerates while inflation continues to rise. Moreover, the latest PCE data suggested that inflation remains above the Fed’s comfort zone, likely delaying anticipated rate cuts.
Despite the troubling economic indicators, investor sentiment began to improve as corporate earnings rolled in this past week. In the US, the ‘Magnificent 7’ companies experienced a loss on paper of nearly US $1 trillion in market value during the previous week’s selloff. However, strong earnings from Alphabet and Microsoft, highlighting significant returns from their respective substantial investments in AI, helped these companies recoup much of their losses and spearheaded a broad market rally. Meanwhile, in Canada, the TSX benefited from the improved investor sentiment and rising commodity prices, which contributed to its gains.
Next week promises more corporate earnings, featuring key reports from Apple (NASD: AAPL) and Amazon.com. Additionally, the Fed’s meeting will once again capture the attention of analysts and investors alike, who are eager for any clues regarding the timing of potential rate reductions within the year.
It is never pleasant to see markets and investments decline, but I viewed the recent pullback as a buying opportunity. I am hopeful that these April showers will set the stage for plenty of flowers in the months ahead. 😊
| Portfolio | Weekly Streak |
| Portfolio 1: | 1 – week winning streak |
| Portfolio 2: | 1 – week winning streak |
| Portfolio 3: | 1 – week winning streak |
![]() After being shut out of the weekly gains’ column last week, it was great to see all three portfolios in the win column this week, as illustrated below.
After being shut out of the weekly gains’ column last week, it was great to see all three portfolios in the win column this week, as illustrated below.
Portfolio 1 had an outstanding week, outperforming all four indexes and the other two portfolios. Last week, semiconductor companies weighed it down, but this week, many of those companies posted significant gains (more than 10%), helping the portfolio reclaim much of last week’s losses. Leading the gains were Navitas Semiconductor (NASD: NVTS) up 21%, Nvidia (NASD: NVDA) up 12%, and Lattice Semiconductor (NASD: LSCC) up 10%. Additionally, most other companies in the portfolio advanced, including Alphabet, which posted an 11% gain following the announcement of a dividend initiation and a share buyback plan, both shareholder-friendly actions.
Portfolio 2 also had a good week, largely driven by MongoDB’s (NASD: MDB) impressive gain of almost 16%.
Portfolio 3, which had been posting losses for the last five weeks, finally snapped that losing streak with a win this past week. Unfortunately, Adyen NV (OTCM: ADYEY) experienced a poor week following a disappointing earnings report and dropped 14%, preventing the portfolio from achieving gains similar to the other two portfolios
Overall, this past week marked a significant recovery from previous losses, although it will take more weeks like this to fully recoup the setbacks from April. The rebound in the technology sector played a crucial role in driving these gains. Looking ahead, I hope the positive momentum continues, fueled by strong earnings reports and favorable outcomes from the upcoming Fed meeting.
Companies on the Radar
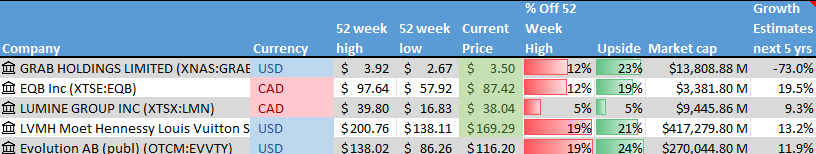
 Two new companies popped onto my radar this past week: Grab Holdings (NASD: GRAB) and LVMH Moët Hennessy – Louis Vuitton, Société Européenne (OTCM: LVMUY).
Grab is a large cap technology company based in Singapore, operating throughout Southeast Asia. I was particularly impressed by their expansive portfolio, which includes ride-hailing, food delivery, and digital payments—a trifecta that positions them well in a rapidly growing region. Their regional dominance, as well as their commitment to innovation to economically empower millions of people throughout southeast Asia led me to invest and become a very minority owner. 😊 You can see more about why I chose to invest in the company in the Activity section of Portfolio 1 below.
LVMH is a giant in the luxury goods industry, offering a vast array of products from wines and spirits like Dom Pérignon and Moët & Chandon, to high-end fashion through brands like Louis Vuitton, and even luxury yachts. LVMH is listed primarily on Euronext Paris, ticker 1MC, but is also accessible in North America via the Over-the-Counter Market. The fact that company insiders own 48% of its shares speaks volumes about their confidence and commitment to the company’s success. I am looking forward to delving deeper into this high-end, luxury retail giant.
These two new companies join the three companies listed below:
- Equitable Bank (TSE: EQB), a mid sized Canadian bank, considered Canada’s 7th bank, that provides financial services to consumers and businesses.
- Lumine Group (TSE: LMN), a young Canadian mid sized company that acquires communications and media software companies and then strengthens and grows those companies.
- Evolution AB (OTCM: EVVTY), a Swedish company that provides live casino solutions for global gaming operators.
Please keep in mind that these are only companies that have piqued my interest. This is not a recommendation or financial advice. You should do your own research or contact a professional before making any investment decisions.
The Radar Check was last updated April 26, 2024.
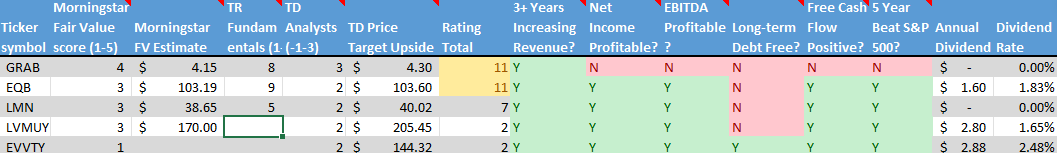
NOTE: Morningstar and Thomson-Reuters analysis is unavailable for Evolution and LVMH from my usual sources because the company’s home stock exchange is in Europe. While it is possible to invest in both companies through the Over-the-Counter Market, I do not have access to analysis similar to the data available for companies traded on the major North American stock exchanges (Toronto Stock Exchange, New York Stock Exchange, and Nasdaq Stock market). The Analysts Rating and Price Target for these two companies are from Yahoo! Finance, under the Analysis tab once you have searched for the ticker.
Portfolio Update
Portfolio 1
Portfolio 1 for the week ended April 26, 2024: UP ![]()
- Apple is negotiating with FIFA, soccer’s governing body, for global television rights for a new month-long club tournament. The deal is in the US$ 1 billion range and would be the first time FIFA has done a deal with a single global contract.
In other Apple news, the company shipped 19% fewer iPhones in China in the first quarter than the previous year, lowering their percent of the Chinese market to 15.7%. The bulk of the losses were a result of new products from China’s Huawei. - Alphabet announced the start of a quarterly cash dividend program. The first dividend in the amount of US$ 0.20 per share will be paid June 17, 2024. The company also announced a US $70 billion stock buyback.
A strong first quarter earnings report and news of the dividend sent Alphabet, better known as Google, stock soaring and gave the company a market capitalization (number of outstanding shares X price per share) above US$2 trillion.
Activity
Received interest on TD 1-year cashable GIC.
Bought: Visa (NYSE: V) With some of the proceeds from the sale of Nvidia shares, I increased my investment in Visa, the leading global payments company. Visa commands a significant market share and is a globally recognized brand, qualities that translate into a steady revenue stream and robust profitability. Unlike credit card issuers, Visa earns fees from processing transactions, which shields it from the direct credit risks associated with payment defaults. This business model provides stability and predictability in its revenues.
The growth potential in digital payments, especially in emerging markets, is substantial. As these regions transition from cash to digital payments, Visa’s extensive network and continuous innovations, such as advancements in secure and contactless payment technologies, position it well to capitalize on this shift.
Visa’s financial health is a strong point, marked by consistent growth in revenue, net income, and free cash flow, alongside impressive profit margins and a solid balance sheet.
However, the investment does carry risks, including susceptibility to economic downturns that can depress consumer spending and transaction volumes. The payment sector’s increasing competitiveness requires continual innovation to maintain market leadership. Visa’s regulatory environment is also a critical consideration, as changes could affect operational costs and profitability. Additionally, the inherent risks of cybersecurity pose a threat to Visa’s operations and reputation.
Despite these challenges, the shift towards cashless transactions globally should benefit Visa. By increasing my stake in Visa, I aim to leverage this ongoing trend towards digital payments, expecting it to drive the company’s growth and, subsequently, my long-term wealth accumulation. 😊
Bought: GRAB Holdings After recent investments in well-established companies like Walmart (NYSE: WMT), Amazon, and Visa, I saw an opportunity to diversify with a high-growth potential stock like Grab Holdings. Since its IPO in 2021, Grab’s stock has seen significant fluctuations, currently priced between US$ 2.00 – 3.00, down from a high of US$ 16.37 back in November 2021.
Grab is a leader in Southeast Asia’s ride-hailing and digital payments sectors, which are part of regions experiencing rapid digital adoption and economic growth. Its strategy revolves around a “superapp,” which integrates mobility, delivery, and financial services into a single platform, creating multiple revenue streams and fostering customer loyalty. Importantly, Grab is founder-run, which often results in strong visionary leadership and cohesive strategic direction.
Despite current unprofitability, Grab has demonstrated solid revenue growth, with a 60% increase in the Philippines alone last year. Key financial metrics like gross profit, net income, and free cash flow are trending positively, indicating improving operational efficiency.
Focusing on digital banking and advertising, Grab is well-positioned to leverage Southeast Asia’s expanding middle class and smartphone penetration.
However, as with any growth company, investing in Grab comes with a higher level of risk, especially given its short market history and ongoing losses, which make its long-term profitability uncertain. Competition in Southeast Asia is fierce, and regulatory changes could significantly impact operations, particularly in digital payments and financial services. As well, investing in companies based and operating outside North America carries additional risks such as obtaining accurate and timely information.
Overall, despite its challenges, Grab’s strong market position in a high-growth region offers a significant growth and diversification opportunity. This investment complements my existing holdings in more stable, mature companies, enhancing the overall growth potential of the portfolio.
Dividends
Dividends Received this week for the following companies:
Companies followed by DRIP (Dividend Re-Investment Plan) indicate additional shares were purchased with the dividend. Any cash leftover was added to the cash balance.
Canadian $
BCE Inc (TSE: BCE)
US $
No US$ dividends this past week.
Quarterly Reports
General Motors Co.
First quarter 2024 financial results on April 23, 2024
Visa Inc.
Second quarter 2024 financial results on April 23, 2024
Canadian National Railway Company
First quarter 2024 financial results on April 23, 2024
Celestica Inc.
First quarter 2024 financial results on April 24, 2024
Alphabet Inc.
First quarter 2024 financial results on April 25, 2024
Portfolio 2
Portfolio 2 for the week ended April 26, 2024: UP ![]()
- Guardant Health (NASD: GH) announced that the US Food and Drug Administration Medical Devices Advisory Committee is set to review Guardant’s premarket approval application for its Shield blood test for colorectal cancer screening on May 23.
- TC Energy (TSE: TRP) has resumed regular operations of their pipeline from the Alberta oil sands to the US after a break in a pipe caused the pipeline to run at lower capacity. The rupture itself caused a wildfire which has since been put out.
Activity
No significant activity to report this week.
Dividends
Dividends Received this week for the following companies:
Companies followed by DRIP (Dividend Re-Investment Plan) indicate additional shares were purchased with the dividend. Any cash leftover was added to the cash balance.
No dividends this past week.
Quarterly Reports
Microsoft Corp.
Third quarter 2024 financial results on April 25, 2024
Portfolio 3
Portfolio 3 for the week ended April 26, 2024: UP ![]()
- Microsoft announced an AI model that uses smaller amounts of data to create content and social media posts. The new AI model is called Phi-3-mini.
- Enghouse (TSE: ENGH) has reached an agreement to acquire SeaChange International, Inc. (OTCM: SEAC). SeaChange provides video streaming capabilities to broadcasters and content owners. The addition of SeaChange’s products will augment Enghouse’s enterprise software capabilities and solutions.
Activity
No significant activity to report this week.
Dividends
Dividends Received this week for the following companies:
Companies followed by DRIP (Dividend Re-Investment Plan) indicate additional shares were purchased with the dividend. Any cash leftover was added to the cash balance.
No dividends this past week.
Quarterly Reports
Microsoft Corp.
See report under Portfolio 2.