If you belong to a gym, you’ve likely witnessed the annual surge of enthusiastic newcomers in January, only to see their numbers dwindle by month’s end. Fueled by New Year’s resolutions, these gym newbies arrive with ambitious weight loss and fitness goals. However, many find themselves derailed by a combination of factors, including unrealistic expectations of quick results, gym intimidation, scheduling conflicts, and waning motivation.
The journey into investing shares more with this phenomenon than one might initially think. Both require not just a pledge of time and resources but a carefully considered plan tailored to personal aspirations, an ability to handle the inevitable ups and downs, emotional steadiness in decision-making, and, importantly, a network of support to navigate the unpredictable.
However, investing holds a unique advantage – the ability to let your investments work for you, growing your wealth with perhaps less daily effort than a fitness regimen demands. This distinction, among others, might just make the investing journey a bit more appealing to some. 😊
Hopefully, you are now motivated enough to stay with me as we dive into this past week’s updates. What did this past week bring us? Let’s delve in and find out…
Items that may only interest or educate me ….
Canadian Economic news, US Economic news, The market bandwagon, ….
Canadian Economic news
This past week’s key economic data that the Bank of Canada (BoC) considers when deciding whether to raise or lower the interest rate.
Bank of Canada’s monetary policy decision
As expected, Canada’s central bank maintained a pause on its key interest rate, leaving it unchanged at 5%. This was the fifth straight time the BoC has left the rate at 5%. This pause means the lending rates will remain at a 22 year high for consumers and businesses.
More importantly, in the post meeting press conference, BoC Governor Tiff Macklem said it was “still too early to consider lowering the policy interest rate” despite recent inflation data being lower than expected. Mr. Macklem pointed out that core inflation (excludes volatile food and energy prices) was still in the 3.5% range and the BoC wants to see continued reduction in the core inflation towards their 2% target. According to Mr. Macklem, by focusing on core inflation they get a sense of the underlying trend in inflation and where inflation might be headed. The unexpected economic growth at the end of 2023 alleviated any pressure to lower the rate to avoid a recession. If economic growth had remained stagnant there would have been calls to cut the rate to prevent the economy from going into a recession.
He also echoed comments from their last meeting that their discussions were more about how long the rate needed to remain at the current rate rather than if additional rate increases were necessary.
The BoC says they want more data showing underlying inflation continues to fall. I suspect the central bank wants to get a sense of the federal government’s upcoming budget on April 16 before deciding to lower the rate. If the government appears to be about to continue its spending ways, that could put upward pressure on inflation. By maintaining the current rate, the BoC gives itself time to see what new spending is in the federal budget, as well as collect more economic (gross domestic production and job statistics) and inflation (consumer price index and personal consumption expenditures) data.
The next monetary policy meeting for the BoC is scheduled for April 10, 2024.
Labour Force Survey (LFS)
The February Labour Force Survey from Statistics Canada reveals subtle shifts in the country’s employment landscape. Employment inched up 0.2% for the second consecutive month, contributing to an annual growth rate of 1.8%. Despite these gains, the unemployment rate edged up from 5.7% in January to 5.8% in February, largely due to Canada’s rapid population growth. This slight increase reflects a broader trend of steady unemployment rates around 5.8% over recent months.
A bit of good news for the BoC, wage growth appears to be slowing, with February’s year-over-year increase at 5.0%, a slight decrease from January’s 5.3%. Slowing wage growth relieves underlying pressure on inflation.
A closer examination of employment sectors reveals a 0.4% monthly increase in public sector jobs and an annual jump of 4.7%. In contrast, the private sector saw a slight monthly decline of 0.1%, although it recorded a 1.2% increase year over year.
Otherwise, the higher interest rate continues to act as a drag on the Canadian economy. The higher rates dampen consumer spending and subsequently impact business revenues. Combined with rising average wages, this environment challenges companies’ ability to expand their workforce and reinvest profits, potentially contributing to the recent stagnation in GDP growth.
Canadian market volatility
This past week, Canada’s volatility index (VIXC), represented by the TSX 60 VIX, fell to 11.63, a 7% decrease from the previous week’s 12.53. The decline in the VIXC coincided with comments from the BoC regarding when interest rates might drop.
A lower VIXC suggests that investors are less anxious about future market movements. The VIXC gauges volatility within the Canadian stock markets, with readings above 20 generally viewed as ‘high’ and those below 20 as ‘low’. The current reading of 11.63 sits on the lower end of the spectrum, suggesting investors are less anxious about future market moves and that they remain confident in the Canadian markets.
US Economic news
This past week’s key data points that the Federal Reserve (Fed) considers when deciding whether to raise or lower the interest rate.
Mr. Powell went to Washington
This week, Fed Chair Jerome Powell provided testimony to Congress, affirming the likelihood of interest rate cuts within the year. He expressed confidence that the that the US was on “a good path” towards a ‘soft landing,’ citing current conditions as favorable. Moreover, Powell emphasized the Fed’s commitment to keeping their heads down to avoid political distractions and focusing on their primary goal of reducing inflation to the 2% target, particularly throughout the election year.
Labour reports
Three recent labour market reports provide a snapshot of the current state of the American economy. Analyzing the latest data from the Job Openings and Labor Turnover Survey (JOLTS), ADP National Employment Report, and the Employment Situation Summary (ESS) reveals key trends in employment, and wage growth that can influence future economic policy.
Job Openings and Labor Turnover Survey (JOLTS)
The Labor Department’s January JOLTS reported 8.9 million job openings, matching the revised figure for December which had originally come in at 9.026 million. This consistency indicates a stable demand for labour. Throughout 2023, the labour market saw an average of 9.4 million new job openings per month, a decrease from the 11.2 million average in 2022, a year marked by robust re-hiring efforts as America rebounded from the COVID-19 pandemic lockdowns.
ADP National Employment Report
The ADP National Employment Report for February reported the addition of 140,000 jobs in the private sector, slightly below the anticipated 150,000. The report also pointed to a deceleration in wage growth, with February marking a 5.1% year-over-year increase in salaries — the slowest pace of wage gains since August 2021. This suggests a cooling in the labour market’s wage inflation pressures.
The ADP report offers insights into employment trends based on payroll data from ADP’s client base.
Employment Situation Summary (ESS)
The Bureau of Labor Statistics released its ESS for February, revealing an increase in nonfarm payroll jobs by 275,000, surpassing the anticipated 200,000 gain but well below the unexpected increase of 353,000 jobs in January. Despite these job gains, the unemployment rate edged up to 3.9%.
Average hourly earnings saw a modest increase of 0.1% in February, falling short of the 0.3% gain many analysts had predicted, after a stronger rise of 0.6% in January. Year-over-year, wage growth decelerated slightly to 4.3%, meeting expectations but a decrease from the 4.5% growth observed in January.
The latest ESS report suggests January’s increase in job gains was a one-month outlier rather than a true sign of underlying strength in the labour market. Wage growth has also slowed down after January’s jump. Both are good signs that the economy remains strong while inflationary pressures continue to fall.
Summary
These recent JOLTS, ADP, and ESS reports showing a slowdown in new job creation suggest that the American economy remains strong but may be beginning to moderate. The accompanying deceleration in wage growth further hints at diminishing inflationary pressures. While this slowdown might not be good news for workers seeking wage increases, it is good news for the Fed’s objective of cooling the economy. However, despite these indicators, it remains uncertain how this data will influence the Fed’s decisions on when to lower interest rates.
American market volatility
The CBOE Volatility Index (VIX), often viewed as a barometer of market fear and uncertainty, saw a rise of 7% from 13.75 on March 1 to 14.74 on March 8. This uptick suggests signals an anticipation of heightened market volatility in the near term.
The VIX is integral to understanding volatility within the American stock markets, where readings above 20 are typically considered ‘high’, indicating increased fear or uncertainty, while values below 20 are deemed ‘low’, suggesting a calmer market environment. Despite the recent increase, the current VIX level of 14.74 is situated towards the lower end of the spectrum, indicating that while there is a slight rise in investor anxiety, it remains relatively low.
The market bandwagon
When the markets are on an upswing, it is akin to the most sought-after party in town. Have you noticed how during these bullish periods, even individuals who have previously shown little interest in stocks begin obsessively checking updates on the TSX, S&P, Nasdaq, or the latest buzzworthy tip? There is an energy that transforms investing from a mere task into an exhilarating game where it seems everyone is winning. This allure not only draws in new investors but makes them eager to follow every market fluctuation with the zeal of an adventurer.
However, when the tide turns and the markets plummet, it feels as though someone has abruptly stopped the music. The once inviting party loses its charm, and the exit becomes the most popular spot. Why do new investors, so engaged during prosperous times, seemingly vanish at the first hint of a downturn?
Initially, the ascent of the market feels like unwrapping a gift — anticipation often rewarded with delight. Stories of overnight fortunes flood our social media feeds and dominate our conversations, breeding a potent fear of missing out (FOMO) that keeps investors glued to their screens, eager for a share of the goldrush. Yet, when the market faces a downturn, the narrative flips — portfolios that once sparkled with potential now bleed red, replacing triumph with tales of caution and regret. This stark contrast is jarring, particularly for new investors, illustrating the stark realities of risk, and transforming what was once a thrill into a source of anxiety.
Understanding loss aversion — our innate tendency to fear losses more than we value gains — is crucial. This psychological principle means that the pain of seeing investments shrink during a bear market often overshadows the joy of earlier gains. For a novice investor, this pain is not just about financial loss; it is a rude awakening to the inherent risks of the stock market, which can prompt a retreat from the investing world altogether.
One of the first lessons I learned from the market downturn of 2022 was the value of diversification. Having investments spread across various asset classes did not prevent losses but certainly cushioned their impact. This is a fundamental strategy that new investors can learn during challenging times.
Bear markets, despite their intimidation, are filled with learning opportunities. They are the periods that test and ultimately strengthen an investor’s resolve, strategy, and understanding of the market. Engaging with resources — books, online courses, or investment communities — can provide support and deepen your knowledge of the world of investing. Turn these challenges into valuable lessons.
In my own investing journey, the bear market of 2022 was a trial by fire that underscored the importance of patience, diversification, and a long-term perspective. The downturn was a classroom, filled with lessons that no bull market ever could replicate.
So, to all the new investors out there, feeling jittery when the market resembles a roller coaster is completely normal. I, too, started as a new investor once, fully acquainted with those very jitters. Despite having been in the investing game for several years, the bear market of 2022 was far from a joyride. Yet, it is important to remember that perseverance through the downturns does more than just make the upswings feel more rewarding. Along the way, you will amass not just wisdom and experience but potentially grow your wealth as well. 😊
Weekly Market Review
Monday: the markets stumbled out of the gate to start the week with all four indexes ending in the red. Investors were being cautious in a week that features the latest jobs data from Canada and the US. In addition, the BoC meets on Wednesday to provide an update on the Canadian benchmark interest rate, while Fed Chair Jerome Powell is scheduled to testify before the US Congress. Oil prices dropped on lower demand and higher production.
In Canada, lower oil prices and a late afternoon swoon sent the Toronto Stock Exchange Composite Index (TSX) into the red. In trading, Basic Materials (miners and fertilizer manufacturers), Utilities, and Financials were the only Canadian sectors to record a gain, while the biggest losses were incurred by the Healthcare and Consumer Staples sectors.
In the US, the S&P 500 Index (S&P), the Dow Jones Industrial Average (DJIA), and the Nasdaq Composite Index (Nasdaq) all retreated from respective record highs they set last week. Investors are waiting for the latest jobs data to get a sense of how the US economy is performing which in turn could provide insight into the timing of a future rate cut. In trading, Utilities and Basic Materials gained the most, while Consumer Cyclicals and Energy dropped the most.
Tuesday: all four indexes were dragged lower by a retreat in big technology and semiconductor stocks. Investors eyebrows were raised after an official from the Fed said he foresaw only one rate cut this year, and that was in the second half of the year. After chasing AI stocks higher the last few weeks, investors may be taking a breather and are taking some money off the table.
In Canada, gold prices moved to a record high, but it was not enough to offset the pullback in technology stocks. Analysts expect the BoC will maintain the current 5.0% interest rate at their meeting tomorrow. In trading, Energy, Financials and Utilities were the only Canadian sectors to end in the green. The Technology sector ended deep in the red with a 2.7%, no other sector lost more than 1.0%.
In the US, mixed economic data has investors waiting to hear Fed Chair Powell’s semi-annual monetary policy testimony before Congress over the next two days for clues to when the rates may start to fall. In trading, Energy, Telecommunications Services and Financials were the only sectors to finish higher, while Technology and Basic Materials suffered the biggest declines.
Wednesday: after two straight days of losses, the markets rebounded with all four indexes closing in the green. During Fed Chair Powell’s testimony before the House of Representatives, he said, “it will likely be appropriate to begin dialing back policy restraint at some point this year.” Investors took that bit of good news and pushed the markets higher. Oil prices rose on lower US crude oil inventories, the extension of production cuts and expected interest rate cuts later in the year.
In Canada, the BoC maintained the benchmark interest rate at 5% but hinted at lower rates ahead. The good news from the heads of two central banks helped lift the TSX close to a two-year high. In trading, Basic Materials and Consumer Staples led all gainers, while Healthcare and Industrials were the only sectors to retreat.
In the USA, the House of Representatives passed a bill to provide funding for federal government agencies until the end of September. Mr. Powell’s comments that the US economy remained strong, and rates should come down later this year was met with relief by analysts and investors alike. It was a good day in trading with all sectors ending higher except for Consumer Cyclicals. The advance was led by the Basic Materials and Technology sectors.
Thursday: the indexes posted their second straight day of gains as Mr. Powell once again reiterated the Fed’s intention to lower the interest rate sometime this year, provided inflation continues to drop. Oil prices were down but that was not enough to prevent the Energy sector in both countries from advancing.
In Canada, the TSX was lifted by a rally in technology stocks, and higher gold prices. In trading, Technology and Consumer Staples posted the biggest gains, while Healthcare was the only Canadian sector to end lower.
In the US, the S&P appeared to have shrugged off a slow start to the week and raised the closing bar to another record high. The Nasdaq hit an intraday record high before falling back to close just below its all time high. In trading, Technology and Basic Materials were the big winners, while Telecommunications Services was the only American sector not to advance.
Friday: the markets stumbled to start the week and stumbled to end the week. After the two-day run up, many investors took profits in afternoon trading going into the weekend, sending all four indexes into the red. Gold prices remained at an all time high, while oil prices fell on concerns of softening demand from China.
In Canada, the latest employment survey showed more new jobs than expected, higher unemployment and slowing wage growth. The results left investors feeling a rate cut in June may be possible. In trading on Bay Street, Technology, Healthcare and Utilities were the only Canadian sectors to end in the green, while Energy and Telecommunications Services suffered the biggest losses.
In the US, recent jobs data showed both new jobs and unemployment higher than expected, providing investors with increased confidence the Fed may start lowering interest rates in June. In trading on Wall Street, Telecommunications Services and Consumer Staples posted the biggest gains, while Technology and Consumer Cyclicals incurred the biggest losses.
Weekly Market and Portfolio Review
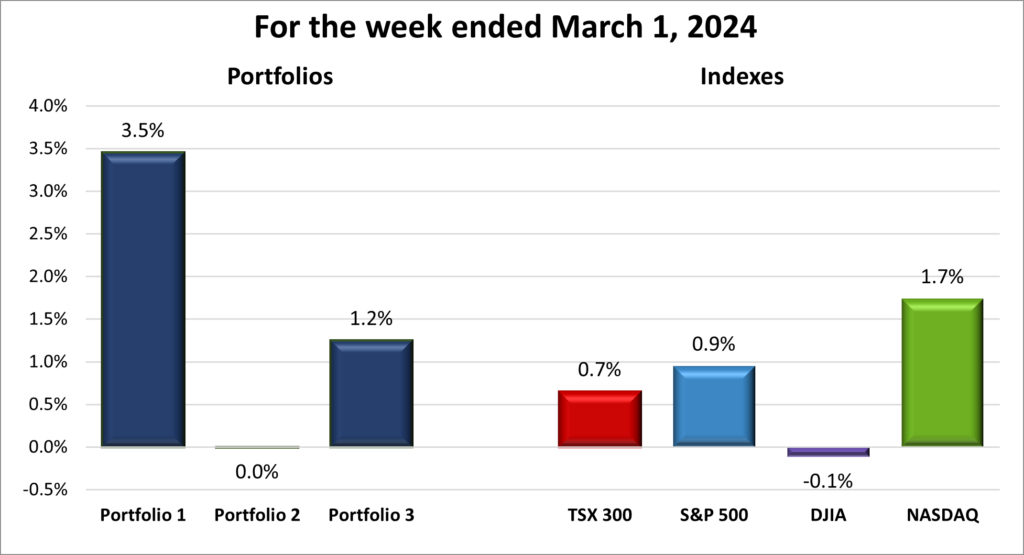
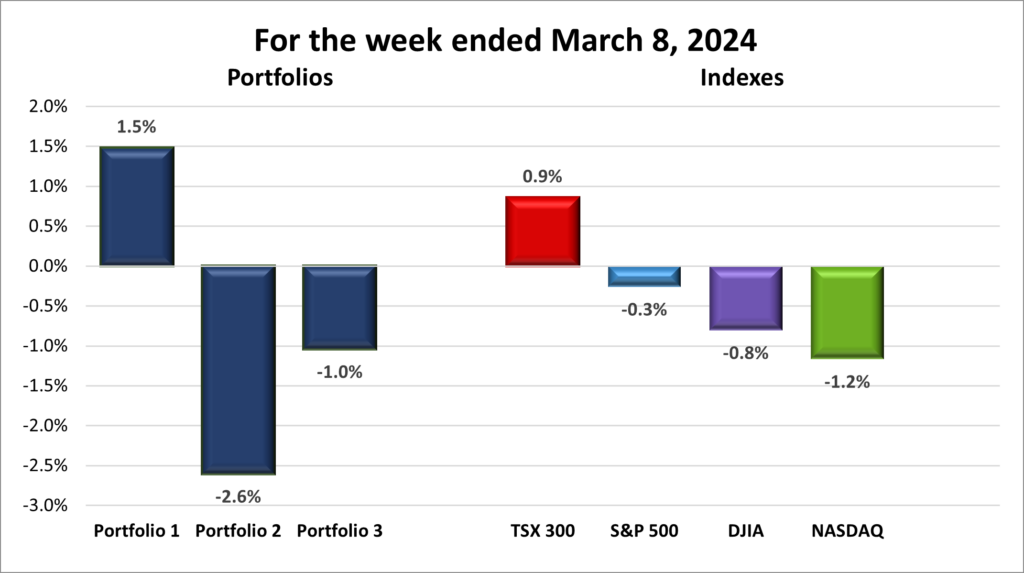
For the week, the TSX (SPTSX) gained 0.9%, the S&P 500 (SPX) slipped 0.3%, the DJIA (INDU) dropped 0.8% and the Nasdaq (CCMP) fell 1.2%.
| Index | Weekly Streak |
| TSX: | 4-week winning streak |
| S&P: | 1-week losing streak |
| DJIA: | 2-week losing streak |
| Nasdaq: | 1-week losing streak |
![]() Looking at the chart above, the major North American indexes started slow, gained momentum, and then retreated on Friday. Only the TSX rose, extending its winning streak to four weeks. All three US indexes closed lower, with the DJIA experiencing its worst week since October 2023.
Looking at the chart above, the major North American indexes started slow, gained momentum, and then retreated on Friday. Only the TSX rose, extending its winning streak to four weeks. All three US indexes closed lower, with the DJIA experiencing its worst week since October 2023.
Central bank commentary and jobs reports were key market drivers. In Canada, BoC Governor Macklem hinted at a future rate cut, suggesting the BoC is no longer focused on raising rates. Conversely, Fed officials, including Chair Powell, emphasized the strength of the US economy and jobs market, suggesting they are in no rush to lower rates. However, Powell, in his congressional testimoney this past week, reiterated the possibility of rate cuts later in the year. This was the good news.
The not so good news was labour data from both countries showed continued job growth, with unemployment edging up slightly and wage growth slowing. This data supports the central banks’ view that they can remain patient with interest rate decisions. While the US appears well-positioned for a soft landing, the situation in Canada remains less clear. Still, these reports provide both central banks with more time to monitor inflation data before making policy changes.
With job markets holding steady, attention now shifts to upcoming inflation reports. Next week brings the US Consumer Price Index (CPI) data, followed by Canada’s CPI report the week after. The outcome of these reports will likely influence whether central banks can ease rates sooner rather than later or need to maintain them longer to control inflation. Keep your fingers crossed for falling inflation numbers. 😊
| Portfolio | Weekly Streak |
| Portfolio 1: | 10-week winning streak |
| Portfolio 2: | 4-week losing streak |
| Portfolio 3: | 1-week losing streak |
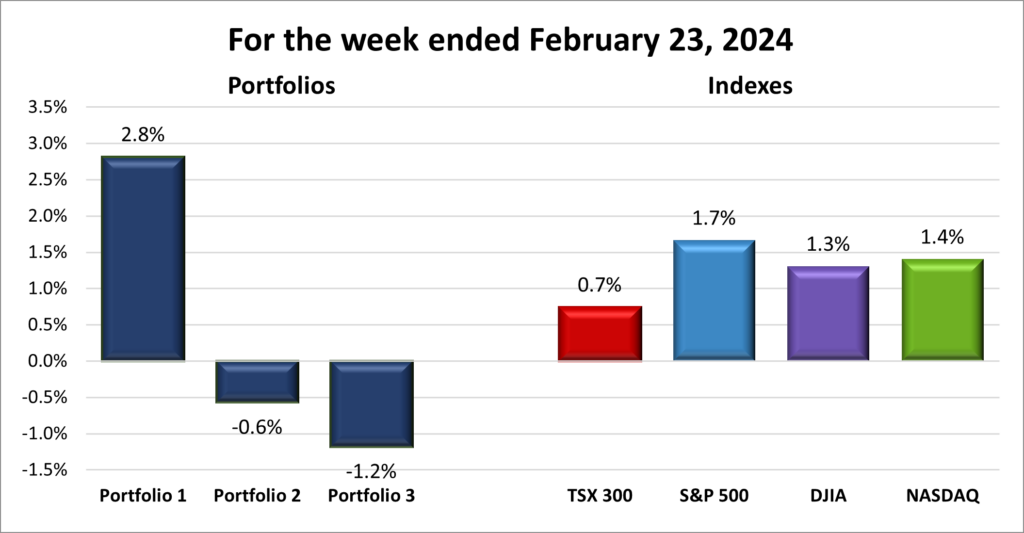
![]() Given the overall poor performance in stock markets this past week—where only the TSX registered a gain—it came as a surprise that Portfolio 1 increased in value, while the other two portfolios lost ground, as illustrated in the chart below.
Given the overall poor performance in stock markets this past week—where only the TSX registered a gain—it came as a surprise that Portfolio 1 increased in value, while the other two portfolios lost ground, as illustrated in the chart below.
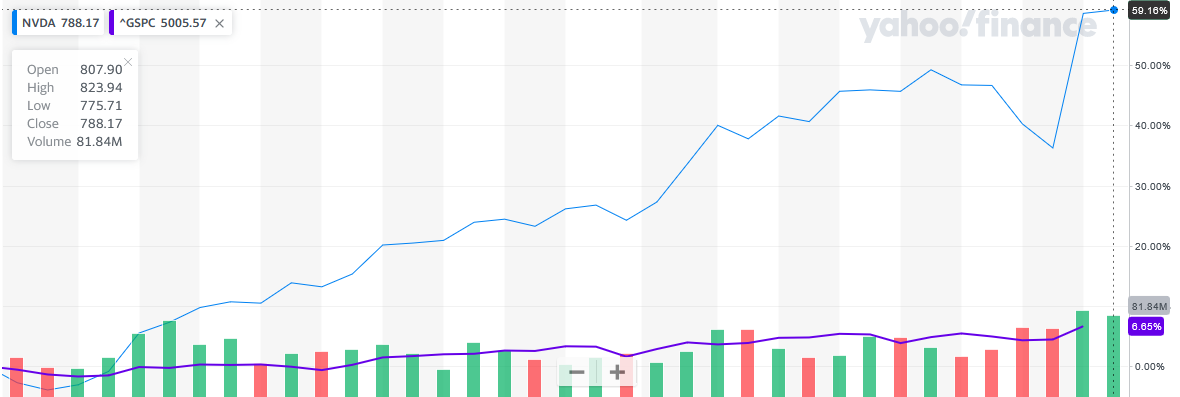
Looking at the weekly performance of the companies held in Portfolio 1 there were a lot of ups and downs with many companies ending the week either slightly higher or lower. There were a few significant moves (changes in share price greater than 10%) this past week. Gains in Rivian (NASD: RIVN), up 16%, and Celsius Holdings (NASD: CELH) up 10%, were partially offset by losses in Navitas (NASD: NVTS), Nuvei (TSE: NVEI), Tesla (NASD: TSLA) down 16%, 13% and 11%, respectively. Despite all the ups and downs, the significant increase in Nvidia’s share price by US$ 33.62 was a key driver of Portfolio 1’s growth, although a nearly US$100 drop on the final day tempered the overall gains. ☹
Despite solid performances from financial sector companies and a slim majority of companies ending the week slightly higher, a 12% drop in MongoDb’s value (NASD: MDB) weighed heavily on Portfolio 2.
It wasn’t a good week for Portfolio 3. Not only were there no sizable gains, but most of the companies in the portfolio saw their respective share prices decrease slightly. The silver lining would have to be that at least there were no significant drops. 😊
After a strong run to start the year I guess the portfolios were due for a slight pullback but I’d wish Portfolios 2 and 3 would hurry up and join Portfolio 1 in the win column. 😊
Companies on the Radar
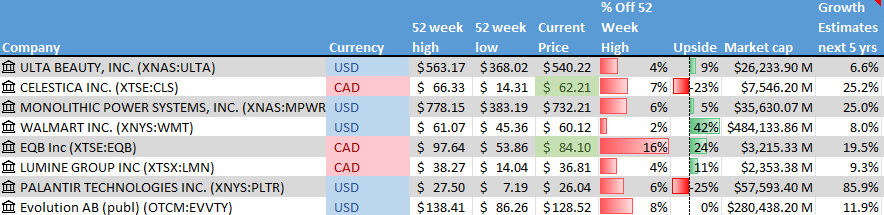
 This past week, three new companies came onto my radar – Palantir Technologies (NYSE: PLTR), Monolithic Power Systems (NASD: MPWR), and Evolution AB (OTCM: EVVTY). Despite their significant market capitalizations, these companies could not be more different from each other.
Palantir, an American company, has carved a niche with its AI-enabled software platform, primarily serving intelligence agencies for anti-terrorist efforts. Meanwhile, Monolithic Power, another US based company, is a leader in designing semiconductor-based power electronics solutions for diverse industries. Across the Atlantic, Evolution AB of Sweden is revolutionizing live casino solutions for global gaming operators, enriching the gaming experience for end-users. As you can see, though vastly different, each company provides unique growth prospects and possibilities.
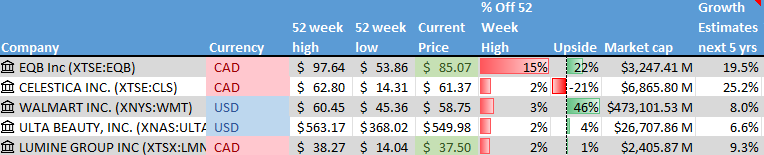
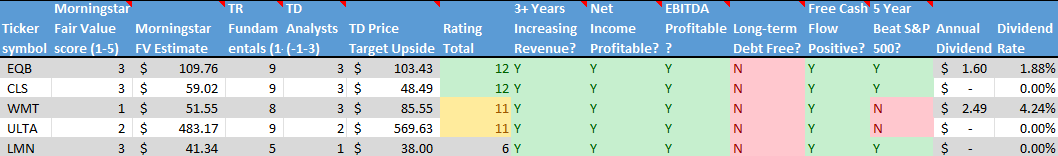
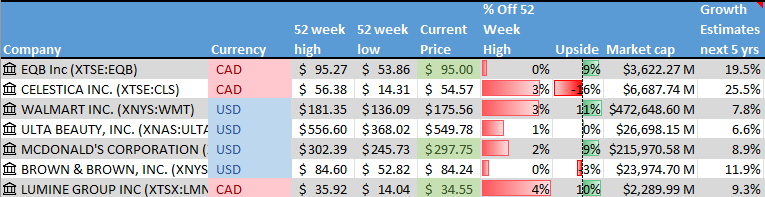
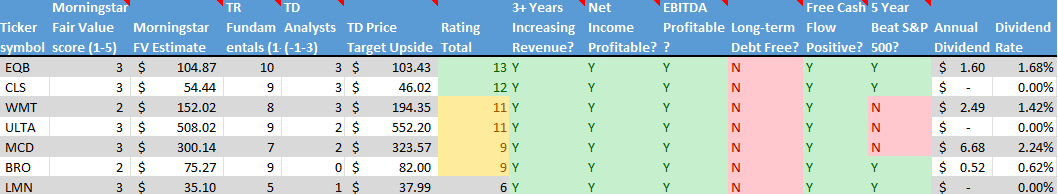
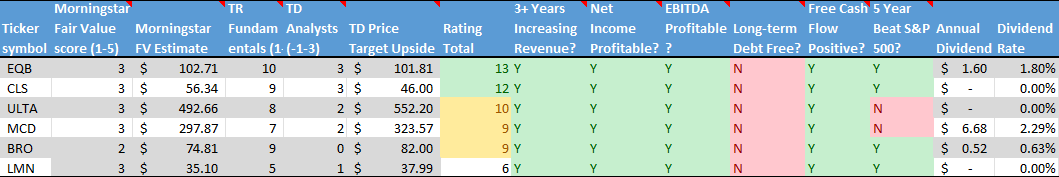
With these three additions, the roster of companies on my radar has expanded to eight companies, making the list a bit crowded. The insights from my radar test, shown below, should help whittle down the list to a more focused group of contenders.
Check back next week to see which of these companies makes the cut to remain on the list.
- Ulta Beauty (NASD: ULTA), a major American beauty product retailer, with over 25,000 products from 600 brands.
- Celestica Inc. (TSE: CLS), a medium sized Canadian company that manufactures electronic products and provides supply chain services to companies around the world.
- Walmart (NYSE: WMT), the large American global retail chain.
- Equitable Bank (TSE: EQB), a mid sized Canadian bank that provides financial services to consumers and businesses.
- Lumine Group (TSE: LMN), a young Canadian mid sized company that acquires communications and media software companies and then strengthens and grows those companies.
Please keep in mind that these are only companies that have piqued my interest. This is not a recommendation or financial advice. You should do your own research or contact a professional before making any investment decisions.
The Radar Check was last updated March 8, 2024.
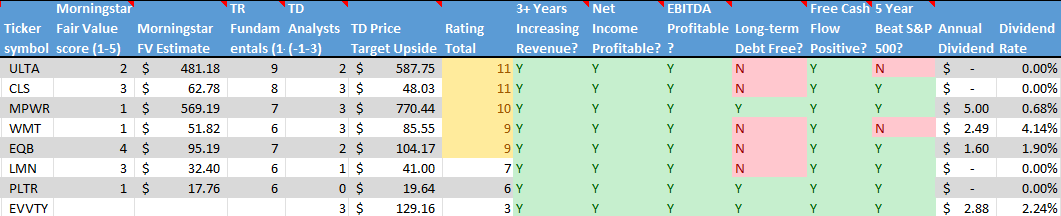
NOTE: Morningstar and Thomson-Reuters analysis is unavailable for Evolution from my usual sources because the company’s home stock exchange is the Nasdaq Stockholm in Sweden. While it is possible to invest in Evolution through the Over The Counter Market, there is no analysis similar to the data available for companies traded on the major North American stock exchanges (Toronto Stock Exchange, New York Stock Exchange, and Nasdaq Stock market).
Portfolio Update
Portfolio 1
Portfolio 1 for the week ended March 8, 2024: UP ![]()
- Apple (NASD: AAPL) was fined €1.84 billion (US$2 billion) by the European Union antitrust regulators for preventing music streaming rivals from informing users of third party payment options outside Apple’s App Store.
More bad news for Apple as sales of their iconic iPhones in China fell 24% on an annual basis as Apples’s share of the Chinese market fell to 15.7% from 19% a year ago. - Tesla reported lower shipments from their Shanghai gigafactory due to lower sales caused by the Lunar New Year holiday and competition from other electric vehicle (EV) manufacturers.
Tesla’s German gigafactory is expected to be without electrical power until the middle of March. A suspected arson attack nearby left the factory without power, causing a halt in production. - Rivian Automotive (NASD: RIVN) announced three new EVs: a smaller, less expensive electric SUV, the R2, and a R3 crossover along with a high-performance version, the R3X. The smaller EVs are expected to start shipping in 2026 and will be priced well below Rivian’s bigger initial offering – the R1 pickup and SUV. These less expensive EVs are crucial to the success of Rivian as consumer demand for EVs has slowed.
- The recent run up in Nvidia’s (NASD: NVDA) share price has placed the company at the heels of Apple for the second largest company by market capitalization (number of shares outstanding X share price). During Nvidia’s rally the company has jumped over Amazon.com (NASD: AMZN), Alphabet (NASD: GOOGL) and Saudi Aramco (the world’s largest oil producer).
- General Motors (NYSE: GM) announced they are resuming delivery of their Chevy Blazer EV after addressing software quality issues. GM also said it has reduced the price of the Blazer and that the EV is once again eligible for the US$ 7,500 rebate available in the US.
Activity
Sold: Teladoc Health, Inc. (NASD: TDOC) During the height of the COVID-19 pandemic, when seeing a family doctor in person was nearly impossible, I invested in Teladoc. This company was a leading provider of remote healthcare services, boasting growing revenues and significant market potential in the burgeoning field of telemedicine. At the time, the prospect of receiving medical assistance via phone or video seemed to have vast potential.
However, as the pandemic subsided, it became apparent that there was a strong preference for in-person doctor visits. This shift in consumer behavior marked a turning point for the telemedicine industry and, consequently, for Teladoc. The company’s previously explosive growth began to slow and broke my reason for investing in the company.
In hindsight, once my reason for investing was busted, I should have acted swiftly to sell my shares. Instead, driven by optimism for a potential rebound, I held on, only to see the share price continue its decline. This week, acknowledging the changed landscape of telemedicine, I made the decision to divest. ☹
Dividends
Dividends Received this week for the following companies:
Companies followed by DRIP (Dividend Re-Investment Plan) indicate additional shares were purchased with the dividend. Any cash leftover was added to the cash balance.
Canadian $
TMX Group Ltd (TSE: X)
US $
No US$ dividends this past week.
Quarterly Reports
Sea Limited
Fourth quarter 2023 financial results on March 4, 2024
Nuvei Corporation
Fourth quarter 2023 financial results on March 5, 2024
Andlauer Healthcare Group Inc.
Fourth quarter 2023 financial results on March 5, 2024
CrowdStrike Holdings, Inc.
Fourth quarter 2023 financial results on March 5, 2024
Crew Energy Inc.
Fourth quarter 2023 financial results on March 7, 2024
Costco Wholesale Corporation
Second quarter 2024 financial results on March 7, 2024
Portfolio 2
Portfolio 2 for the week ended March 8, 2024: DOWN ![]()
- TC Energy (TSE: TRP) announced they agreed to sell Portland Natural Gas Transmission System for US$ 1.14 billion. The money will be used to pay off debt and fund other investments. The company plans to sell a minimum of C$ 3 billion worth of assets in an effort to reduce debt.
in other TC Energy news, the company said it reopened its Keystone pipeline after they voluntarily shut it down to investigate a leak reported by a landowner. The leak proved to be unfounded, but the entire Keystone system was shutdown for five hours while they investigated.
Activity
No significant activity to report this week.
Dividends
Dividends Received this week for the following companies:
Companies followed by DRIP (Dividend Re-Investment Plan) indicate additional shares were purchased with the dividend. Any cash leftover was added to the cash balance.
No dividends this past week.
Quarterly Reports
MongoDB, Inc.
Fourth quarter 2024 financial results on March 7, 2024
Crew Energy
See report under Portfolio 1.
Portfolio 3
Portfolio 3 for the week ended March 8, 2024: DOWN ![]()
- The Royal Bank (TSE: RY) announced they plan to triple the amount of money available for renewable energy products to C$ 15 billion by 2030. The bank also plans to increase lending to low carbon energy companies.
- Cloudflare (NYSE: NET) announced the launch of their Magic Cloud Networking service. This new product provides a cloud-based platform that allows customers to connect and protect their cloud networking infrastructure.
Activity
No significant activity to report this week.
Dividends
Dividends Received this week for the following companies:
Companies followed by DRIP (Dividend Re-Investment Plan) indicate additional shares were purchased with the dividend. Any cash leftover was added to the cash balance.
No dividends this past week.
Quarterly Reports
No quarterly reports this past week.