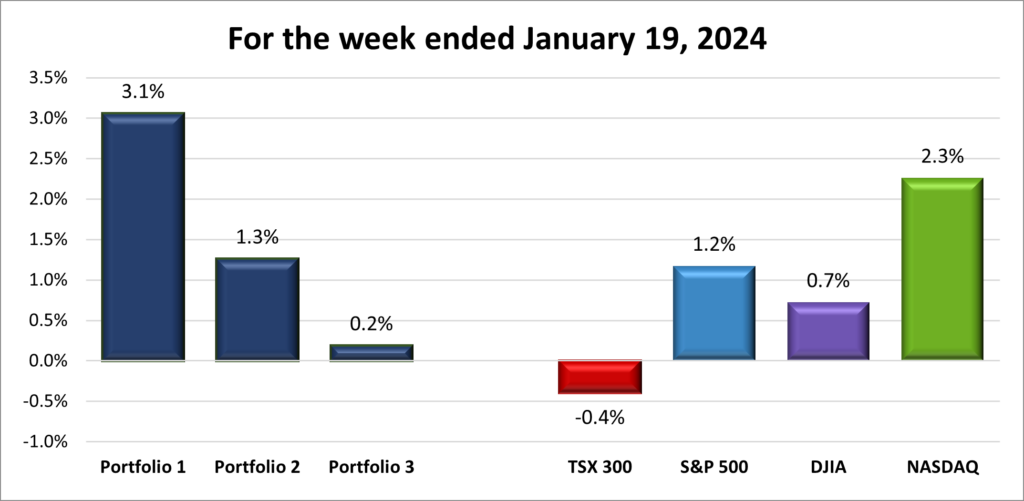
While the rally that started 2023, and the year end rally got plenty of news, the start of 2024 has quietly rallied. Year to date, the three American indexes have climbed into positive territory for 2024 after an uneven start to the year. So far, the technology driven Nasdaq has already surged 4.7%, the S&P is ahead 3.1%, the DJIA is up 1.0%, while the more resource oriented TSX has risen 1.2%.
The case for a ‘soft landing’ in the US grew stronger after recent data from the latest Personal Consumption Expenditures report showed inflation in the US continues to ease, while the US economy remains strong based on the early estimate of fourth quarter Gross Domestic Product.
In Canada, the Bank of Canada left the interest rate unchanged and signals they are no longer considering rate hikes.
The US economy continues to grow, inflation cools, Canada hits the brakes on rate hikes, and the markets continue to rise. Good news all around!
Items that may only interest or educate me ….
Canadian Economic news, US Economic news, Why should I invest in the stock market? …
Canadian Economic news
This past week’s key economic data that the Bank of Canada (BoC) considers when deciding whether to raise or lower the interest rate.
Bank of Canada
As expected, the BoC, which controls Canada’s interest rates, left its key, or benchmark, rate unchanged at 5.0% following its latest meeting. This means the cost of borrowing stays the same, impacting things like mortgages and business loans. This was the fourth straight time they left the rate unchanged. In their announcement, BoC Governor Tiff Macklem said the Governing Council wanted to see “further and sustained easing in core inflation” to ensure inflation was headed to their 2% target.
Although the bank did not specify a timeline for potential interest rate cuts, the removal of previous references to they were prepared to raise rates indicates a shift in focus. Governor Macklem noted that while it is currently too early to consider lowering rates, given the current inflation level and wage growth in the 4%–5% range, their attention has moved from contemplating rate hikes to assessing when to initiate rate cuts. This shift strongly suggests that interest rates have peaked, opening the door to potential rate cuts.
While deciding to keep the rate at 5.0%, the BoC acknowledged global economic growth was slowing and inflation was falling. The US is a notable exception where the economy remains strong, although it is expected to slow down later in the year. The bank also forecast weak economic growth in Canada, as measured by Gross Domestic Product (GDP), in the first quarter, with expectations of improvement later in 2024.
In summary, the BoC did as expected by leaving the rate unchanged. The good news for consumers and investors alike was rates have likely peaked, and the bank’s board of governors is now considering when to start lowering rates. Their next meeting is scheduled for March 6, 2024. At that time investors are hoping the BoC will either announce the first rate cut in four years or a timeline when we can expect the rate to start falling. The sooner the rates begin to fall, the better, as it could stimulate borrowing and boost economic growth. 😊
Canadian market volatility
Canada’s stock markets’ ‘fear gauge,’ represented by the TSX 60 VIXI, ended the week at 11.49, lower than last week’s reading of 12.26. On Friday, the VIXI rose as high as 12.70 in the morning before dropping nearly 10% to 11.49 at noon. I do not know what happened at noon to precipitate the sharp drop, but low reading suggests investors are feeling more confident and optimistic about the Canadian markets.
The VIXC’s ‘high’ and ‘low’ volatility thresholds are defined as readings above 20 and below 20, respectively. Therefore, the current level of 11.49 indicates a calm market environment.
US Economic news
This past week’s key data points that the Federal Reserve (Fed) considers when deciding whether to raise or lower the interest rate.
Gross Domestic Product
The Commerce Department’s advanced estimate of the fourth quarter Gross Domestic Product (GDP) recorded a 3.3% increase compared to the same period a year ago. Despite exceeding analysts’ expectations of a 2% increase, the 3.3% growth rate marked a deceleration from the revised 4.9% increase in the third quarter.
Both goods and services saw increased annual spending. In the Goods category, the ‘Other nondurable goods’ subsector experienced the most significant growth, up by 0.29%, while the ‘Motor vehicles and parts’ subsector was the only one to decline, dropping by 0.03%. For Services, the ‘Food services and accommodations’ subsector led the growth, rising 0.37%, whereas the ‘Financial services and insurance’ was the only subsector to shrink, falling 0.14%. Additionally, the overall growth in GDP was bolstered by businesses accelerating their inventory restocking, and a rise in exports, which was slightly tempered by a minor increase in imports.
This higher-than-anticipated GDP data indicates that the American consumer remained resilient in the face of inflation. This resilience, supported by continued spending on both goods and services, suggests the American consumer remained a driving force behind the economic expansion. This data also suggests that the Fed might successfully achieve a ‘soft landing,’ where inflation eases back to its 2% target without triggering a severe economic recession. However, the robust GDP figures might lead the Fed to reconsider or delay potential rate cuts in their upcoming meeting on March 19 and 20, as they assess the implications of this strong economic performance.
This was the advance estimate. Revisions to the data are possible, with the final estimate being released on March 28.
Personal Consumption Expenditures
The Commerce Department’s latest report on inflation, tracked via the Personal Consumption Expenditures (PCE) price index, showed a 0.2% rise in December, after a 0.1% decrease in November. This indicates a modest increase in spending over the holiday season despite inflationary pressures. Annually, the PCE price index grew by 2.6%, maintaining the same rate of growth as the previous month. Both numbers were inline with analysts’ expectations.
In December, ‘core’ PCE, which excludes the often volatile food and energy components, also increased by 0.2%, following a 0.1% rise in November. On a year-over-year basis, core PCE slowed to a 2.9% rate, down from 3.2% in November. This is the first time in almost three years that the core PCE has dropped below 3.0%.
These figures suggest a relative moderation in inflation compared to earlier months. While the annual PCE rate of 2.6% and the core PCE rate of 2.9% are still slightly above the Fed’s 2% target, the 0.2% monthly growth rates for both PCE and core PCE are similar to the trends observed prior to the pandemic.
The recent deceleration in the core PCE to below 3% for the first time in nearly three years is a significant indication that the Fed’s measures to lower inflation are having an effect. Coupled with the GDP report that suggests continued economic strength, there’s growing optimism that the Fed might achieve a ‘soft landing’—effectively reducing inflation to its target level without triggering a recession.
The PCE index is a comprehensive measure of US household spending encompassing various goods and services, reflecting both price changes and shifts in consumer patterns. The Fed and other analysts closely monitor it for insights into inflation trends and economic activity, with the core PCE metric being the Fed’s preferred gauge of underlying price pressures.
American market volatility
By the end of this past week, the ‘fear gauge,’ formally known as the CBOE Volatility Index (VIX), had slipped to 13.26, after registering 13.30 the previous week. The VIX reading was essentially flat after a week of good economic data and mixed corporate quarterly earnings, offset by ongoing tensions in the Middel East. The fear gauge remains in a historically low range and investors continue to be optimistic about the markets.
The VIX is a measure of the US investors’ expectation of short-term volatility based on S&P 500 options prices.
Why should I invest in the stock market?
Last week I discussed ‘What is investing?’ This week, I will talk about why you should consider investing in the stock market.
There are two primary reasons to invest in the stock market. The first is to grow your financial wealth to help you reach your financial goals and build up your nest egg for retirement or other goals. Currently, the average savings account provides interest at a rate of approximately 1%. In 2021, most GIC (Guaranteed Investment Certificate) paid 1 – 2%, depending on the length of term. Meanwhile the stock market (represented by the S&P 500 index, a collection of the 500 largest companies in the US) has averaged 12.32%, or had an annual return of 10.46%, for the last 100 years (January 1, 1920, to December 31, 2020. When adjusted for inflation, the stock market has an average return of 8.53% and an annualized return of 7.63% for the same period.
Now, the market rarely hits the average, instead the yearly returns can vary wildly. It’s great to be invested when the S&P 500 is up over 25% as in 2019 but not so great when the S&P 500 was down 37% during the 2008 banking crisis. The key is to leave your money invested over time as the markets have shown they will recover and continue to grow. Keep in mind, past performance does not guarantee future results.
The second reason is to protect your savings from inflation. Inflation is where money loses its purchasing power over time. Or, to put it another way, over time, prices for goods and services tend to rise.
With an inflation rate of 3.4% in Canada (3.4% in the US), in January 2024, the purchasing power of your hard earned cash is weakening. So, let me flip that around and ask why wouldn’t you invest in the market and get your money working for you?
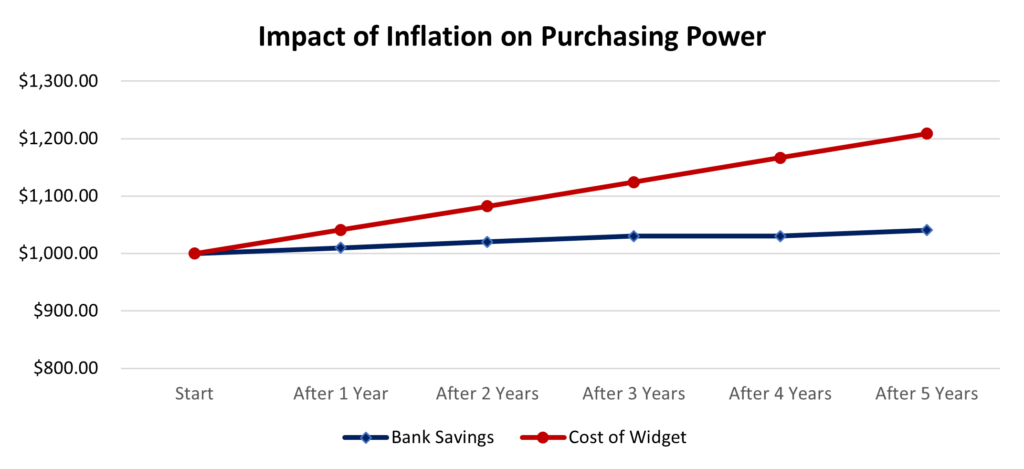
Take the following example: If I wanted to purchase a $1,000 widget and if I had the money, I could buy it today for $1,000. However, if I decide to put off the purchase for a year and leave the money in a savings account earning interest, a year from now, thanks to inflation, I would no longer be able to purchase the widget for $1,000. The widget would cost $1034.00 ($1000 x 1.034) and the money in the savings account would have grown to only $1010 ($1000 x 1.01). And it gets worse as the years add up.
The chart below illustrates the increasing gap between the cost of a widget and the amount put away in a regular bank account. Each year you will need more money to buy the same product.
Keep in mind that investing involves inherent risks, and it is important that you understand your own risk tolerance. If you plan to invest in stocks, only invest in companies where you would be proud to call yourself an owner. With any investment, you should be able to sleep at night.
While there may be other ways to protect your money from inflation, investing wisely in the market is the best way to not only keep up with inflation but also get your money working for you, even when you are sleeping. 😊
Now, let’s see how all that good economic news influenced the markets this past week….
Weekly Market Review
Monday: riding last week’s momentum and fourth quarter earning that have been better than expected, all four indexes – the Toronto Stock Exchange Composite Index (TSX), the S&P 500 Index (S&P), the Dow Jones Industrial Average (DJIA), and the Nasdaq Composite Index (Nasdaq) – ended higher. The artificial intelligence (AI) technology continues to drive the markets, and therefore the indexes, as investors continue to pour money into AI related companies. Oil prices rose on supply concerns caused by the Middle East and Ukraine conflicts, and increased demand caused by the wintry weather across North America.
In Canada, gains on the TSX were muted as investors ahead of the BoC’s latest interest rate announcement. In trading, Consumer Cyclicals and Financials posted the biggest gains while the Telecommunications Services and Basic Materials (miners and fertilizer manufacturers) dropped the most.
In the US, driven by the mega cap technology companies, the S&P and DJIA both hit all time highs, with the DJIA rising above the 38,000 mark for the first time ever. In a positive sign, the breadth of the rally has increased the last few days of trading. In trading, Industrials and Financials had the biggest increases of the American sectors, while Consumer Staples, Utilities and Consumer Cyclicals were the only sectors to end lower.
Tuesday: quarterly earnings was the story today. Mixed quarterly earnings reports led to a mixed day for the indexes. The DJIA was the only index to end lower after 3M (NYSE: MMM) forecast lower profits in 2024. Otherwise, the majority of companies that reported today had positive earnings.
In Canada, the TSX ended higher after news came out that the Chinese government was considering measures to boost its ailing economy. If China’s economy starts to rebound there will be more demand for raw materials, leading to rising share prices of mining companies. In trading, Basic Materials and Consumer Staples led the gainers, while Healthcare and Utilities were the only Canadian sectors to end in the red.
In the US of A, upbeat earnings helped the S&P set a new closing high for the third day in a row. In trading, Telecommunications Services and Consumer Staples rose the most while Financials, Healthcare and Consumer Cyclicals were the only sectors to end in the red.
Wednesday: earnings continued to drive the markets. Another day of mixed earnings reports led to the TSX and DJIA ended the day slightly below the bar, while the S&P and the Nasdaq finished just above the bar. The price of oil edged higher on news of a higher-than-expected drawdown of oil stored in the US.
In Canada, the BoC left the Canadian benchmark interest rate at 5.0% and indicated it was too early to tell when they would start lowering the rate. The TSX briefly touched its highest level in twenty months before falling into negative territory to break a string of four straight gains. In trading, Energy and Financials were the only sectors to end in the green, while the Telecommunications Services and Basic Materials sectors declined the most.
In the US, the S&P climbed to a fourth straight record close on the continued strength of the big technology companies. In trading in the American sectors, Energy, Technology and Financials were the only sectors to end in the green. Telecommunications Services and Utilities fell the deepest into the red.
Thursday: a better-than-expected initial reading of the US economy in the fourth quarter spurred all four indexes into the green. Oil prices rose when economic data showed the US economy performed better than expected.
In Canada, higher oil prices helped the TSX reach its highest level in 20 months. In trading on Bay Street, Utilities and Energy were the two best performers. Telecommunications Services and Technology were the only Canadian sectors to end lower.
In the US, the DJIA and the S&P set new closing highs. What makes this more impressive is that it came despite a bad stumble by one of the Magnificent 7. Tesla (NASD: TSLA) fell more than 12% in market value after a poor fourth quarter report and then forecasting slower growth in the future. In trading on Wall Street, Energy and Utilities advanced the most while Consumer Cyclicals and Healthcare were the only American sectors to decline.
Friday: it was a mixed day in the markets with S&P and Nasdaq ending lower and the TSX and DJIA closing higher. The indexes bounced up and down throughout the day as investors considered the latest PCE data that showed headline and core PCE dropped below 3%. Oil prices rose on solid US economic data and signs of increased demand from China.
In Canada, a rally in Canadian technology companies, coupled with higher oil prices lifted the TSX to its highest point since May 2022. In trading, the Technology and Healthcare sectors were the farthest in the green, while Consumer Staples, Basic Materials and Utilities were the only sectors to slide lower.
In America, the S&P’s run of consecutive closing highs came to an end. The Nasdaq and S&P were weighed down by technology companies after Intel’s (NASD: INTC) forecast for the rest of the year fell well short of investors’ expectations. In the markets, Energy and Telecommunications Services recorded the biggest gains, while Technology was the lone sector to end lower.
Weekly Market and Portfolio Review
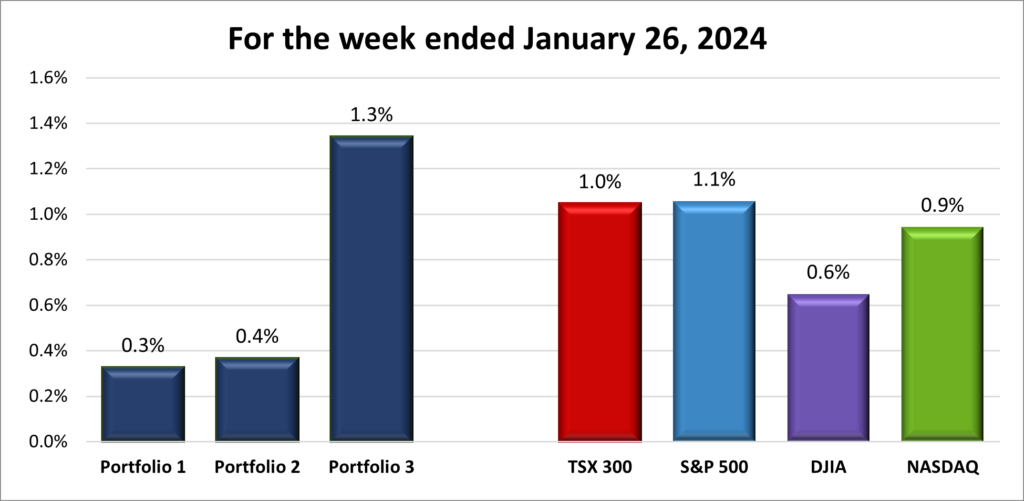
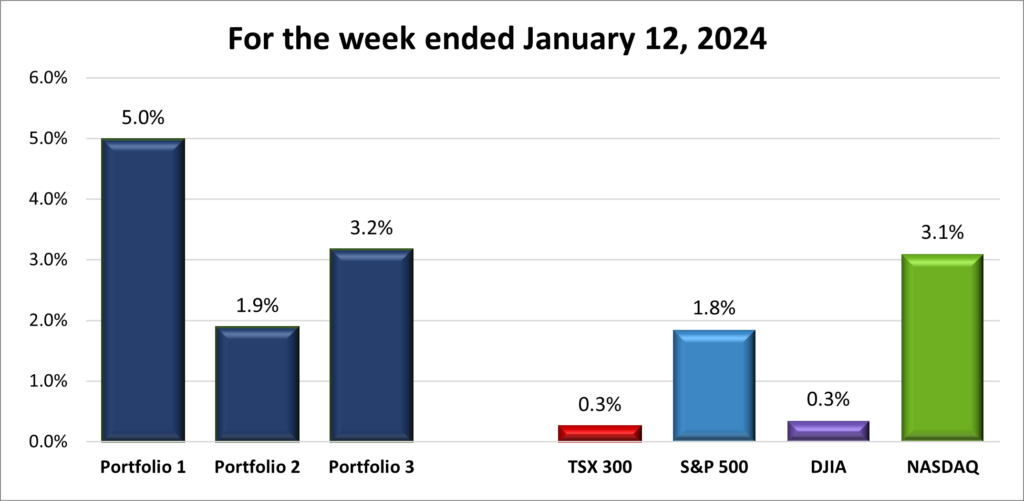
For the week, the TSX (SPTSX) gained 1.0%, the S&P 500 (SPX) advanced 1.1%, the DJIA (INDU) rose 0.6% and the Nasdaq (CCMP) grew by 0.9%.
| Index | Weekly Streak |
| TSX: | 2-week winning streak |
| S&P: | 3-week winning streak |
| DJIA: | 3-week winning streak |
| Nasdaq: | 3-week winning streak |
![]() This week has been full of good news for us investors. With the Fed in a quiet period this past week ahead of their upcoming meeting and rate announcement, economic news and quarterly earnings drove the markets. Data released this past week, including the latest US PCE report showing easing inflation and a strong initial estimate of fourth quarter GDP, has bolstered the case for a ‘soft landing’ in the US. This positive outlook has fueled a steady stock market rally since January 1st of this year, with the Nasdaq surging 4.7%, the S&P gaining 3.1%, and the DJIA up 1.0%. Even the resource-heavy TSX has joined the climb, rising 1.2% year-to-date thanks to an almost 7% gain in oil prices this past week.
This week has been full of good news for us investors. With the Fed in a quiet period this past week ahead of their upcoming meeting and rate announcement, economic news and quarterly earnings drove the markets. Data released this past week, including the latest US PCE report showing easing inflation and a strong initial estimate of fourth quarter GDP, has bolstered the case for a ‘soft landing’ in the US. This positive outlook has fueled a steady stock market rally since January 1st of this year, with the Nasdaq surging 4.7%, the S&P gaining 3.1%, and the DJIA up 1.0%. Even the resource-heavy TSX has joined the climb, rising 1.2% year-to-date thanks to an almost 7% gain in oil prices this past week.
The markets, and therefore the indexes, have been driven by investor optimism about the robust American economy and the potential for lower interest rates. The main beneficiaries continue to be technology stocks, especially mega technology companies like Nvidia (NASD: NVDA) and Microsoft (NASD: MSFT), up 26.7% and 8.9%, respectively, since the start of the year. These two companies are viewed as leaders in the emerging AI market boom and investors have been drawn to them, pushing their respective share prices to record highs. Both these companies are in great shape whether interest rates go up or down thanks to their low debt and reliable cash flow.
The one downside to the rally is that once again it is narrowly focused on technology companies, whereas at the end of 2023 the rally had broadened to other sectors. Analysts were hoping the current rally would be significantly broader.
Next week will be pivotal for the market rally as five of the Magnificent 7 – Microsoft, Alphabet (NASD: GOOGL), Apple (NASD: AAPL), Meta Platforms (NASD: META) and Amazon.com (NASD: AMZN)– report earnings. These companies are followed by many investors because of the influence they have on the markets and on portfolios. Strong reports and forecasts from all five will turbocharge the current rally. On the other hand, if the results are mixed or poor, it could stop the rally cold. I look forward to stellar reports from these companies.
With apologies to the musical group the Kings, the rally goes on and on, and on and on… 😊
| Portfolio | Weekly Streak |
| Portfolio 1: | 3-week winning streak |
| Portfolio 2: | 3-week winning streak |
| Portfolio 3: | 3-week winning streak |
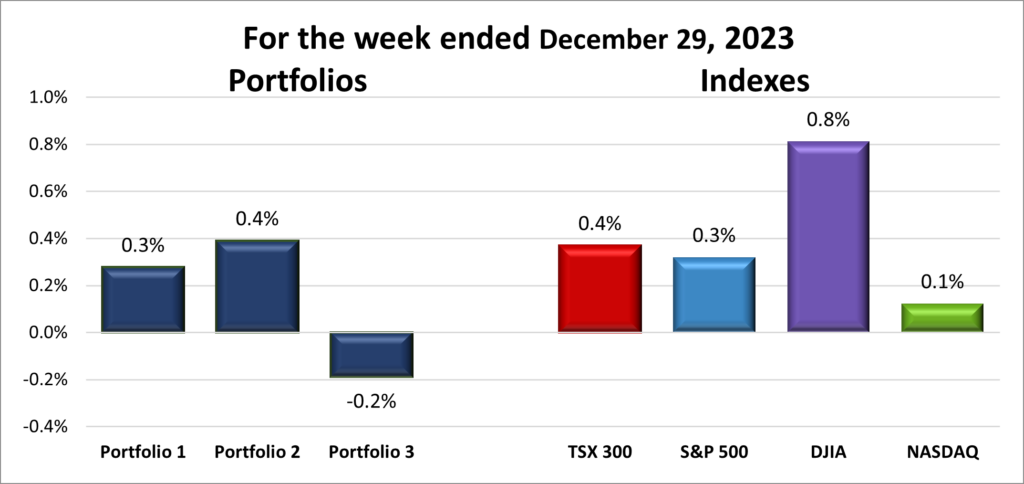
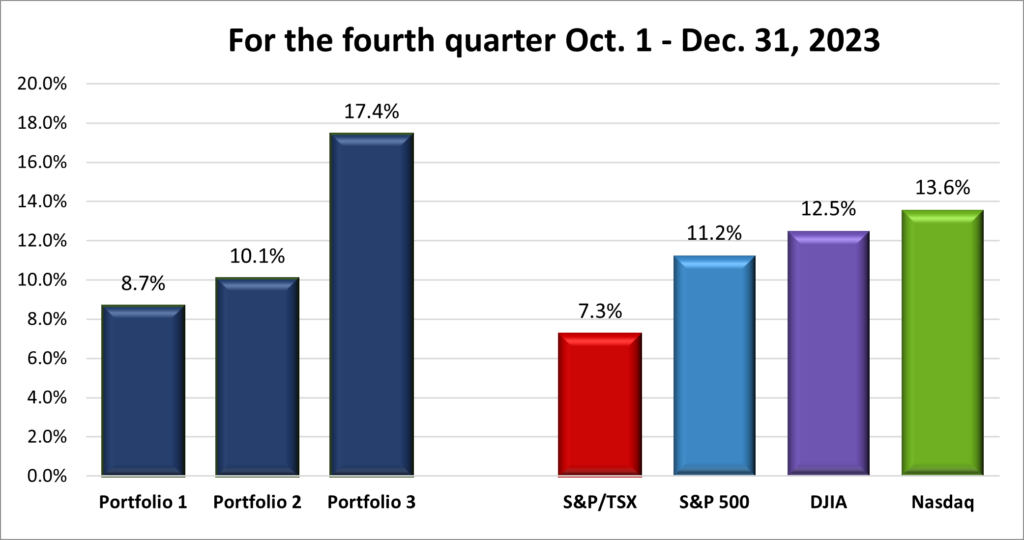
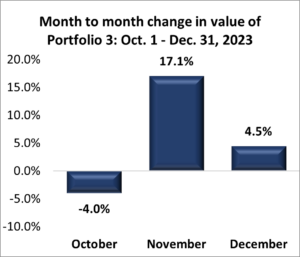
![]() Each of the portfolios ran their respective weekly winning streaks to three, buoyed by the rising tide of the North American markets. Portfolio 3 emerged as the week’s top performer, outperforming all the indexes, as illustrated in the table below. The portfolio’s rise was helped by a 12% gain by kneat.com (TSE: KSI). This significant mover – a move up or down over 10% – helped boost the otherwise modest gains and minimal losses across the portfolio. The cumulative effect of these small gains proved to have a noticeable impact.
Each of the portfolios ran their respective weekly winning streaks to three, buoyed by the rising tide of the North American markets. Portfolio 3 emerged as the week’s top performer, outperforming all the indexes, as illustrated in the table below. The portfolio’s rise was helped by a 12% gain by kneat.com (TSE: KSI). This significant mover – a move up or down over 10% – helped boost the otherwise modest gains and minimal losses across the portfolio. The cumulative effect of these small gains proved to have a noticeable impact.
Portfolio 2’s performance, while not as great, benefitted from its stake in kneat.com, up 12%. Without this boost, the portfolio would have likely finished the week nearly flat, as most of its holdings ended the week around the breakeven point. However, small incremental gains across various holdings contributed to a net increase in its value.
Portfolio 1 posted the smallest gain for the week. It was lifted by kneat.com’s performance and a 10.5% increase in SEA Limited (NYSE: SE). However, these gains, and the rest of the portfolio’s gains, were partially offset by significant losses in Tesla, plunging 16%, and Lattice Semiconductor Corp (NASD: LSCC), which fell by 11%.
Despite two of the portfolios underperforming relative to the broader markets, all portfolios saw an increase in value over the past week. For me, the key takeaway is that even small gains can accumulate significantly over time, making a positive contribution to overall wealth growth. 😊
Companies on the Radar
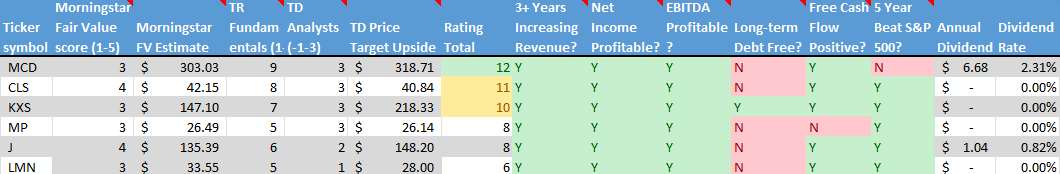
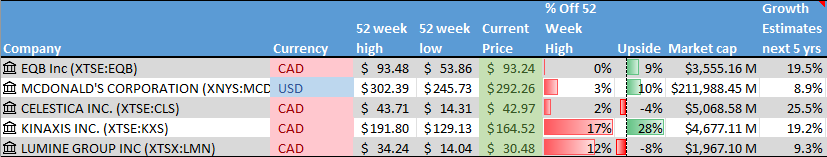
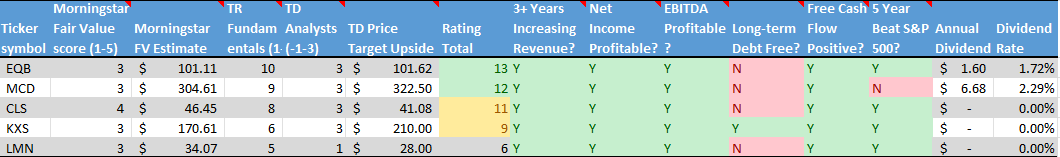
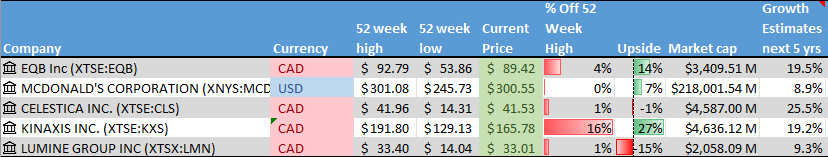
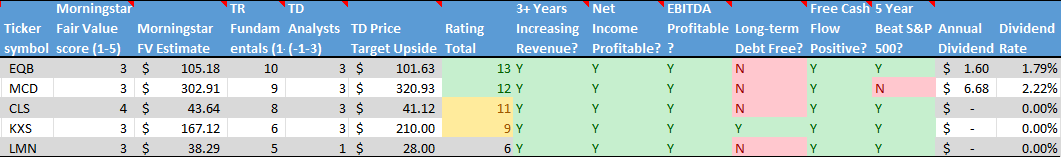
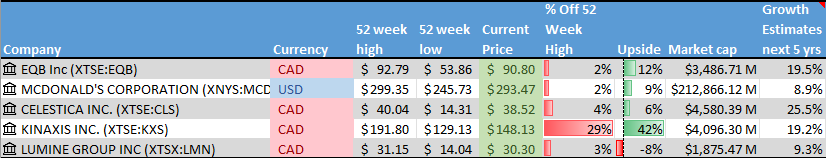
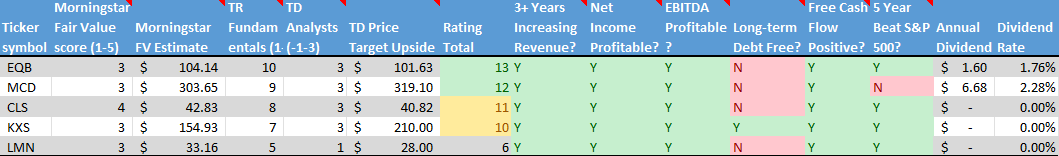
 Another week with no new companies on my radar. Once again, my Radar List consists of the five companies listed below:
- Equitable Bank (TSE: EQB), a mid sized Canadian bank that provides financial services to consumers and businesses.
- McDonald’s (NYSE: MCD), the large sized American fast-food chain.
- Celestica Inc. (TSE: CLS), a medium sized Canadian company that manufactures electronic products and provides supply chain services to companies around the world.
- Kinaxis (TSE: KXS), a Canadian mid sized company that provides cloud based supply chain solutions to customers around the world.
- Lumine Group (TSE: LMN), a young Canadian mid sized company spun off from Constellation Software (TSE: CSU). It acquires communications and media software companies and then strengthens and grows the companies.
The Radar Check was last updated January 26, 2024.
Portfolio Update
Portfolio 1
Portfolio 1 for the week ended January 26, 2024: UP ![]()
- Alphabet’s fully autonomous electric vehicle (EV) division Waymo, has applied to the California Public Utilities Commission to expand its service in Los Angeles. The company already operates on a limited basis in San Francisco and Phoenix.
Elsewhere under the Alphabet umbrella, their technology incubator division X Lab let go dozens of employees, mostly support staff. X Lab also changed its structure to make it easier to spin out promising ventures.
The lawsuit that Alphabet’s Google was engaged in over patent infringement on AI chips has been settled. So far, no details have been released. - Amazon was fined US$ 35 million dollars by French regulator CNIL for ‘excessively intrusive’ monitoring of staff. Amazon tracked the inactivity time of employees’ scanners as well as the speed at which employees scanned items.
Amazon announced they were investing US$ 10 billion into two new data centres in Mississippi. The new buildings will provide additional storage and compute power to meet the growing demand for cloud and AI services. The company also made a US$ 15 billion investment in their Japanese facilities. - During Tesla’s earnings report, the company warned of slower growth for 2024 than the 38+% increase they have enjoyed the last few years. As well, Tesla’s profit margin took a hit thanks to the price cuts Tesla implemented throughout 2023. With slowing growth and shrinking profit margins, perhaps its time to reconsider my investment in the company.
Tesla also announced during the earnings announcement that they planned to build an EV for the masses, starting in 2025.
Tesla has recalled almost 200,000 of its Model S, X, and Y EVs due to a software issue that could cause an obstruction of a driver’s view when reversing. - General Motors (NYSE: GM) Cruise division is being probed by the US Justice Department and the Securities and Exchange Commission. The two government agencies are looking into an accident in October when one of Cruise’s robotaxis accidently dragged a pedestrian who had been struck by another vehicle.
Activity
Received interest on TD 1-year cashable GIC.
Dividends
Dividends Received this week for the following companies:
Companies followed by DRIP (Dividend Re-Investment Plan) indicate additional shares were purchased with the dividend. Any cash leftover was added to the cash balance.
Canadian $
BCE Inc (TSE: BCE) DRIP
US $
No US$ dividends this past week.
Quarterly Reports
Canadian National Railway Company
All currency listed in millions of Canadian dollars, except for per share data.
Selected highlights from their fourth quarter 2023 financial results on January 23, 2024
- Revenue of $4,471 for the three months ended December 31, compared to $4,542 for the same period in 2022. A decrease of almost 2%.
- Net income of $2,130 for the three months ended December 31, compared to net income of $1,420 in the same period in 2022.
- Diluted earnings per ordinary share of $3.29 for the three months ended December 31, compared to earnings of $2.10 per share for the same period in 2022.
- Revenue of $16,828 for year ended December 31, compared to $17,107 for the same period in 2022. A decrease of almost 2%.
- Net earnings of $5,625 for the year ended December 31, compared to net earnings of $5,118 in the same period in 2022.
- Diluted earnings per ordinary share of $8.53 for the year ended December 31, compared to earnings of $7.44 per share for the same period in 2022.
Tesla, Inc.
All currency listed in millions of US dollars, except for per share data.
Selected highlights from their fourth quarter 2023 financial results on January 23, 2024
- Revenue of $25,167 for the three months ended December 31, compared to $24,318 for the same period in 2022. An increase of over 3%.
- Net income of $7,928 for the three months ended December 31, compared to net income of $3,687 in the same period in 2022.
- Diluted earnings per ordinary share of $2.27 for the three months ended December 31, compared to earnings of $1.07 per share for the same period in 2022.
Visa Inc.
All currency listed in millions of US dollars, except for per share data.
Selected highlights from their first quarter 2024 financial results on January 25, 2024
- Revenue of $8,634 for the three months ended December 31, compared to $7,936 for the same period in 2022. An increase of almost 9%.
- Net income of $4,890 for the three months ended December 31, compared to net income of $4,179 in the same period in 2022.
- Diluted earnings per ordinary share of $2.39 for the three months ended December 31, compared to earnings of $1.99 per share for the same period in 2022.
Portfolio 2
Portfolio 2 for the week ended January 26, 2024: UP ![]()
- Alimentation Couche-Tard Inc. (TSE: ATD) announced a private offering of unsecured notes in order to raise money to pay off outstanding debt. The debt was used as part of the recent purchase of specific European retail assets from TotalEnergies (NYSE :TTE). The offering plans to raise C$ 500 million at an interest rate of 4.603%, maturing January 25, 2029.
Activity
No significant activity to report this week.
Dividends
Dividends Received this week for the following companies:
Companies followed by DRIP (Dividend Re-Investment Plan) indicate additional shares were purchased with the dividend. Any cash leftover was added to the cash balance.
No dividends this past week.
Quarterly Reports
No quarterly reports this past week, except for per share data.
Portfolio 3
Portfolio 3 for the week ended January 26, 2024: UP ![]()
- Microsoft reported that it was hacked by a Russian state sponsored group called ‘Midnight Blizzard’ on January 12, 2024. The hackers were able to access ‘a very small percentage’ of email accounts, including those of a few senior level staff.
Microsoft became the second company to join the US$ 3 trillion in market capitalization club when its share price reached a record high. It joins Apple as the only companies with a market value over US$ 3 trillion. Market capitalization is the total number of outstanding shares multiplied by the share price.
Microsoft is the latest technology company to announce layoffs. Following the close of its acquisition of Activision Blizzard, Microsoft had announced it will layoff 1,900 employees across Activision Blizzard and Microsoft’s Xbox division, with most of the layoffs occurring at Activision. - TD Bank (TSE: TD) is looking at a sizable financial penalty for its flawed anti-money laundering controls. Canada’s Financial Transactions and Reports Analysis Centre of Canada (FinTRAC) agency reviewed TD’s procedures and found them inadequate.
Activity
No significant activity to report this week.
Dividends
Dividends Received this week for the following companies:
Companies followed by DRIP (Dividend Re-Investment Plan) indicate additional shares were purchased with the dividend. Any cash leftover was added to the cash balance.
Canadian $
goeasy Ltd (TSE: GSY)
US $
No US$ dividends this past week.
Quarterly Reports
No quarterly reports this past week.

 Welcome to 2024! I hope everyone had a good Christmas break to recharge and get ready for 2024.