Items that may only interest or educate me ….
This week: Canada’s Fall Economic Statement, latest US interest rate hike, UK interest rate hike, OPEC, world’s strongest dollar. Let’s begin.
This week, Canada’s Fall Economic Statement showed Canadian finances have improved thanks to a windfall of revenue from the oil and gas energy and taxes from higher prices of most goods and services raking in more money. However, analysts fear that the increased revenue and shrinking deficit will not be here for long as the threat of a recession in Canada grows larger. Analysts suggest Canada could enter a recession in early 2023, when growth slows thanks rising interest rates that pinch consumer and business spending alike.
One thing that stood out for me was the government’s plan to place a 2% tax on corporate share buyback programs, starting January 1, 2024. A share buyback is when a company repurchases its own shares on the open market and then puts them back in their treasury or they destroy them. The buyback reduces the total number of outstanding shares, thus driving up the earnings per share. Share buyback programs are one way to increase shareholder value when companies generate excess cash (another way is to pay dividends to shareholders).
Besides generating more revenue for the government with this new tax, the government argues that this tax will encourage companies to invest in their employees and their businesses. However, the tax will not be rolled out until 2024, providing a window of opportunity for companies to buyback their shares before the tax goes into effect. Once the tax is in effect, I would not be surprised to see companies channel excess profits towards special dividends and increasing their regular dividends. I can see the argument that this would be better for more than just the shareholders, but this sounds more like a calculated political move aimed at higher corporate profits given the huge profits by the Canadian banks in 2021 and now the Canadian oil and gas companies.
Statistics Canada latest Labour Force Survey showed a surge in hiring and wage growth of 5.6%, surpassing September’s 5.2% increase. That makes it five consecutive months that wages have risen by more than 5%. That will not make the Bank of Canada (BoC) happy, not happy at all as they seek to bring down inflation to their 2% target. Analysts are now expecting 0.5% rate increase to Canada’s benchmark interest rate at the BoC’s next session in early December.
The US Federal Reserve Bank (Fed) continued its battle with the worst inflation levels seen in America in 40 years by raising the benchmark US interest rate by 0.75% for the fourth consecutive time. This brings the US interest rate to 3.75%, its highest in 15 years. In an announcing the hike, the Fed hinted at the possibility of lower increases in the future as it hopes to thread the needle between stubbornly high inflation and the strains on the US economy caused by higher interest rates. The markets reacted with a brief rally before the other shoe dropped – the Fed said it was not done raising interest rates and the interest rate could go higher than the 4.75% estimated at their last session in September. This news caused a sharp drop on both the American and Canadian markets on the day of the announcement.
While the Fed feels there are more hikes in the works, they want to assess how the “cumulative effect” of their previous hikes have affected the US economy before determining the size and pace of future hikes. One of the key pieces of data the Fed will use to determine the size of future rate hikes is the US non-farm employment numbers. Good news for workers is not necessarily good news when it comes to the Fed’s battle with inflation since a strong labour market tends to lead to companies paying more for labour, which is passed on to consumers in the form of higher prices. Higher prices and higher wages can become an upward spiral that drives inflation. Since forcing inflation down from its current 8% to 2% is the Fed’s number one objective, the Fed may extend its rate hikes longer and higher than expected. Which means more pain for US consumers.
There is a saying, when the US sneezes, Canada catches a cold. Alas, I think the Feds battle with inflation will give Canadians a cold. ☹
In the United Kingdom, the Bank of England (BoE) raised their benchmark interest rate by 0.75%, the largest increase since 1989, to 3.0%. Just as important was the forward guidance they provided. The BoE suggested Britain faced a recession and the British economy may remain stagnant or decline over the next two years. However, in contrast to the Fed and BoC, the BoE suggested the British benchmark interest rate was likely to go up less than originally expected.
The Organization of the Petroleum Exporting Countries (OPEC), whose thirteen countries depend on oil income, raised its forecasts for world oil demand in the medium and longer term in its annual World Oil Outlook that was released October 31. The report indicated $12.1 trillion of investment is needed to meet this demand despite the energy transition to renewables.
As a result of an expected strong recovery in 2023 and a focus on energy security, the report said world oil demand will reach 103 million barrels per day (bpd) in 2023, up 2.7 million bpd from 2022, leading to a slower substitution of oil by other fuels such as natural gas.
By 2030, OPEC sees world demand averaging 108.3 million bpd, up from 2021, and lifted its 2045 figure to 109.8 million bpd from 108.2 million bpd in 2021. Oil is expected to “retain the highest share in the global energy mix during” through to 2045, with its share in the energy mix dropping from 31% to just under 29%. The combined market share of oil and gas in the global primary energy mix is expected to remain above 50% through to 2045.
The US dollar continues to grow stronger against other currencies, including the Canadian dollar as investors (both the pros and us retail investors) often turn to the US dollar as a safe haven during periods of uncertain global economic conditions, a flight to safety if you will. Interest rate hikes only make the US dollar more attractive to domestic and foreign investors.
Foreign investors typically use the American dollar when moving money into US stocks and bonds, which in turn also boosts the strength of the US dollar. The Wall Street Journal Dollar Index, which weighs the US dollar against sixteen other currencies, is up nearly 16% so far this year.
A stronger US dollar not only makes everything more expensive for those of us outside the USA, but it also lowers revenues of American based businesses. American products are more expensive outside the US because of the foreign exchange, possibly leading to lower sales. And those foreign revenues lose value when they are converted back to US dollars, making sales and profits appear lower than they are.
As an owner of many technology companies that do business globally, I have seen many quarterly earnings pointing to the strong dollar as one of the causes of lower revenues. As a consumer, I notice higher prices every time I consider a product or service from the US.
Enough about higher interest rates and what a stronger US dollar are doing to our buying power, lets take a look at what moved the markets, and they impact it had on the Portfolios…
Weekly Market Review
Monday: No treats on Hallowe’en in the North American stock markets as all four major indexes – the Toronto Stock Exchange Composite Index (TSX), the S&P 500 Index (S&P), the Dow Jones Industrial Average (DJIA), and the Nasdaq Composite Index (Nasdaq) – lost ground today. In Canada and the USA, investors were apprehensive ahead of an anticipated 0.75% gain by the US Federal Reserve Bank (Fed) later this week. Just as important will be comments coming out of the Fed’s meeting regarding the December interest rate hike where a 0.25% – 0.5% hike is projected. Hawkish comments would not be well received, while dovish comments would be well received.
In Canada, only two sectors, Healthcare (jump in Canopy Growth’s share price thanks to their plan to enter the US market) and Energy (higher oil prices), were able to inch higher.
In the US, the three US indexes ended October with a whimper despite having a strong month. In the market, Only the Energy sector was able to gain ground while the heavyweight technology companies continue to drag the Technology sector down which was once again the worst performing sector.
Tuesday: The day started out on the right foot, but the American indexes turned south on news of an unexpected rebound in job openings which led to speculation the Fed will maintain its aggressive round of interest rate increases. As a result, only the TSX was able to move higher while the US indexes finished slightly lower.
In Canada, the TSX was buoyed by rumours China will ease its strict covid-19 measures which have slowed down China’s manufacturing capabilities and limited Chinese consumer demands. In the marketplace, once again Basic Materials (natural resource miners and fertilizer manufacturers) and Energy companies led the TSX, while the Utilities, Industrials and Healthcare sectors were the only sectors to end lower.
In the US, a report showing strong demand for workers threw cold water on hopes the Fed would lower their planned December interest rate hike. Tomorrow, all eyes will be on the Fed, both for the November interest rate hike and any signs the December rate hike will be lower. In the markets, Basic Materials and Energy were the biggest gainers while Technology and Consumer Cyclical sectors dropped the most.
Wednesday: A tough day in the North American marketplace as all four indexes fell sharply. The market moving news was the Fed announced the expected 0.75% interest hike and hinted smaller hikes could start as early as their next meeting in December. This caused a brief 45-minute rally on all four indexes before the rally turned into a sharp decline when the Fed also stated the benchmark interest rate could go higher than expected.
No sector was spared in Canada or the US, as all lost ground. In Canada, Basic Materials and Technology were the worst performing sectors, while in the US, it was the same two sectors only they flipped positions with the Technology the worst performing S&P sector.
Thursday: All four indexes continued to slide as investors continued to fret over future interest rate increases after the Fed said hikes were far from over. In Canada, the Energy, Industrials and Healthcare sectors were the only Canadian sectors to end on the plus side. In the US, the Energy, Basic Materials and Utilities were the only S&P sectors to advance.
Friday: All four major North American Indexes had a good day to end the week, but not good enough to salvage what was a volatile week. Analysts and investors continued to weigh the impact of a mixed US employment report on the size and pace of future interest rate hikes. The report showed slowing job growth, but hourly rates rose more than expected. However, investors did take some solace in reports China may relax its Covid-19 restrictions. China has a voracious appetite for natural resources so with the Covid-19 restrictions removed, there should be pent up demand for commodities to fuel its manufacturing industry. Thanks to these rumours, the Basic Materials sectors in Canada and the US both had strong days, advancing over 5% in both countries. Many of the world’s commodity companies are part of the Basic Materials sector.
In Canada, Statistics Canada jobs data showed Canada adding ten times more than the expected number of jobs (108,000 added, 10,000 expected), and the average hourly wage rose 5.5% since last October. Good for workers, not good for lower interest rates. On the TSX, the Basic Materials sector led the TSX in a broad rally that brought it within striking distance of breaking even for the week. The interest sensitive Technology sector was the only Canadian sector to end the day in the red.
In the US, the three American indexes ended their respective four day losing streaks thanks to s strong rally that saw all eleven S&P sectors end the day in the black. The S&P Basic Materials sector was the big winner on the day, advancing more than twice as much as the second-best performing Financials sector.
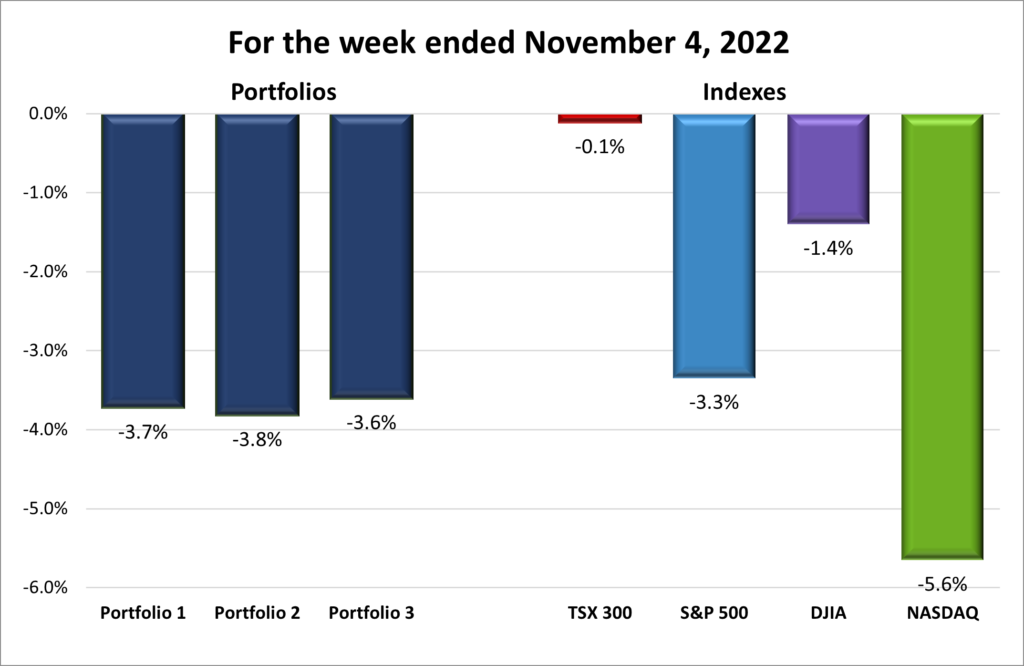
For the week, the TSX slipped 0.1%, the S&P 500 dropped 3.3%, the Dow fell 1.4% and the Nasdaq plunged 5.6%, its biggest weekly decrease since January.
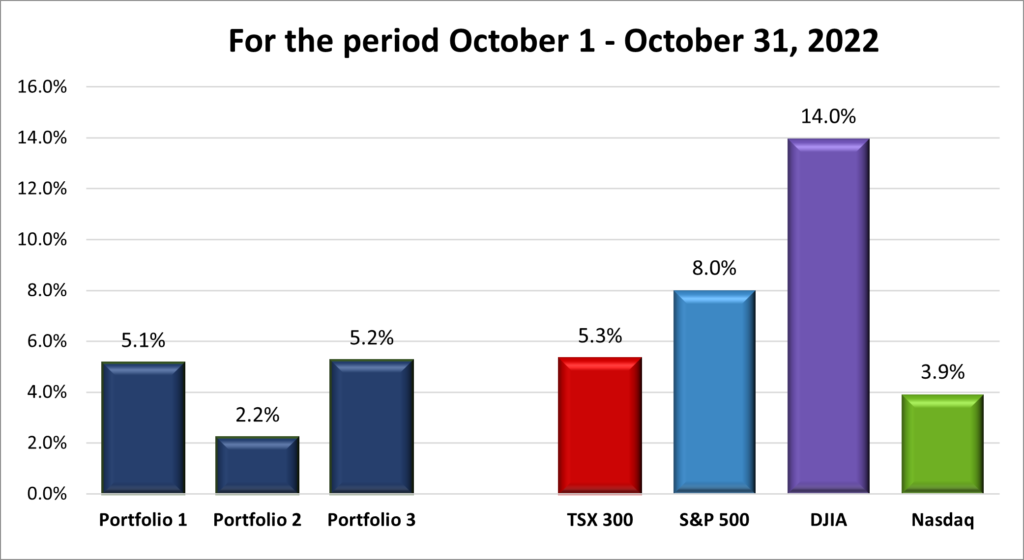
October was a good month for investors, the TSX had its best month since November 2020, rising 5.3 %; the S&P 500 jumped 8.0 %; the Dow had its best October in over 100 years, soaring 14.0 %; and the Nasdaq climbed 3.9 %.
Weekly Portfolio Review
After a strong October in the marketplace (see the chart above), November fell flat on its face with this past week’s performance. The Nasdaq, home of many interest sensitive, growth-oriented companies, got beaten down by the Fed’s hints that interest rates could exceed estimates. To a lesser extent the S&P suffered the same fate as the Nasdaq, as many of the heavyweight companies are in both indexes, but the S&P also contains more traditional companies that held up better than the technology companies that dominate the Nasdaq. The TSX is kept afloat by higher commodity prices that benefit Basic Materials sector companies as well as oil and gas companies, while the DJIA limited the damage thanks to being composed of strictly large blue-chip companies.
Before looking at the weekly performance chart below, I expected Portfolio 2 to be the best performer, or rather, have the smallest decline, followed by Portfolio 1 and Portfolio 3 bringing up the rear. However, it was essentially a dead heat with all three portfolios dropping 3.6% to 3.8%. This week, Portfolio 3 was the best of a bad lot.
October was a great month for us investors. July was the last time all four indexes advanced as much as they did in October. Normally an 8% advance by the S&P would be the big news but it was unseated by the DJIA which had its largest one month gain since January 1976. Yes, since before 1900 thanks to its concentration of companies in the Energy and Industrials sectors. The TSX had its best month in two years thanks to higher oil prices. Bringing up the rear, the Nasdaq was held back by the higher interest rates which slowed the growth rate of the many growth-oriented companies in the index.
This is one of the few times I wish the Portfolios were DJIA centric. However, they are not, and I do not plan for them to become more DJIA oriented. I plan to stick with my growth-oriented approach which aligns more with Nasdaq and the S&P. Nonetheless, 5+% gains by Portfolios 1 and 3 are quite acceptable. 😊 I would have preferred Portfolio 2 post a 5% gain during a hot month but that is the trade off for not dropping as much during poor months, which there have been plenty in 2022.
Companies on the Radar
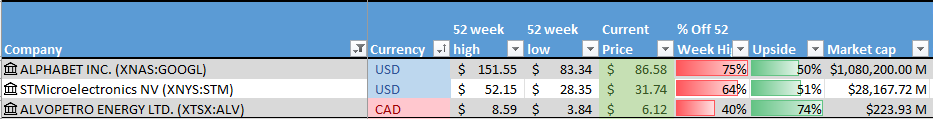
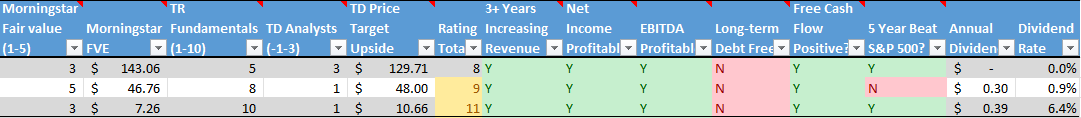
I am still considering becoming an owner STMicroelectronics N.V. (NYSE:STM), or increasing my ownership of Alphabet (NASD:GOOGL) or Alvopetro Energy (TSXV:ALV):
- STMicroelectronics N.V.: European manufacturer of semiconductors (chips) for the automotive industry.
- Alphabet: clear leader in online search and online advertising (Google and YouTube); leader in mobile phone operating systems (Android); one of the top cloud computing platforms (Google Cloud); producer of computer hardware and software (Chrome); plus, expanding into other areas, such as health.
- Alvopetro Energy is a Canadian natural gas company developing natural gas projects in Brazil.
Below are my Radar Check on these two companies, updated November 4, 2022.
Portfolio Update
Portfolio 1
Portfolio 1 for the week ended November 4, 2022: DOWN ![]()
- The TMX Group (TSX:TMX), the parent company of the TSX, suffered a glitch which led to a halt of all equities trading on Tuesday morning. All TSX platforms lost connectivity around 10:10 ET but were back online with full functionality by 11:20 ET.
- Rogers (TSX:RCI.B) and Shaw (TSX:SJR.B) have been asked by a federal judge to address concerns from Canada’s Competition panel in order to resolve their dispute. Hopefully the two sides can work out a deal that is amenable to both sides although I do not see how reducing the competition by a major player, such as Shaw, will improve competition.
- PayPal (NASD:PYPL) did not have an impressive third quarter earnings report, revenues increased only 11% during the third quarter and 9% for the nine months. Growth companies are supposed to grow revenues more than that. The share price also took a hit when the company warned of a slower holiday season as people cut back on their discretionary spending.
Activity
No significant activity to report this week.
Dividends
Dividends Received this week for the following companies:
Companies followed by DRIP (Dividend Re-Investment Plan) indicate additional shares were purchased with the dividend. Any cash leftover was added to the cash balance.
Canadian $
Toronto-Dominion Bank (TSX:TD) DRIP
US $
No US$ dividends this past week.
Quarterly Reports
CargoJet Inc.
All currency listed in millions of Canadian dollars
Selected highlights from their third quarter 2022 financial results on October 31, 2022
- Revenue of $232.7 for the three months ended September 30, compared to $189.5 for the same period in 2021. An increase of almost 23%.
- Net earnings of $83.4 for the three months ended September 30, compared to net loss of $12.9 in the same period in 2021.
- Diluted earnings per ordinary share of $4.77 for the three months ended September 30, compared to a loss of $0.74 for the same period in 2021.
- Revenue of $712.9 for the nine months ended September 30, compared to $521.9 for the same period in 2021. An increase of over 36%.
- Net loss of $187.8 for the nine months ended September 30, compared to net earnings of $65.4 in the same period in 2021.
- Diluted earnings per ordinary share of $10.64 for the nine months ended September 30, compared to earnings of $3.73 for the same period in 2021.
Lattice Semiconductor Corporation
All currency listed in thousands of US dollars
Selected highlights from their third quarter 2022 financial results on October 31, 2022
- Revenue of $172,509 for the three months ended October 1, compared to $131,911 for the three months ended October 2, 2021. An increase of over 30%.
- Net earnings of $46,359 for the three months ended October 1, compared to net income of $26,739 for the three months ended October 2, 2021.
- Diluted earnings per ordinary share of $0.33 for the three months ended October 1, compared to earnings of $0.19 for the three months ended October 2, 2021.
- Revenue of $434,396 for the nine months ended October 1, compared to $373,532 for the nine months ended October 2, 2021. An increase of almost 30%.
- Net earnings of $126,969 for the nine months ended October 1, compared to net earnings of $67,390 for the nine months ended October 2, 2021.
- Diluted earnings per ordinary share of $0.90 for the nine months ended October 1, compared to earnings of $0.47 for the nine months ended October 2, 2021.
VieMed Healthcare, Inc.
All currency listed in thousands of US dollars
Selected highlights from their third quarter 2022 financial results on November 1, 2022
- Revenue of $35,759 for the three months ended September 30, compared to $29,285 for the same period in 2021. An increase of over 22%.
- Net earnings of $1,055 for the three months ended September 30, compared to net income of $1,789 in the same period in 2021.
- Diluted earnings per ordinary share of $0.03 for the three months ended September 30, compared to earnings of $0.04 for the same period in 2021.
- Revenue of $101,324 for the nine months ended September 30, compared to $85,100 for the same period in 2021. An increase of over 19%.
- Net earnings of $3,784 for the nine months ended September 30, compared to net earnings of $5,039 in the same period in 2021.
- Diluted loss per ordinary share of $0.09 for the nine months ended September 30, compared to earnings of $0.12 for the same period in 2021.
Innovative Industrial Properties, Inc.
All currency listed in thousands of US dollars
Selected highlights from their third quarter 2022 financial results on November 2, 2022
- Revenue of $70,883 for the three months ended September 30, compared to $53,856 for the same period in 2021. An increase of almost 32%.
- Net income of $32,278 for the three months ended September 30, compared to net income of $29,756 in the same period in 2021.
- Diluted earnings per ordinary share of $1.32 for the three months ended September 30, compared to earnings of $1.20 for the same period in 2021.
- Revenue of $205,898 for the nine months ended September 30, compared to $145,608 for the same period in 2021. An increase of over 41%.
- Net income of $111,866 for the nine months ended September 30, compared to net earnings of $84,346 in the same period in 2021.
- Diluted loss per ordinary share of $4.06 for the nine months ended September 30, compared to earnings of $3.41 for the same period in 2021.
Roku, Inc.
All currency listed in thousands of US dollars
Selected highlights from their third quarter 2022 financial results on November 2, 2022
- Revenue of $761,373 for the three months ended September 30, compared to $679,953 for the same period in 2021. An increase of almost 12%.
- Net loss of $122,183 for the three months ended September 30, compared to net income of $68,935 in the same period in 2021.
- Diluted loss per ordinary share of $0.88 for the three months ended September 30, compared to earnings of $0.48 for the same period in 2021.
- Revenue of $2,259,478 for the nine months ended September 30, compared to $1,899,255 for the same period in 2021. An increase of almost 19%.
- Net loss of $260,810 for the nine months ended September 30, compared to net earnings of $218,698 in the same period in 2021.
- Diluted loss per ordinary share of $1.90 for the nine months ended September 30, compared to earnings of $1.54 for the same period in 2021.
Datadog, Inc.
All currency listed in thousands of US dollars
Selected highlights from their third quarter 2022 financial results on November 3, 2022
- Revenue of $436,533 for the three months ended September 30, compared to $270,488 for the same period in 2021. An increase of over 61%.
- Net loss of $25,985 for the three months ended September 30, compared to net loss of $5,484 in the same period in 2021.
- Diluted loss per ordinary share of $0.08 for the three months ended September 30, compared to a loss of $0.02 for the same period in 2021.
- Revenue of $1,205,701 for the nine months ended September 30, compared to $702,586 for the same period in 2021. An increase of almost 72%.
- Net loss of $21,126 for the nine months ended September 30, compared to net loss of $27,914 in the same period in 2021.
- Diluted loss per ordinary share of $0.07 for the nine months ended September 30, compared to a loss of $0.09 for the same period in 2021.
Lightspeed Commerce Inc.
All currency listed in thousands of US dollars
Selected highlights from their second quarter 2022 financial results on November 3, 2022
- Revenue of $186,699 for the three months ended September 30, compared to $133,218 for the same period in 2021. An increase of almost 38%.
- Net loss of $79,943 for the three months ended September 30, compared to net loss of $59,087 in the same period in 2021.
- Diluted loss per ordinary share of $0.53 for the three months ended September 30, compared to a loss of $0.43 for the same period in 2021.
- Revenue of $357,581 for the six months ended September 30, compared to $249,138 for the same period in 2021. An increase of over 43%.
- Net loss of $180,739 for the six months ended September 30, compared to net loss of $108,424 in the same period in 2021.
- Diluted loss per ordinary share of $1.21 for the six months ended September 30, compared to a loss of $.80 for the same period in 2021.
PayPal Holdings, Inc.
All currency listed in millions of US dollars
Selected highlights from their third quarter 2022 financial results on November 3, 2022
- Revenue of $6,846 for the three months ended September 30, compared to $6,182 for the same period in 2021. An increase of almost 11%.
- Net income of $1,330 for the three months ended September 30, compared to net income of $1,087 in the same period in 2021.
- Diluted earnings per ordinary share of $1.15 for the three months ended September 30, compared to earnings of $0.92 for the same period in 2021.
- Revenue of $20,135 for the nine months ended September 30, compared to $18,453 for the same period in 2021. An increase of over 9%.
- Net earnings of $1,498 for the nine months ended September 30, compared to net earnings of $3,368 in the same period in 2021.
- Diluted earnings per ordinary share of $1.29 for the nine months ended September 30, compared to earnings of $2.84 for the same period in 2021.
Progeny, Inc.
All currency listed in thousands of US dollars
Selected highlights from their third quarter 2022 financial results on November 3, 2022
- Revenue of $205,371 for the three months ended September 30, compared to $122,284 for the same period in 2021. An increase of almost 67%.
- Net income of $13,211 for the three months ended September 30, compared to net income of $16,796 in the same period in 2021.
- Diluted earnings per ordinary share of $0.13 for the three months ended September 30, compared to earnings of $0.17 for the same period in 2021.
- Revenue of $572,592 for the nine months ended September 30, compared to $373,068 for the same period in 2021. An increase of over 53%.
- Net income of $26,950 for the nine months ended September 30, compared to net earnings of $50,689 in the same period in 2021.
- Diluted earnings per ordinary share of $0.27 for the nine months ended September 30, compared to earnings of $0.51 for the same period in 2021.
Crew Energy Inc.
All currency listed in thousands of Canadian dollars
Selected highlights from their third quarter 2022 financial results on November 3, 2022
- Revenue of $115,158 for the three months ended September 30, compared to $35,055 for the same period in 2021. An increase of over 328%.
- Net income of $105,658 for the three months ended September 30, compared to net income of $176,183 in the same period in 2021.
- Diluted earnings per ordinary share of $0.65 for the three months ended September 30, compared to earnings of $1.12 for the same period in 2021.
- Revenue of $348,908 for the nine months ended September 30, compared to $108,881 for the same period in 2021. An increase of over 320%.
- Net income of $192,976 for the nine months ended September 30, compared to net earnings of $154,398 in the same period in 2021.
- Diluted loss per ordinary share of $1.19 for the nine months ended September 30, compared to earnings of $.99 for the same period in 2021.
Cloudflare, Inc.
All currency listed in thousands of US dollars
Selected highlights from their third quarter 2022 financial results on November 3, 2022
- Revenue of $253,857 for the three months ended September 30, compared to $172,347 for the same period in 2021. An increase of over 47%.
- Net loss of $42,546 for the three months ended September 30, compared to net loss of $107,355 in the same period in 2021.
- Diluted loss per ordinary share of $0.13 for the three months ended September 30, compared to loss of $0.34 for the same period in 2021.
- Revenue of $700,541 for the nine months ended September 30, compared to $462,830 for the same period in 2021. An increase of over 51%.
- Net loss of $147,464 for the nine months ended September 30, compared to net loss of $182,808 in the same period in 2021.
- Diluted loss per ordinary share of $0.45 for the nine months ended September 30, compared to a loss of $0.59 for the same period in 2021.
BCE Inc.
All currency listed in millions of Canadian dollars
Selected highlights from their third quarter 2022 financial results on November 3, 2022
- Revenue of $6,024 for the three months ended September 30, compared to $5,836 for the same period in 2021. An increase of over 3%.
- Net income of $771 for the three months ended September 30, compared to net income of $813 in the same period in 2021.
- Diluted loss per ordinary share of $0.78 for the three months ended September 30, compared to earnings of $0.83 for the same period in 2021.
- Revenue of $17,735 for the nine months ended September 30, compared to $17,240 for the same period in 2021. An increase of over 20%.
- Net income of $2,359 for the nine months ended September 30, compared to net earnings of $2,234 in the same period in 2021.
- Diluted loss per ordinary share of $2.40 for the nine months ended September 30, compared to earnings of $2.30 for the same period in 2021.
Skyworks Solutions, Inc.
All currency listed in millions of US dollars
Selected highlights from their fourth quarter 2022 financial results on November 3, 2022
- Revenue of $1,407.0 for the three months ended September 30, compared to $1,310.9 for the same period in 2021. An increase of over 7%.
- Net income of $302.2 for the three months ended September 30, compared to net income of $326.3 in the same period in 2021.
- Diluted earnings per ordinary share of $1.88 for the three months ended September 30, compared to earnings of $1.95 for the same period in 2021.
- Revenue of $5,485.5 for the twelve months ended September 30, compared to $5,109.1 for the same period in 2021. An increase of over 7%.
- Net income of $1,275.2 for the twelve months ended September 30, compared to net earnings of $1,498.3 in the same period in 2021.
- Diluted earnings per ordinary share of 7.81 for the nine months ended September 30, compared to earnings of $8.97 for the same period in 2021.
Trisura Group Ltd.
All currency listed in thousands of Canadian dollars
Selected highlights from their third quarter 2022 financial results on November 3, 2022
- Revenue of $644,820 for the three months ended September 30, compared to $404,678 for the same period in 2021. An increase of over 59%.
- Net income of $23,746 for the three months ended September 30, compared to net income of $16,057 in the same period in 2021.
- Diluted earnings per ordinary share of $0.61 for the three months ended September 30, compared to earnings of $0.39 for the same period in 2021.
- Revenue of $1,768,415 for the nine months ended September 30, compared to $1,078,466 for the same period in 2021. An increase of almost 64%.
- Net income of $64,991 for the nine months ended September 30, compared to net income of $52,264 in the same period in 2021.
- Diluted earnings per ordinary share of $1.50 for the nine months ended September 30, compared to earnings of $1.24 for the same period in 2021.
Nuvei Corporation
All currency listed in thousands of US dollars
Selected highlights from their third quarter 2022 financial results on November 3, 2022
- Revenue of $197,146 for the three months ended September 30, compared to $183,932 for the same period in 2021. An increase of over 7%.
- Net income of $13,006 for the three months ended September 30, compared to net income of $28,002 in the same period in 2021.
- Diluted earnings per ordinary share of $0.08 for the three months ended September 30, compared to earnings of $0.19 for the same period in 2021.
- Revenue of $622,984 for the nine months ended September 30, compared to $512,651 for the same period in 2021. An increase of over 21%.
- Net income of $52,603 for the nine months ended September 30, compared to net income of $94,706 in the same period in 2021.
- Diluted earnings per ordinary share of $0.34 for the nine months ended September 30, compared to earnings of $0.64 for the same period in 2021.
Telus Corporation
All currency listed in millions of Canadian dollars
Selected highlights from their third quarter 2022 financial results on November 4, 2022
- Revenue of $4,671 for the three months ended September 30, compared to $4,251 for the same period in 2021. An increase of almost 10%.
- Net income of $551 for the three months ended September 30, compared to net income of $358 in the same period in 2021.
- Diluted earnings per ordinary share of $0.37 for the three months ended September 30, compared to earnings of $0.25 for the same period in 2021.
- Revenue of $13,354 for the nine months ended September 30, compared to $12,386 for the same period in 2021. An increase of almost 8%.
- Net earnings of $1,453 for the nine months ended September 30, compared to net earnings of $1,035 in the same period in 2021.
- Diluted earnings per ordinary share of $0.99 for the nine months ended September 30, compared to earnings of $0.75 for the same period in 2021.
FuboTV Inc.
All currency listed in thousands of US dollars
Selected highlights from their third quarter 2022 financial results on November 4, 2022
- Revenue of $224,813 for the three months ended September 30, compared to $156,690 for the same period in 2021. An increase of over 43%.
- Net loss of $152,648 for the three months ended September 30, compared to net loss of $105,851 in the same period in 2021.
- Diluted loss per ordinary share of $0.82 for the three months ended September 30, compared to a loss of $0.74 for the same period in 2021.
Portfolio 2
Portfolio 2 for the week ended November 4, 2022: DOWN ![]()
- Disney (NYSE:DIS) has had many of its iconic brands added to a list of brands that can be imported into Russia from third party countries, such as China, without the permission of the company. Russia created this list when many Western companies, including Disney, suspended operations in Russia, or completely exited the country in response to Russia’s invasion of Ukraine.
- Canadian Natural Resources (TSX:CNQ) announced a 13% increase to its dividend thanks to higher prices for its crude oil. The quarterly dividend is now C$ 0.85.
Activity
No significant activity to report this week.
Dividends
Dividends Received this week for the following companies:
Companies followed by DRIP (Dividend Re-Investment Plan) indicate additional shares were purchased with the dividend. Any cash leftover was added to the cash balance.
Canadian $
TC Energy Corp (TSX:TRP)
US $
No US$ dividends this past week.
Quarterly Reports
Canadian Natural Resources Limited
All currency listed in millions of Canadian dollars
Selected highlights from their third quarter 2022 financial results on November 2, 2022
- Revenue of $10,457 for the three months ended September 30, compared to $7,711 for the same period in 2021. An increase of almost 36%.
- Net income of $2,814 for the three months ended September 30, compared to net income of $2,202 in the same period in 2021.
- Diluted earnings per ordinary share of $2.49 for the three months ended September 30, compared to earnings of $1.86 for the same period in 2021.
- Revenue of 32,609 for the nine months ended September 30, compared to $20,844 the same period in 2021. An increase of over 56%.
- Net income of $9,417 for the nine months ended September 30, compared to net income of $5,130 in the same period in 2021.
- Diluted earnings per ordinary share of $8.12 for the nine months ended September 30, compared to earnings of $4.32 for the same period in 2021.
Brookfield Infrastructure Partners L.P.
All currency listed in millions of US dollars
Selected highlights from their third quarter 2022 financial results on November 2, 2022
- Revenue of $3,627 for the three months ended September 30, compared to $2,939 for the same period in 2021. An increase of over 23%.
- Net income of $361 for the three months ended September 30, compared to net income of $536 in the same period in 2021.
- Diluted earnings per ordinary share of $0.05 for the three months ended September 30, compared to earnings of $0.48 for the same period in 2021.
- Revenue of $10,719 for the nine months ended September 30, compared to $8,285 for the same period in 2021. An increase of over 29%.
- Net income of $1,080 for the nine months ended September 30, compared to net earnings of $2,255 in the same period in 2021.
- Diluted earnings per ordinary share of $0.17 for the nine months ended September 30, compared to earnings of $1.07 for the same period in 2021.
Guardant Health, Inc.
All currency listed in US dollars
Selected highlights from their third quarter 2022 financial results on November 3, 2022
- Revenue of $117,404 for the three months ended September 30, compared to $94,779 for the same period in 2021. An increase of almost 24%.
- Net loss of $161,994 for the three months ended September 30, compared to net loss of $107,526 in the same period in 2021.
- Diluted loss per ordinary share of $1.58 for the three months ended September 30, compared to earnings of $1.06 for the same period in 2021.
- Revenue of $322,647 for the nine months ended September 30, compared to $265,545 for the same period in 2021. An increase of over 21%.
- Net loss of $514,654 for the nine months ended September 30, compared to net loss of $312,459 in the same period in 2021.
- Diluted loss per ordinary share of $5.04 for the nine months ended September 30, compared to s loss of $3.11 for the same period in 2021.
Brookfield Renewable Partners L.P.
All currency listed in millions of US dollars
Selected highlights from their third quarter 2022 financial results on November 4, 2022
- Revenue of $1,105 for the three months ended September 30, compared to $966 for the same period in 2021. An increase of over 14%.
- Net loss of $77 for the three months ended September 30, compared to net loss of $154 in the same period in 2021.
- Diluted loss per ordinary share of $0.25 for the three months ended September 30, compared to a loss of $0.21 for the same period in 2021.
- Revenue of $3,515 for the nine months ended September 30, compared to $3,005 for the same period in 2021. An increase of almost 17%.
- Net income of $78 for the nine months ended September 30, compared to a net loss of $99 in the same period in 2021.
- Diluted loss per ordinary share of $0.44 for the nine months ended September 30, compared to a loss of $0.58 for the same period in 2021.
Telus Corporation
All currency listed in millions of Canadian dollars
Selected highlights from their third quarter 2022 financial results on November 4, 2022
- Revenue of $4,671 for the three months ended September 30, compared to $4,251 for the same period in 2021. An increase of almost 10%.
- Net income of $551 for the three months ended September 30, compared to net income of $358 in the same period in 2021.
- Diluted earnings per ordinary share of $0.37 for the three months ended September 30, compared to earnings of $0.25 for the same period in 2021.
- Revenue of $13,354 for the nine months ended September 30, compared to $12,386 for the same period in 2021. An increase of almost 8%.
- Net earnings of $1,453 for the nine months ended September 30, compared to net earnings of $1,035 in the same period in 2021.
- Diluted earnings per ordinary share of $0.99 for the nine months ended September 30, compared to earnings of $0.75 for the same period in 2021.
Portfolio 3
Portfolio 3 for the week ended November 4, 2022: DOWN ![]()
- Microsoft (NASD:MSFT) did not offer any solutions to European Union antitrust regulators’ concerns about their acquisition of Activision Blizzard (NASD:ATVI). The regulators are expected to begin a full-scale probe of Microsoft’s purchase of the leading gaming company.
- Telus International (TSX:TIXT) has added to its collection of digital solutions with the acquisition of WillowTree Inc., a full-service digital product company focused on mobile applications and unified web interfaces.
Activity
No significant activity to report this week.
Dividends
Dividends Received this week for the following companies:
Companies followed by DRIP (Dividend Re-Investment Plan) indicate additional shares were purchased with the dividend. Any cash leftover was added to the cash balance.
Canadian $
Toronto-Dominion Bank (TSX:TD)
US $
No US$ dividends this past week.
Quarterly Reports
VieMed Healthcare, Inc.
All currency listed in thousands of US dollars
Selected highlights from their third quarter 2022 financial results on November 1, 2022
- Revenue of $35,759 for the three months ended September 30, compared to $29,285 for the same period in 2021. An increase of over 22%.
- Net earnings of $1,055 for the three months ended September 30, compared to net income of $1,789 in the same period in 2021.
- Diluted earnings per ordinary share of $0.03 for the three months ended September 30, compared to earnings of $0.04 for the same period in 2021.
- Revenue of $101,324 for the nine months ended September 30, compared to $85,100 for the same period in 2021. An increase of over 19%.
- Net earnings of $3,784 for the nine months ended September 30, compared to net earnings of $5,039 in the same period in 2021.
- Diluted loss per ordinary share of $0.09 for the nine months ended September 30, compared to earnings of $0.12 for the same period in 2021.
Cloudflare, Inc.
All currency listed in thousands of US dollars
Selected highlights from their third quarter 2022 financial results on November 3, 2022
- Revenue of $253,857 for the three months ended September 30, compared to $172,347 for the same period in 2021. An increase of over 47%.
- Net loss of $42,546 for the three months ended September 30, compared to net loss of $107,355 in the same period in 2021.
- Diluted loss per ordinary share of $0.13 for the three months ended September 30, compared to loss of $0.34 for the same period in 2021.
- Revenue of $700,541 for the nine months ended September 30, compared to $462,830 for the same period in 2021. An increase of over 51%.
- Net loss of $147,464 for the nine months ended September 30, compared to net loss of $182,808 in the same period in 2021.
- Diluted loss per ordinary share of $0.45 for the nine months ended September 30, compared to a loss of $0.59 for the same period in 2021.
Telus International
All currency listed in millions of US dollars
Selected highlights from their third quarter 2022 financial results on November 4, 2022
- Revenue of $615 for the three months ended September 30, compared to $556 for the same period in 2021. An increase of over 10%.
- Net income of $59 for the three months ended September 30, compared to net income of $23 in the same period in 2021.
- Diluted loss per ordinary share of $0.22 for the three months ended September 30, compared to earnings of $0.09 for the same period in 2021.
- Revenue of $1,838 for the nine months ended September 30, compared to $1,594 for the same period in 2021. An increase of over 15%.
- Net earnings of $149 for the nine months ended September 30, compared to net earnings of $42 in the same period in 2021.
- Diluted loss per ordinary share of $0.55 for the nine months ended September 30, compared to earnings of $0.16 for the same period in 2021.
Brookfield Renewable Partners L.P.
All currency listed in millions of US dollars
Selected highlights from their third quarter 2022 financial results on November 4, 2022
- Revenue of $1,105 for the three months ended September 30, compared to $966 for the same period in 2021. An increase of over 14%.
- Net loss of $77 for the three months ended September 30, compared to net loss of $154 in the same period in 2021.
- Diluted loss per ordinary share of $0.25 for the three months ended September 30, compared to a loss of $0.21 for the same period in 2021.
- Revenue of $3,515 for the nine months ended September 30, compared to $3,005 for the same period in 2021. An increase of almost 17%.
- Net income of $78 for the nine months ended September 30, compared to a net loss of $99 in the same period in 2021.
- Diluted loss per ordinary share of $0.44 for the nine months ended September 30, compared to a loss of $0.58 for the same period in 2021.