Items that may only interest me ….
More interest rate hike news, a reversal of fortunes for the Energy and Technology sectors, the city of tomorrow, and lucky investing
In Canada the Bank of Canada (BoC) hiked its benchmark interest for the sixth time this year, this time by 0. 5%, bringing the Canadian benchmark rate to 3.75%. Analysts and investors were expecting an increase of 0.75%. While that is good news, do not forget that the rate was 0.25% back in March before the BoC started this series of rate hikes. These rate hikes have been one of its fastest series of increases in the BoC’s history, with another potential 0.25% coming in December. On a positive note, the BoC said it was nearing the end of its historic rate increases.
The BoC rate is the amount that regular banks (that consumers like you and I use) are charged for short-term loans. This filters down into our economy by affecting the lending rates. Of course, these banks, and other lenders, add a few percentage points to this rate to arrive at the amount consumers pay for any type of borrowing. In other words, mortgages, loans, and lines of credit have gotten even more expensive.
The good news is the Canadian Consumer Price Index (CPI) has fallen over the last three months from 8.1% to the current 6.9%. The higher interest rates are working. The BoC stated in their announcement that an improving global supply chain and lower commodity prices should bring inflation down to 3% by the end of 2023, eventually dropping to the BoC’s target of 2% by the end of 2024. Those lower rates cannot get here soon enough!
In the US, the US Federal Reserve Bank (FED) is likely to raise American interest rates by 0.75% for the fourth straight time at their next session on November 2. Analysts are suggesting the central banks should not slow down or pause their respective hikes until inflation falls to roughly half of where it currently is. However, the Fed has hinted on lowering the amount of the December interest rate hike.
With both the BoC lowering the amount of the latest interest rate hike and the Fed hinting at a lower rate hike in December, perhaps the worst is behind us. The trick for both central banks is to bring down inflation without blowing up their respective economies and markets. An exceptionally fine balancing act.
The European Central Bank (ECB), the central bank for the 19 countries that use the Euro, raised its interest rate by 0.75% to 1.5% in its attempt to fight off 9.9% inflation amongst European Union members. While here in North America we would be happy with an interest rate of 1.5%, the ECB interest rate had been below 0% for eight years until the ECB started raising the rate in July. In their announcement, the ECB hinted that more interest hikes were likely. Analysts are estimating the ECB interest rate will top out in the neighbourhood of 2.6%.
Back in 2020, oil prices were at rock bottom, and no one wanted anything to do with oil company stocks (me included). The S&P Energy sector fell 37.3%. The high flyers were found in the S&P Technology sector, which rose 42.2%. Now, thanks to inflation and rising interest rates, as well as the Russian invasion of Ukraine, the tables have turned. The Energy sector is the only sector to advance in 2022, thanks to higher oil prices. In fact, the S&P Energy sector is up more than 62% so far this year. While the Technology sector is down 25%, year to date.
Saudi Arabia has been using petrol dollars generated from the higher oil prices to position itself as a global supply chain hub, and a centre of ‘green’ manufacturing. They have targeted vast sums of money at the manufacturing of ‘green’ metals (metals made with lower levels of carbon dioxide), green hydrogen production devices (hydrogen generated from renewable energy sources), and advanced recycling industries. Oh yeah, and the city of tomorrow pet project– Noem. The Saudi leadership intends for the city to be 100% powered by renewable energy; a global gateway for trade; a hub of innovation where business and industry are part of communities; essential infrastructure (utilities and transportation) will be built below the surface; and a pedestrian first approach to planning so all amenities are within a 5-minute walk. On paper, er, on the website, it sounds very impressive. I wonder how the plan will react when it runs into reality.
This is a great example of using money generated from a country’s oil and gas industry to fund the development of green industries, healthcare solutions and other benefits for its citizens.
According to a report from JPMorgan Chase, individual investors’ portfolios have tumbled 44% from the beginning of January. As of September 30, my three portfolios are down 37.6%, 26.7% and 46%. Does that make me a better than average investor, or just lucky? I like to think it is the former but suspect there is a great deal of the latter involved. 😊
And now, lets take a look at the past week in the markets and the portfolios…
Weekly Market Review
Monday: All four major North American indexes – Toronto Stock Exchange Composite Index (TSX), the S&P 500 Index, the Dow Jones Industrial Average (DJIA), and the Nasdaq Composite Index (Nasdaq) – continued Friday’s rally as investors prepare for some of the world’s biggest companies to report their earnings this week. Investors are focused on upcoming earnings to see if the blue-chip companies are still able to deliver profits despite their margins being squeezed by inflation. Despite a second day of solid advances, analysts still see this as a bear rally rather than the start of a new bull market run.
In Canada, the TSX was essentially flat as investors in Canadian listed companies prepare for another anticipated 0.75% interest rate hike by the Bank of Canada (BoC). In the market, all but two Canadian sectors ended in the black. Basic Materials and Healthcare were the only Canadian sectors to end in the red.
In the US, economic data released today indicated the US Federal Reserve’s (Fed) interest rate hikes are starting to slow down the US economy. However, that was not enough to but a damper on the S&P as more than 80% of stocks in the S&P rose. As with Canada, all but two of the S&P sectors ended the day higher. Basic Materials (mining and fertilizer companies) and Energy were the two laggards, ending the day lower. In contrast to Canada where Healthcare ended lower, the Healthcare sector in the US was the second-best performing sector.
Tuesday: The rally continues for all four Indexes. Weaker economic data indicated the Fed’s interest rate hikes were kicking in, giving investors hope that the Fed will ease off on the planned December rate increase.
In Canada, investors rode the optimism of American investors and pushed the TSX higher. All the Canadian sectors ended higher, led by Healthcare and Technology.
In the US, positive investor sentiment and strong earnings posted by some of the biggest blue-chip companies propelled the Nasdaq and S&P higher. All S&P sectors advanced led by the growth-oriented Consumer Cyclical and Technology sectors.
Wednesday: It was a mixed bag with the growthier oriented S&P and Nasdaq retreating, while the more traditional TSX and DJIA advanced. In the case of the DJIA, it barely squeaked into the black, ending 0.01% higher. In Canada, the TSX was able to keep its winning streak going thanks to the BoC interest rate hike coming in lower (0.5%) than expected (0.75%) and indicating it was nearing the end of its historic string of interest rate increases. Canada’s benchmark interest rate now sits at 3.75%. On the TSX, the Canadian Technology sector was the only sector to end lower.
In the US, the lower-than-expected rate height by the BoC added to US investors’ hopes the Fed will follow suit with a lower interest rate height next week. Unfortunately, disappointing earnings result from heavyweights Alphabet (NASD:GOOGL) and Microsoft (NASD:MSFT) pulled the Nasdaq and S&P down, ending their winning streak at three days. In the markets, the S&P Energy, and Healthcare sectors led the gainers while the Technology, Consumer Cyclical and Utilities sectors were the only ones to fall back.
Thursday: Another mixed bag day with the TSX and DJIA advancing and the S&P and Nasdaq retreating. In Canada, the big news was Shopify’s (TSX:SHOP) strong earnings report that showed the company beat analysts estimates for revenue and a smaller than anticipated loss. Thanks to Shopify’s impressive performance, the Canadian Technology sector more than offset four of the eleven sectors ending lower and carried the TSX into the black.
In the America, investors digested recent economic data and mixed earnings as the big technology companies reported less than impressive earnings. Meanwhile, companies in other S&P sectors posted solid earnings reports. The Industrials sector pushed the DJIA higher, while the Technology sector weighed down the S&P and Nasdaq.
Friday: All four major North American Indexes advanced as investors’ optimism the BoC and the Fed might be nearing the end of their respective interest hikes overrode a mixed bag of earnings reports from the heavyweight technology companies.
In Canada, the TSX winning streak stretched to six as many Canadian companies posted strong earnings for the last quarter. On the Bay Street (the financial heart of Canada), only the Canadian Basic Materials sector failed to end the day higher. Leading the way were the Technology and Consumer Cyclical sectors.
In the US, positive economic data, visions of milder rate hikes ahead, and strong earnings from companies outside the Technology sector helped boost investor optimism, pushing the S&P, DJIA and Nasdaq firmly into positive territory for the day and the week. On Wall Street (the financial heart of the US), it was a similar story as in Canada, with the Basic Materials sector the only sector to fall back. Leading the charge were the Technology and Telecommunications sectors.
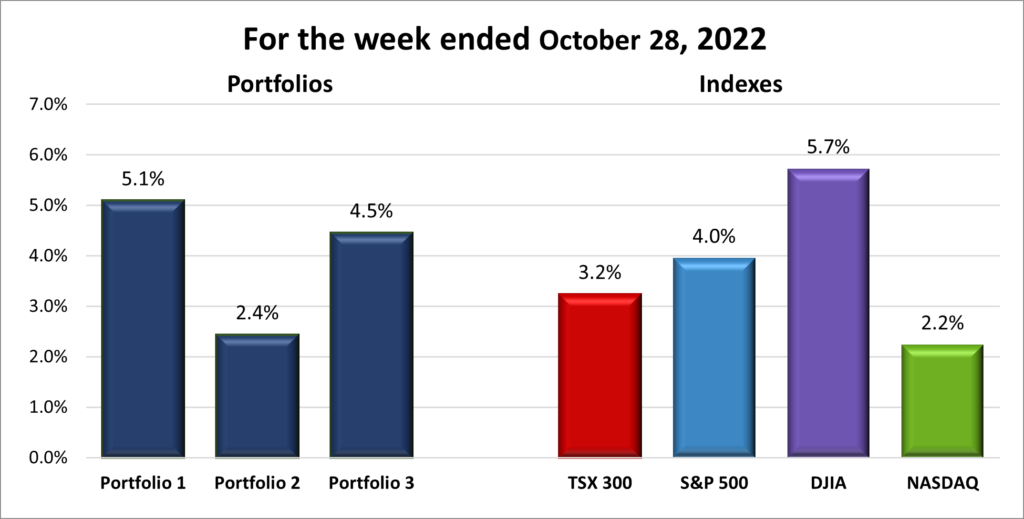
For the week, the TSX rose 3.2%,the S&P 500 gained 4.0%, the Dow jumped 5.7% and the Nasdaq advanced 2.2%.
Weekly Portfolio Review
Despite a mixed week in terms of economic data and quarterly earnings, all four indexes advanced at least a 2%. The big names in Technology – Apple (NASD:AAPL), Amazon (NASD:AMZN), Microsoft, Alphabet (Google) had a so-so week, but non technology companies had solid earnings reports. Strong earnings from oil and gas companies not only pushed the normally staid DJIA up over 5%, but they also caught the eye of the government (and not in a good way). Both governments are making noises about taxing ‘excess’ earnings. The S&P and Nasdaq were held back by less than impressive earnings reports and guidance going forward by the big technology companies mentioned above. The TSX benefitted from a smaller interest rate hike and solid earnings from many of its bigger names.
Another positive week in the markets generally means a good week for the three portfolios. And so it was. With the Nasdaq being the laggard of the indexes, I was surprised to see Portfolios 1 and 3 gaining over 4%. Many of the non technology companies in Portfolio 1 had a good week while Portfolio 3 is the benefactor of a strong earnings report by Shopify which saw its share price jump 18%. Meanwhile, Portfolio 2 just to keeps moving forward, generally never too high, and never too low.
Companies on the Radar
Another company on the radar was knocked off when Amazon dropped 19% after reporting their third quarter earnings and suggesting revenues will be sluggish over the holiday season. Otherwise, I am still following the companies below:
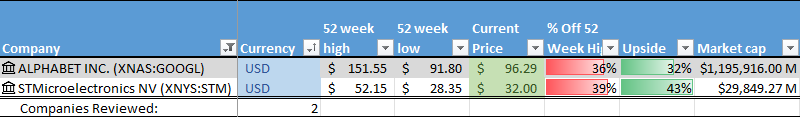
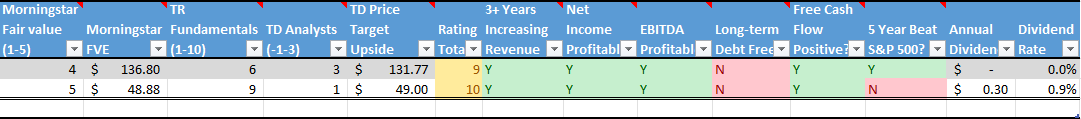
- STMicroelectronics N.V. (NYSE:STM): European manufacturer of semiconductors (chips) for the automotive industry.
- Alphabet: clear leader in online search and online advertising (Google and YouTube); leader in mobile phone operating systems (Android); one of the top cloud computing platforms (Google Cloud); computer hardware and software (Chrome); plus, expanding into other areas, such as health.
Below are my Radar Check on these two companies, updated October 28, 2022.
Portfolio Update
Portfolio 1
Portfolio 1 for the week ended October 28, 2022: UP ![]()
- Tesla (NASD:TSLA) announced it was reducing prices up to 9% in China on its Model 3 and Model Y electric vehicles. While Tesla said it was a result of lower expenses, it appears to be getting in a price war with other Chinese electric vehicle manufacturers. In this battle for the Chinese electric vehicle market, Tesla is the ‘visiting team’ and the home team likely has considerable home field advantages.
It turn out Tesla has been under investigation by the US Department of Justice (DOJ) since 2021 over the company’s claims their vehicles can drive themselves. Tesla has often touted its Autopilot driver assistance system, however, more than a dozen accidents, some deadly, involving the Autopilot system would suggest its not as good as they claim. The DOJ is investigating to see whether Tesla has misled buyers, investors, and regulators. - A strong earnings and confirmation of its outlook for next year by General Motors (NYSE:GM) gave GM’s share price a nice jolt. Good.
- Alphabet earnings showed the technology giant’s revenue growth slowed for the fifth consecutive quarter. The main causes for the slowing revenue were the strong US dollar and lower ad spending due to the ongoing economic uncertainty. Not good.
- The Rogers (TSX:RCI.B) – Shaw (TSX:SJR.B) merger is inching toward a conclusion. Canada’s Industry Minister provided the conditions required to approve the merger, providing a starting point for negotiations between Rogers – Shaw and Canada’s Competition Tribunal.
Activity
Bought: Amazon
When Amazon presented their third quarter earnings report, they warned of sluggish sales for the upcoming holiday season. This news caused investors to dump shares, resulting in a 19% plunge in the share price in after hours trading (from 1:00 PT – 5:00 PT). I was able to pick up a few shares at less than $100. I am aware the share price could fall further, but I am also aware the share price is likely to be significantly higher within a year or two.
Amazon has tremendous optionality. They are the second largest global retailer (amazon.com); the largest and leading cloud services provider (Amazon Web Services); a leader in the emerging streaming industry (Amazon Prime), developing and producing award winning shows, and live broadcasts; and a manufacturer of numerous electronic devices and services. They are also involved in healthcare, autonomous vehicles and other areas.
While Amazon is no longer directly led by its founder, he remains as the Executive Chairman, it is led by people who have been with Amazon for ten years or more. As well, revenues and earnings per share have been growing steadily for years (although this year could be a speed bump). Amazon has a significant competitive advantage thanks to their well-known brand, buying power The Amazon brand Finally, they have proven, experienced management who I feel are capable of leading Amazon through this current phase of high inflation and rising interest rates.
Put this all together and I feel the reward well outweighs the risk.
Dividends
Dividends Received this week for the following companies:
Companies followed by DRIP (Dividend Re-Investment Plan) indicate additional shares were purchased with the dividend. Any cash leftover was added to the cash balance.
Canadian $
Shaw Communications Inc (TSX:SJR.B)
BCE Inc (TSX:BCE) DRIP
US $
No US$ dividends this past week.
Quarterly Reports
Alphabet Inc.
All currency listed in millions of US dollars
Selected highlights from their third quarter 2022 financial results on October 25, 2022
- Revenue of $69,092 for the three months ended September 30, compared to $65,118 for the same period in 2021. An increase of almost 6%.
- Net income of $13,910 for the three months ended September 30, compared to net income of $18,936 in the same period in 2021.
- Diluted earnings per ordinary share of $1.06 for the three months ended September 30, compared to $1.40 for the same period in 2021.
- Revenue of $205,788 for the nine months ended September 30, compared to $182,312 for the same period in 2021. An increase of over 13%.
- Net earnings of $46,348 for the nine months ended September 30, compared to net earnings of $55,391 in the same period in 2021.
- Diluted earnings per ordinary share of $3.50 for the nine months ended September 30, compared to $4.08 for the same period in 2021.
CN Rail Company
All currency listed in millions of Canadian dollars
Selected highlights from their third quarter 2022 financial results on October 25, 2022
- Revenue of $4,513 for the three months ended September 30, compared to $3,594 for the same period in 2021. An increase of almost 26%.
- Net income of $1,455 for the three months ended September 30, compared to net income of $1,686 in the same period in 2021.
- Diluted earnings per ordinary share of $2.13 for the three months ended September 30, compared to $2.37 for the same period in 2021.
- Revenue of $12,565 for the nine months ended September 30, compared to $10,724 for the same period in 2021. An increase of over 18%.
- Net earnings of $3,698 for the nine months ended September 30, compared to net earnings of $3,698 in the same period in 2021.
- Diluted earnings per ordinary share of $5.34 for the nine months ended September 30, compared to $5.20 for the same period in 2021.
Pulse Seismic
All currency listed in thousands of Canadian dollars
Selected highlights from their third quarter 2022 financial results on October 25, 2022
- Revenue of $2,178 for the three months ended September 30, compared to $8,932 for the same period in 2021. A decrease of almost 75%.
- Net loss of $1,675 for the three months ended September 30, compared to net income of $3,164 in the same period in 2021.
- Diluted loss per ordinary share of $0.03 for the three months ended September 30, compared to net earnings per share of $0.06 for the same period in 2021.
- Revenue of $7,131 for the nine months ended September 30, compared to $32,845 for the same period in 2021. A decrease of over 78%.
- Net loss of $5,959 for the nine months ended September 30, compared to net earnings of $13,356 in the same period in 2021.
- Diluted loss per ordinary share of $0.11 for the nine months ended September 30, compared to net earnings per share of $0.25 for the same period in 2021.
Visa Inc.
All currency listed in millions of US dollars
Selected highlights from their fourth quarter 2022 financial results on October 25, 2022
- Revenue of $7,787 for the three months ended September 30, compared to $6,559 for the same period in 2021. An increase of almost 19%.
- Net income of $3,940 for the three months ended September 30, compared to net income of $3,584 in the same period in 2021.
- Diluted earnings per ordinary share of $1.86 for the three months ended September 30, compared to $1.65 for the same period in 2021.
- Revenue of $29,310 for the twelve months ended September 30, compared to $24,105 for the same period in 2021. An increase of over 22%.
- Net earnings of $14,957 for the twelve months ended September 30, compared to net earnings of $12,311 in the same period in 2021.
- Diluted earnings per ordinary share of $7.00 for the twelve months ended September 30, compared to $5.63 for the same period in 2021.
General Motors Co.
All currency listed in billions of US dollars
Selected highlights from their third quarter 2022 financial results on October 25, 2022
- Revenue of $41.9 for the three months ended September 30, compared to $26.8 for the same period in 2021. An increase of over 56%.
- Net income of $3.3 for the three months ended September 30, compared to net income of $2.4 in the same period in 2021.
- Diluted earnings per ordinary share of $2.25 for the three months ended September 30, compared to $1.62 for the same period in 2021.
- Revenue of $113.6 for the nine months ended September 30, compared to $93.4 for the same period in 2021. An increase of over 22%.
- Net earnings of $7.9 for the nine months ended September 30, compared to net earnings of $8.3 in the same period in 2021.
- Diluted earnings per ordinary share of $4.73 for the nine months ended September 30, compared to $5.55 for the same period in 2021.
TMX Group
All currency listed in millions of Canadian dollars
Selected highlights from their third quarter 2022 financial results on October 26, 2022
- Revenue of $269.3 for the three months ended September 30, compared to $231.3 for the same period in 2021. An increase of almost 17%.
- Net income of $91.6 for the three months ended September 30, compared to net income of $76.9 in the same period in 2021.
- Diluted earnings per ordinary share of $1.45 for the three months ended September 30, compared to $1.36 for the same period in 2021.
- Revenue of $842.5 for the nine months ended September 30, compared to $728.3 for the same period in 2021. An increase of over 16%.
- Net earnings of $471.3 for the nine months ended September 30, compared to net earnings of $250.6 in the same period in 2021.
- Diluted earnings per ordinary share of $7.86 for the nine months ended September 30, compared to $4.43 for the same period in 2021.
Upwork Inc.
All currency listed in thousands of US dollars
Selected highlights from their third quarter 2022 financial results on October 26, 2022
- Revenue of $158,641 for the three months ended September 30, compared to $128,141 for the same period in 2021. An increase of almost 24%.
- Net loss of $24,827 for the three months ended September 30, compared to net loss of $9,311 in the same period in 2021.
- Diluted loss per ordinary share of $0.19 for the three months ended September 30, compared to a loss per ordinary share of $0.07 for the same period in 2021.
- Revenue of $456,876 for the nine months ended September 30, compared to $365,941 for the same period in 2021. An increase of over 25%.
- Net loss of $73,385 for the nine months ended September 30, compared to net earnings of $33,684 in the same period in 2021.
- Diluted loss per ordinary share of $0.56 for the nine months ended September 30, compared to a loss per ordinary share of $0.27 for the same period in 2021.
Teladoc Health, Inc.
All currency listed in thousands of US dollars
Selected highlights from their third quarter 2022 financial results on October 26, 2022
- Revenue of $611,402 for the three months ended September 30, compared to $521,658 for the same period in 2021. An increase of almost 18%.
- Net loss of $73,476 for the three months ended September 30, compared to net loss of $83,340 in the same period in 2021.
- Diluted loss per ordinary share of $0.45 for the three months ended September 30, compared to a loss per ordinary share of $0.53 for the same period in 2021.
- Revenue of $1,769,131 for the nine months ended September 30, compared to $1,478,472 for the same period in 2021. An increase of over 20%.
- Net loss of $9,849,460 for the nine months ended September 30, compared to net loss of $417,808 in the same period in 2021.
- Diluted loss per ordinary share of $61.09 for the nine months ended September 30, compared to a loss per ordinary share of $2.68 for the same period in 2021.
Apple Inc.
All currency listed in millions of US dollars
Selected highlights from their fourth quarter 2022 financial results on October 27, 2022
- Revenue of $91,146 for the three months ended September 30, compared to $83,360 for the same period in 2021. An increase of almost 9%.
- Net income of $20,721 for the three months ended September 30, compared to net income of $20,551 in the same period in 2021.
- Diluted earnings per ordinary share of $1.29 for the three months ended September 30, compared to $1.24 for the same period in 2021.
- Revenue of $394,328 for the nine months ended September 30, compared to $365,817 for the same period in 2021. An increase of over 8%.
- Net earnings of $99,803 for the nine months ended September 30, compared to net earnings of $94,680 in the same period in 2021.
- Diluted earnings per ordinary share of $6.11 for the nine months ended September 30, compared to $5.61 for the same period in 2021.
Pinterest, Inc.
All currency listed in thousands of US dollars
Selected highlights from their third quarter 2022 financial results on October 27, 2022
- Revenue of $684,550 for the three months ended September 30, compared to $632,932 for the same period in 2021. An increase of almost 9%.
- Net loss of $65,181 for the three months ended September 30, compared to net income of $93,996 in the same period in 2021.
- Diluted loss per ordinary share of $0.10 for the three months ended September 30, compared to earnings of $0.14 for the same period in 2021.
- Revenue of $1,925,365 for the nine months ended September 30, compared to $1,731,372 for the same period in 2021. An increase of over 11%.
- Net loss of $113,538 for the nine months ended September 30, compared to net earnings of $141,739 in the same period in 2021.
- Diluted loss per ordinary share of $0.17 for the nine months ended September 30, compared to earnings of $0.20 for the same period in 2021.
Shaw Communications Inc.
All currency listed in millions of Canadian dollars
Selected highlights from their third quarter 2022 financial results on October 27, 2022
- Revenue of $1,346 for the three months ended September 30, compared to $1,375 for the same period in 2021. A decrease of 2.1%.
- Net income of $203 for the three months ended September 30, compared to net income of $354 in the same period in 2021.
- Diluted earnings per ordinary share of $0.41 for the three months ended September 30, compared to $0.70 for the same period in 2021.
- Revenue of $4,091 for the nine months ended September 30, compared to $4,132 for the same period in 2021. A decrease of over 18%.
- Net earnings of $595 for the nine months ended September 30, compared to net earnings of $734 in the same period in 2021.
- Diluted earnings per ordinary share of $1.19 for the nine months ended September 30, compared to $1.44 for the same period in 2021.
Portfolio 2
Portfolio 2 for the week ended October 28, 2022: UP ![]()
- Microsoft had decent first quarter earnings, however, the guidance they provided on future growth was below expectations. The market does not like surprises, especially negative ones, so the stock was punished, sending the share price down. The company has not changed, just the share price.
Microsoft has partnered with Meta (NASD:META) to integrate Microsoft’s productivity applications (Office, Teams, etc.) and Xbox gaming platform with Meta’s virtual reality (VR) headset. The theory is employees will be able to interact with colleagues around the world in a completely unique way. I am interested to see people respond to wearing a headset while working and how this whole VR experience plays out.
In an attempt to capture a part of a multi billion-dollar industry, Microsoft is building up its supply of Chinese video game content and helping to grow the number of Chinese game and content developers.
Activity
No significant activity to report this week.
Dividends
Dividends Received this week for the following companies:
Companies followed by DRIP (Dividend Re-Investment Plan) indicate additional shares were purchased with the dividend. Any cash leftover was added to the cash balance.
No dividends this past week.
Quarterly Reports
Microsoft Corp.
All currency listed in millions of US dollars
Selected highlights from their first quarter 2023 financial results on October 25, 2022
- Revenue of $50,122 for the three months ended September 30, compared to $45,317 for the same period in 2021. An increase of almost 10%.
- Net income of $17,556 for the three months ended September 30, compared to net income of $20,505 in the same period in 2021.
- Diluted earnings per ordinary share of $2.35 for the three months ended September 30, compared to $2.71 for the same period in 2021.
Fortis Inc.
All currency listed in millions of Canadian dollars
Selected highlights from their third quarter 2022 financial results on October 28
- Revenue of $2,553 for the three months ended September 30, compared to $2,196 for the same period in 2021. An increase of over 16%.
- Net income of $371 for the three months ended September 30, compared to net income of $342 in the same period in 2021.
- Diluted earnings per ordinary share of $0.68 for the three months ended September 30, compared to earnings of $0.62 for the same period in 2021.
- Revenue of $7,875 for the nine months ended September 30, compared to $6,865 for the same period in 2021. An increase of over 22%.
- Net earnings of $1,094 for the nine months ended September 30, compared to net earnings of $1,034 in the same period in 2021.
- Diluted earnings per ordinary share of $2.01 for the nine months ended September 30, compared to earnings of $1.92 for the same period in 2021.
Portfolio 3
Portfolio 3 for the week ended October 28, 2022: UP ![]()
- Despite posting a net loss for the third quarter and the first nine months of 2022, Shopify grew revenue by 22% year over year, whereas revenue growth was 16% a year ago. It is a good sign when your revenue growth is accelerating. Shopify also posted a net loss of US$ 0.02 for the quarter, beating analysts’ expectations of a $0.07 loss.
- Kneat.com (TSX:KSI) has signed a three-year agreement with one of the world’s largest healthcare companies. kneat.com’s Kneat Gx software platform will be used to manage the healthcare company’s validation lifecycle of up to fifty IT systems across eight countries.
Activity
No significant activity to report this week.
Dividends
Dividends Received this week for the following companies:
Companies followed by DRIP (Dividend Re-Investment Plan) indicate additional shares were purchased with the dividend. Any cash leftover was added to the cash balance.
No dividends this past week.
Quarterly Reports
Microsoft Corp.
All currency listed in millions of US dollars
Selected highlights from their first quarter 2023 financial results on October 25, 2022
- Revenue of $50,122 for the three months ended September 30, compared to $45,317 for the same period in 2021. An increase of almost 10%.
- Net income of $17,556 for the three months ended September 30, compared to net income of $20,505 in the same period in 2021.
- Diluted earnings per ordinary share of $2.35 for the three months ended September 30, compared to $2.71 for the same period in 2021.
Shopify Inc.
All currency listed in thousands of US dollars
Selected highlights from their third quarter 2022 financial results on October 27, 2022
- Revenue of $1,366,200 for the three months ended September 30, compared to $1,123,740 for the same period in 2021. An increase of almost 22%.
- Net loss of 158,409 for the three months ended September 30, compared to net income of $1,148,432 in the same period in 2021.
- Diluted loss per ordinary share of $0.12 for the three months ended September 30, compared to earnings of $0.90 for the same period in 2021.
- Revenue of $3,864,886 for the nine months ended September 30, compared to $3,231,832 for the same period in 2021. An increase of over 20%.
- Net loss of $2,836,724 for the nine months ended September 30, compared to net earnings of $3,285,970 in the same period in 2021.
- Diluted loss per ordinary share of $2.24 for the nine months ended September 30, compared to earnings of $2.58 for the same period in 2021.