Items that may only interest or educate me ….
… lest we forget, more Canadian rate hikes, American October CPI, US mid-term elections, semiconductors. Let’s begin …

Thanks to surprisingly huge jobs gains in Canada in October (108,000 new jobs, more than ten times the number economists expected), analysts believe the Bank of Canada (BoC) can justify another 0.75% increase to Canada’s benchmark interest rate. As part of Canada’s Fall Economic Statement, the Canadian government said it plans to spend an additional C$ 6.1 billion on Canadians. While I like receiving money, I am not sure giving people free money is the best idea as that is what has led to our current high inflation rate. Throwing more money at Canadians is unlikely to help the BoC get inflation down to their target range of 1% – 3%.
Sidenote: there is no such thing as free money from a government because governments only get money from taxes (in one form or another). ‘Free’ money is giving you and I back a small portion of the money we originally earned and making it sound like they are doing something special for us.
The US October Consumer Price Index (CPI) report showed the year over year rate of inflation for October was 7.7%, down from September’s 8.1%. This was the first time in eight months American consumer prices rose less than 8%. The Core CPI (CPI less food and energy prices) rose 6.3 percent over the last 12 months. Analysts were expecting a CPI rate of 7.9% and a Core CPI rate of 6.5%. While inflation is heading in the right direction, there is a long way to go to get down to the Fed’s target of 2%.
The report was a strong sign that inflation was cooling, but the US Federal Reserve (Fed) will continue to increase interest rates well into 2023. However, investors are hoping this latest report opens the door for the Fed to lower the size of the next interest rate increase scheduled for December.
After the good news of dropping inflation, the markets in both Canada and the USA reacted positively to this news, sending the indexes sharply upward. Many of the technology companies spread across the three portfolios had double digit percentage gains after the October CPI announcement. More than 90% of stocks in the S&P were in the black.
Before getting too excited, keep in mind the mini rallies this year that turned out to be bear traps. Bull markets have generally not started until roughly a year after the Fed had reversed course and started reducing interest rates. With interest rate increases projected to continue well into 2023, the first interest rate cut is a long way away.
As of November 11, the results of the US mid-term elections had not been decided. It is likely that the Republicans will win the House of Representative and possibly the Senate. With a Democratic president in the White House, that potential result could lead to gridlock until the 2024 US election. From an investing viewpoint, a split government is generally seen as favorable to the stock markets over the long run because major changes to taxes or other laws are likely off the table, as well as any sort of big spending policies.
While it appears unlikely at this point, if the Democrats somehow retain control of Congress, it could spook the markets due to concerns about big budget spending that could add fuel to existing inflation, and tighter tech-sector regulation which could slow the growth of high growth technology companies.
I was going to say a benefit of the mid-term elections being over is the removal of uncertainty caused by mid-term elections, but the outcome is still uncertain as of this writing. 😊
Tale of two Semiconductors. I keep reading that there is a glut of semiconductors (also known as chips) as well as supply issues caused by a lack of semiconductors (particularly in the automobile industry). How can there be a glut and a shortage at the same time? Turns out there are two main classes (for lack of a better word) of semiconductors – ‘leading edge’ chips and ‘lagging edge’ chips.
It is the semiconductors used in personal computers where there is a glut. There was a huge demand for these more powerful ‘leading edge’ chips at the beginning and during the pandemic as many companies implemented work from home strategies. Now that the pandemic is largely over as we have learned to live with covid-19, the demand for personal computers has slowed (plus everyone who needed a new computer already purchased one).
It is the older, less sophisticated ‘lagging edge’ or ‘trailing edge’ chips that are used in automobiles, manufacturing, networking technologies and other industrial uses. The shortage of these chips has a trickle-down effect because many industrial companies manufacture components that use these chips, which in turn are needed by other downstream companies. This is the case in the automotive industry as cars are waiting for these less sophisticated chips to be installed before they can be shipped to car dealers.
At this point you may be wondering why not simply re-purpose the advanced chips to take the place of the lesser chip. I know I was but, apparently the advanced chips simply cannot be used in place of the less advanced chips. I could not find a good explanation why they could not, but I assume it has to do with size of the chip, and how it interfaces with other components, but I am sure there are other reasons. In any event, as the demand for technology products continues to grow, there is growing demand for the trailing edge chips in almost every industry and market.
Eventually the supply chain of lagging edge chips will sort itself out, which in turn will relieve many of the supply chain issues faced by other downstream companies, such as automobiles, robotics, and appliances. I am sure once the semiconductor manufacturers pivot to producing these lesser, commodity style chips, it will cause a shortage of leading edge or even ‘bleeding edge’ semiconductors.
Before your eyes glaze over from all the talk about interest rates, let’s switch gears to what happened in the markets this past week….
Weekly Market Review
Monday: Two bits of news were front and centre for investors: the upcoming US mid-term elections, and the upcoming US Consumer Price Index (CPI) report for October inflation numbers. All four major North American indexes – the Toronto Stock Exchange Composite Index (TSX), the S&P 500 Index (S&P), the Dow Jones Industrial Average (DJIA), and the Nasdaq Composite Index (Nasdaq) – ended higher thanks to a broad-based rally that lifted big blue-chip companies and small businesses alike.
In Canada, strong third quarter corporate earnings continue to keep the TSX inching upwards. In the TSX, the Technology and Industrials sector led the way while the defensive Utilities sector was the only Canadian sector to lose ground today.
In the US, thoughts of political gridlock after the mid-term elections gave the American indexes a lift. This was reflected in the marketplace where the Technology and Energy sectors were the best performers of the eleven US S&P sectors, while only the Utilities and Consumer Cyclical sectors ended lower.
Tuesday: All four indexes ended the day higher. In Canada, the TSX hit its highest level in two months thanks to higher gold and copper prices. The Basic Materials sector (natural resources, such as gold and copper, and fertilizer manufacturers) three times higher than the second best performing Canadian sector (Utilities).
In the US, all three American indexes rose as investors bet that the US mid-term elections would leave the US with political deadlock that would stall any significant Democratic policy initiatives (read tax increases or additional spending). The market likes a stalemate since its very unlikely any major policies will be announced for a few years.
In the marketplace, the DJIA has slowly clawed its way out of market correction territory (when an index or stock falls 10% or more from its recent high). That is a good sign, but I would be happier if the S&P or Nasdaq had climbed back to single digit declines, but I will have to wait a few more months. 😊 In the market, the Basic Materials and Technology sectors pulled the S&P higher, while the Energy and Consumer Cyclical sectors were the only two sectors to lose ground.
Wednesday: All four indexes took it on the chin today, falling at least 1.6%, giving back much of the gains from the last two days. In Canada, lower oil prices caused the share prices of Energy sector companies to drop. The Basic Materials and Technology sectors were also big losers on a day that saw only the Telecommunications sector end above water.
In the US, all three American indexes fell sharply on the lower oil prices and disappointing earnings ahead of the October Consumer Price Index (CPI) inflation report due Thursday. Analysts and investors were also digesting the mixed message of the US mid term elections where the Democrats did better than expected. The market expected a stronger showing from the business friendlier Republicans. In trading, the Energy, Consumer Cyclicals and Technology sectors fell the hardest in what was a broad-based pullback where none of the eleven S&P sectors broke into the black.
Thursday: A great day for all four major North American indexes thanks to a better-than-expected US October CPI report that showed inflation was finally cooling. The rate of inflation for October came in at 7.7%, down from September’s 8.1%. Analysts had been expecting 7.9%. Analysts and investors believe this opens the door for the Fed to lower the size of the next interest rate increase, scheduled for December. Investors celebrated by sending the markets soaring, especially the Technology sector which soared over 8% in both Canada and the US.
In Canada, the TSX had its biggest gain since April 2020 thanks to gains in every Canadian sector. The big winners were the Technology, Basic Materials, and Consumer Cyclicals sectors.
In the US, the Nasdaq soared over 7%, and the S&P jumped 5.5%, their respective largest daily percentage gain since April 2020. In addition, the DJIA gained more than 1,000 points today. In the marketplace all eleven S&P sectors rose at least 2%. The big winners were the Technology, Consumer Cyclicals and Basic Materials sectors.
Friday: The excitement and enthusiasm of yesterday carried over into the markets today as all four indexes ended the day and the week higher. In Canada, China relaxed some of their Covid-19 restrictions leading investors to think that would increase the demand for oil in the world’s second largest economy, pushing the price of oil higher. Higher oil prices, combined with hopes of cooling inflation in the US helped the Technology, Energy and Consumer Cyclicals sectors pull the TSX into positive territory.
In the US, following Thursday’s CPI report, investors could not resist the call of the stock market, especially the technology companies. Strong days from Amazon (NASD:AMZN), Apple (NASD:AAPL) and Microsoft (NASD:MSFT) helped push the Nasdaq and S&P to another positive day, while a soft day in the Healthcare sector prevented the DJIA from having a better day. In the market today, Basic Materials, Consumer Cyclicals and Energy led the S&P sectors.
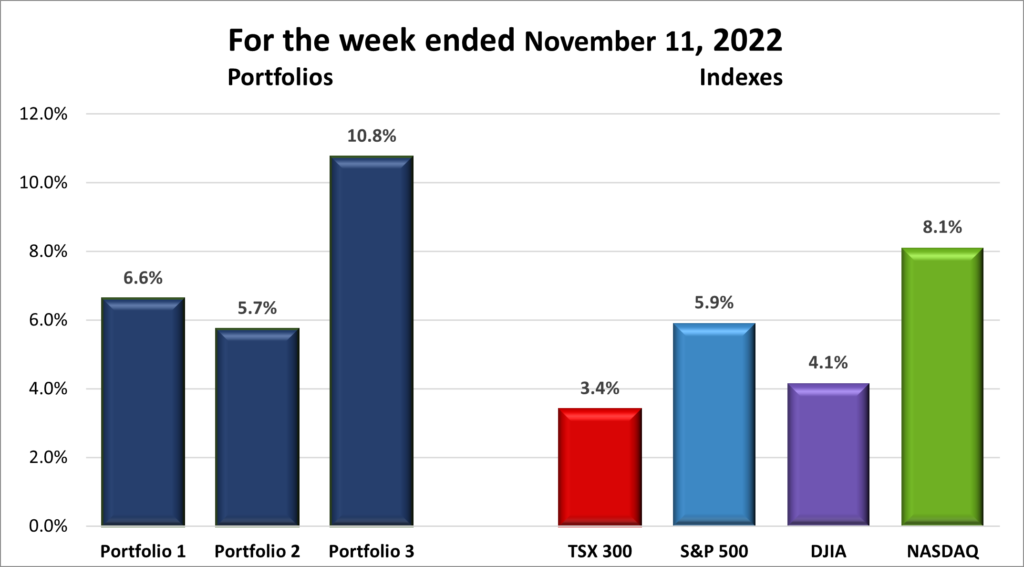
For the week, the TSX rose 3.4%, the S&P 500 gained 5.9%, the Dow advanced 4.1% and the Nasdaq jumped 8.1%.
Weekly Portfolio Review
Its amazing what a little bit of news can do. Last week, suggestions the Fed’s final interest rate could be higher than estimated caused the American markets to drop, especially the Nasdaq which dropped sharply. This week, news that the US CPI report came in lower than expected sent the American markets soaring, with Canada’s TSX getting lifted by the rising tide. The Nasdaq was the biggest beneficiary with gains more than offsetting the previous week’s losses.
Since it was a good week for all four indexes, it was a good week for the Portfolios. All three portfolios benefitted from having a technology bias, especially Portfolio 3. Shopify (TSX:SHOP) and Microsoft had good weeks, pushing Portfolio 3 to the #1 performer. Portfolio 1 was carried higher thanks to investors moving strongly back into the market, particularly the Technology sector. While not as good as the other two portfolios, Portfolio 2 had an impressive week rising almost 6%. When all three portfolios come close to beating the S&P, which had a good week itself, I call that a great week. Still a long way to get back to where they were a year ago, and there will be more pain along the road, but it is a step in the right direction.
Companies on the Radar
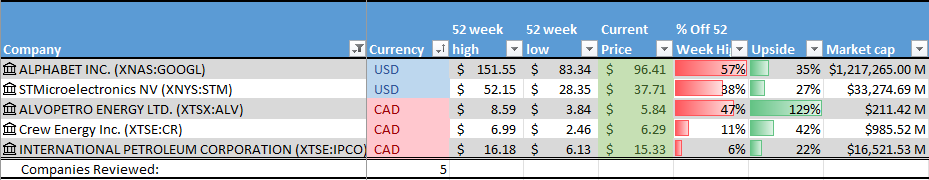
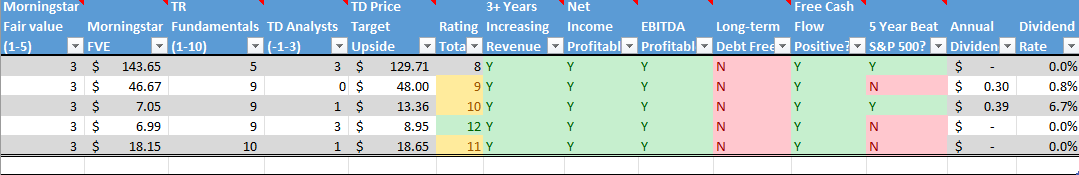
No company has stood out for me, so I am just sitting on cash, waiting for the appropriate time to deploy it. Since I was looking at Alvopetro Energy (TSXV:ALV), I decided to look at two other energy companies within the portfolios, Crew Energy (TSX:CR) and International Petroleum (TSX:IPCO). Turns out they all look decent. I like that Alvopetro provides a 6% dividend, even though Crew and IPCO score slightly higher in the Rating Total column (the total of TR Fundamentals and TD Analysts scores). Outside of energy companies, I still like STMicroelectronics N.V. (NYSE:STM), Alphabet (NASD:GOOGL).
- STMicroelectronics N.V.: European manufacturer of semiconductors (chips) for the automotive industry.
- Alphabet: clear leader in online search and online advertising (Google and YouTube); leader in mobile phone operating systems (Android); one of the top cloud computing platforms (Google Cloud); producer of computer hardware and software (Chrome); plus, expanding into other areas, such as health.
- Alvopetro Energy: a Canadian natural gas company developing natural gas projects in Brazil.
- Crew Energy: a Canadian oil and gas company with interests in British Columbia.
- International Petroleum: a Canadian company with oil and gas assets in Canada, Malaysia, and France.
Below are my Radar Checks on these companies, updated November 11, 2022.
Portfolio Update
Portfolio 1
Portfolio 1 for the week ended November 11, 2022: UP ![]()
- Tesla (NASD:TSLA) has applied to the Canadian Radio-television and Telecommunications Commission for a license for its vehicles to transmit and receive telemetry data, infotainment services, control vehicle operations and connect with emergency services. The license would be similar to the license GM (NYSE:GM) has for their OnStar service.
Tesla is facing a recall of 40,000 Model S and Model Y vehicles that could suffer a loss of power steering when driving over bumpy roads.
Tesla is mulling over the idea of exporting cars from their Shanghai facility to North America. This would allow Tesla the benefit of a widening cost advantage from manufacturing vehicles in China rather than in the USA. A speed bump in this plan is getting North American regulators to sign off on Chinese made components. A bigger speed bump would be the political fall out of replacing North American made cars with cars made in China and the resulting jobs situation.
In other Tesla related news, founder Elon Musk sold US$ 3.95 billion worth of Tesla shares despite stating in November 2021 that he would no longer sell any more Tesla shares. When he breaks his promise, he breaks his word big time. - In an effort to maintain its Chinese market after the US introduced new leading edge technology export rules, Nvidia (NASD:NVDA) developed a new advanced chip for China. The A800 semiconductor is Nvidia’s response at creating an advanced chip for China that stays within the rules set by the US government.
- Rivian (NASD:RIVN) has delivered more than one thousand of their electric vans to Amazon during the last year. Not bad for a company that a year ago had $0 in sales. Amazon is a major investor in Rivian as well as their largest customer. Rivian has an order to deliver 100,000 Rivian EV vans by 2030.
- Apple and Amazon have been accused of fixing to raise the price of iPads and iPhones sold on Amazon.
- In a move to cut costs, Amazon is currently reviewing all unprofitable business units, including Alexa’s devices unit and robotics unit. Employees can look for work in other profitable units or will be reassigned to fit Amazon’s needs. Could this mean Siri is the last digital voice sanding? 😊
Activity
No significant activity to report this week.
Dividends
Dividends Received this week for the following companies:
Companies followed by DRIP (Dividend Re-Investment Plan) indicate additional shares were purchased with the dividend. Any cash leftover was added to the cash balance.
Canadian $
Bank of Nova Scotia (TSX:BNS) DRIP
US $
Apple Inc (NASD:AAPL)
Quarterly Reports
Andlauer Healthcare Group Inc.
All currency listed in thousands of Canadian dollars, except Earnings/Loss per share numbers
Selected highlights from their third quarter 2022 financial results on November 8, 2022
- Revenue of $164,898 for the three months ended September 30, compared to $104,199 for the same period in 2021. An increase of over 58%.
- Net income of $18,995 for the three months ended September 30, compared to net income of $12,188 in the same period in 2021.
- Diluted earnings per ordinary share of $0.44 for the three months ended September 30, compared to earnings of $0.31 for the same period in 2021.
- Revenue of $482,651 for the nine months ended September 30, compared to $307,090 for the same period in 2021. An increase of over 57%.
- Net earnings of $56,451 for the nine months ended September 30, compared to net earnings of $36,850 in the same period in 2021.
- Diluted earnings per ordinary share of $1.32 for the nine months ended September 30, compared to earnings of $0.94 for the same period in 2021.
Celsius Holdings, Inc
All currency listed in thousands of US dollars, except Earnings/Loss per share numbers
Selected highlights from their third quarter 2022 financial results on November 9, 2022
- Revenue of $188,233 for the three months ended September 30, compared to $94,909 for the same period in 2021. An increase of over 98%.
- Net loss of $181,896 for the three months ended September 30, compared to net loss of $9,371 in the same period in 2021.
- Diluted loss per ordinary share of $2.46 for the three months ended September 30, compared to a loss of $0.13 for the same period in 2021.
- Revenue of $475,460 for the nine months ended September 30, compared to $210,017 for the same period in 2021. An increase of over 226%.
- Net loss of $166,059 for the nine months ended September 30, compared to a net loss of $8,005 in the same period in 2021.
- Diluted loss per ordinary share of $2.26 for the nine months ended September 30, compared to a loss of $0.11 for the same period in 2021.
Trade Desk, Inc.
All currency listed in thousands of US dollars, except Earnings/Loss per share numbers
Selected highlights from their third quarter 2022 financial results on November 9, 2022
- Revenue of $394,773 for the three months ended September 30, compared to $301,091 for the same period in 2021. An increase of over 32%.
- Net income of $15,869 for the three months ended September 30, compared to net income of $59,384 in the same period in 2021.
- Diluted earnings per ordinary share of $0.03 for the three months ended September 30, compared to earnings of $0.12 for the same period in 2021.
- Revenue of $1,087,058 for the nine months ended September 30, compared to $800,869 for the same period in 2021. An increase of almost 38%.
- Net loss of $17,802 for the nine months ended September 30, compared to net earnings of $129,723 in the same period in 2021.
- Diluted loss per ordinary share of $0.04 for the nine months ended September 30, compared to earnings of $0.26 for the same period in 2021.
Unity Software Inc.
All currency listed in thousands of US dollars, except Earnings/Loss per share numbers
Selected highlights from their third quarter 2022 financial results on November 9, 2022
- Revenue of $322,881 for the three months ended September 30, compared to $286,328 for the same period in 2021. An increase of almost 13%.
- Net loss of $250,021 for the three months ended September 30, compared to a net loss of $115,152 in the same period in 2021.
- Diluted earnings per ordinary share of $0.84 for the three months ended September 30, compared to earnings of $0.41 for the same period in 2021.
- Revenue of $940,050 for the nine months ended September 30, compared to $794,662 for the same period in 2021. An increase of over 18%.
- Net loss of $631,734 for the nine months ended September 30, compared to a net loss of $370,954 in the same period in 2021.
- Diluted loss per ordinary share of $2.13 for the nine months ended September 30, compared to a loss of $1.32 for the same period in 2021.
Rivian Automotive, Inc.
All currency listed in millions of US dollars, except Earnings/Loss per share numbers
Selected highlights from their third quarter 2022 financial results on November 9, 2022
- Revenue of $536 for the three months ended September 30, compared to $1 for the same period in 2021. An increase of almost 536%. 😊
- Net loss of $1,724 for the three months ended September 30, compared to a net loss of $1,233 in the same period in 2021.
- Diluted earnings per ordinary share of $1.88 for the three months ended September 30, compared to earnings of $12.21 for the same period in 2021.
- Revenue of $995 for the nine months ended September 30, compared to $1 for the same period in 2021. An increase of over 998%. 😊
- Net loss of $5,029 for the nine months ended September 30, compared to a net loss of $2,227 in the same period in 2021.
- Diluted loss per ordinary share of 5.53 for the nine months ended September 30, compared to a loss of $22.05 for the same period in 2021.
Marqueta, Inc
All currency listed in thousands of US dollars, except Earnings/Loss per share numbers
Selected highlights from their third quarter 2022 financial results on November 9, 2022
- Revenue of $191,621 for the three months ended September 30, compared to $131,512 for the same period in 2021. An increase of over 45%.
- Net loss of $53,168 for the three months ended September 30, compared to a net loss of $45,730 in the same period in 2021.
- Diluted loss per ordinary share of $0.10 for the three months ended September 30, compared to a loss of $0.08 for the same period in 2021.
- Revenue of $544,401 for the nine months ended September 30, compared to $361,761 for the same period in 2021. An increase of over 50%.
- Net loss of $158,454 for the nine months ended September 30, compared to net loss of $127,122 in the same period in 2021.
- Diluted loss per ordinary share of $0.29 for the nine months ended September 30, compared to a loss of $0.42 for the same period in 2021.
GDI Integrated Facility Services Inc.
All currency listed in millions of Canadian dollars, except Earnings/Loss per share numbers
Selected highlights from their third quarter 2022 financial results on November 9, 2022
- Revenue of $563 for the three months ended September 30, compared to $408 for the same period in 2021. An increase of almost 38%.
- Net income of $11 for the three months ended September 30, compared to net income of $9 in the same period in 2021.
- Diluted earnings per ordinary share of $0.44 for the three months ended September 30, compared to earnings of $0.40 for the same period in 2021.
- Revenue of $1,584 for the nine months ended September 30, compared to $1,164 for the same period in 2021. An increase of over 36%.
- Net earnings of $27 for the nine months ended September 30, compared to net earnings of $36 in the same period in 2021.
- Diluted earnings per ordinary share of $1.13 for the nine months ended September 30, compared to earnings of $1.54 for the same period in 2021.
Magnet Forensics Inc.
All currency listed in thousands of US dollars, except Earnings/Loss per share numbers
Selected highlights from their third quarter 2022 financial results on November 9, 2022
- Revenue of $24,991 for the three months ended September 30, compared to $17,773 for the same period in 2021. An increase of over 40%.
- Net income of $1,369 for the three months ended September 30, compared to net income of $2,167 in the same period in 2021.
- Diluted earnings per ordinary share of $0.03 for the three months ended September 30, compared to earnings of $0.05 for the same period in 2021.
- Revenue of $67,924 for the nine months ended September 30, compared to $48,899 for the same period in 2021. An increase of almost 39%.
- Net loss of $543 for the nine months ended September 30, compared to net earnings of $6,535 in the same period in 2021.
- Diluted loss per ordinary share of $0.01 for the nine months ended September 30, compared to earnings of $0.17 for the same period in 2021.
Magnite, Inc.
All currency listed in thousands of US dollars, except Earnings/Loss per share numbers
Selected highlights from their third quarter 2022 financial results on November 9, 2022
- Revenue of $145,815 for the three months ended September 30, compared to $131,871 for the same period in 2021. An increase of almost 11%.
- Net loss of $24,391 for the three months ended September 30, compared to net loss of $24,319 in the same period in 2021.
- Diluted loss per ordinary share of $0.18 for the three months ended September 30, compared to earnings of $0.18 for the same period in 2021.
- Revenue of $401,670 for the nine months ended September 30, compared to $307,127 for the same period in 2021. An increase of over 30%.
- Net loss of $93,938 for the nine months ended September 30, compared to a net loss of $388 in the same period in 2021.
- Diluted earnings per ordinary share of $0.71 for the nine months ended September 30, compared to earnings of $0 for the same period in 2021.
Kneat.com, Inc.
All currency listed in Canadian dollars, except Earnings/Loss per share numbers
Selected highlights from their third quarter 2022 financial results on November 9, 2022
- Revenue of $5,751,558 for the three months ended September 30, compared to $3,734,193 for the same period in 2021. An increase of over 54%.
- Net loss of $2,546,960 for the three months ended September 30, compared to net loss of $2,509,638 in the same period in 2021.
- Diluted loss per ordinary share of $0.03 for the three months ended September 30, compared to a loss of $0.03 for the same period in 2021.
- Revenue of $16,499,162 for the nine months ended September 30, compared to $9,238,312 for the same period in 2021. An increase of over 79%.
- Net loss of $9,607,108 for the nine months ended September 30, compared to net loss of $8,308,792 in the same period in 2021.
- Diluted loss per ordinary share of $0.12 for the nine months ended September 30, compared to a loss of $0.11 for the same period in 2021.
WELL Health Technologies Corp.
All currency listed in thousands of Canadian dollars, except Earnings/Loss per share numbers
Selected highlights from their third quarter 2022 financial results on November 10, 2022
- Revenue of $145,789 for the three months ended September 30, compared to $99,291 for the same period in 2021. An increase of almost 47%.
- Net income of $611 for the three months ended September 30, compared to net loss of $7,801 in the same period in 2021.
- Diluted loss per ordinary share of $0.02 for the three months ended September 30, compared to a loss of $0.06 for the same period in 2021.
- Revenue of $7,145.2 for the nine months ended September 30, compared to $4,126.3 for the same period in 2021. An increase of over 73%.
- Net loss of $3,409 for the nine months ended September 30, compared to net loss of $26,841 in the same period in 2021.
- Diluted loss per ordinary share of $0.09 for the nine months ended September 30, compared to a loss of $0.19 for the same period in 2021.
Nano-X Imaging Ltd.
All currency listed in thousands of US dollars, except Earnings/Loss per share numbers
Selected highlights from their third quarter 2022 financial results on November 10, 2022
- Revenue of $2,438 for the three months ended September 30, compared to $0 for the same period in 2021.
- Net loss of $19,126 for the three months ended September 30, compared to net loss of $13,475 in the same period in 2021.
- Diluted loss per ordinary share of $0.15 for the three months ended September 30, compared to earnings of $0.18 for the same period in 2021.
- Revenue of $6,446 for the nine months ended September 30, compared to $0 for the same period in 2021.
- Net loss of $60,406 for the nine months ended September 30, compared to net loss of $39,763 in the same period in 2021.
- Diluted loss per ordinary share of $0.53 for the nine months ended September 30, compared to a loss of $0.51 for the same period in 2021.
Docebo Inc.
All currency listed in thousands of US dollars, except Earnings/Loss per share numbers
Selected highlights from their third quarter 2022 financial results on November 10, 2022
- Revenue of $36,966 for the three months ended September 30, compared to $27,068 for the same period in 2021. An increase of almost 37%.
- Net income of $10,274 for the three months ended September 30, compared to net income of $661 in the same period in 2021.
- Diluted earnings per ordinary share of $0.30 for the three months ended September 30, compared to earnings of $0.02 for the same period in 2021.
- Revenue of $103,957 for the nine months ended September 30, compared to $74,441 for the same period in 2021. An increase of almost 40%.
- Net earnings of $5,418 for the nine months ended September 30, compared to a net loss of $12,173 in the same period in 2021.
- Diluted earnings per ordinary share of $0.16 for the nine months ended September 30, compared to a loss of $0.37 for the same period in 2021.
Copperleaf Technologies Inc.
All currency listed in Canadian dollars
Selected highlights from their third quarter 2022 financial results on November 9, 2022
- Revenue of $18,061,389 for the three months ended September 30, compared to $16,802,972 for the same period in 2021. An increase of over 7%.
- Net loss of $7,501,523 for the three months ended September 30, compared to net income of $888.2 in the same period in 2021.
- Diluted earnings per ordinary share of $0.11 for the three months ended September 30, compared to earnings of $0.20 for the same period in 2021.
- Revenue of $54,214,516 for the nine months ended September 30, compared to $47,485,285 for the same period in 2021. An increase of over 14%.
- Net loss of $25,832,903 for the nine months ended September 30, compared to net loss of $6,674,784 in the same period in 2021.
- Diluted loss per ordinary share of $0.37 for the nine months ended September 30, compared to a loss of $0.41 for the same period in 2021.
Boston Omaha Corporation
All currency listed in US dollars
Selected highlights from their third quarter 2022 financial results on November 10, 2022
- Revenue of $21,447,546 for the three months ended September 30, compared to $14,498,147 for the same period in 2021. An increase of almost 48%.
- Net loss of $1,408,521 for the three months ended September 30, compared to net loss of $26,276,094 in the same period in 2021.
- Diluted loss per ordinary share of $0.05 for the three months ended September 30, compared to earnings of $0.89 for the same period in 2021.
- Revenue of $58,635,509 for the nine months ended September 30, compared to $41,883,047 for the same period in 2021. An increase of almost 40%.
- Net earnings of $3,397,733 for the nine months ended September 30, compared to net earnings of $66,799,096 in the same period in 2021.
- Diluted earnings per ordinary share of $0.11 for the nine months ended September 30, compared to earnings of $2.32 for the same period in 2021.
Algonquin Power & Utilities Corp.
All currency listed in thousands of US dollars, except Earnings/Loss per share numbers
Selected highlights from their third quarter 2022 financial results on November 11, 2022
- Revenue of $666,724 for the three months ended September 30, compared to $528,575 for the same period in 2021. An increase of over 26%.
- Net loss of $207,335 for the three months ended September 30, compared to net loss of $39,421 in the same period in 2021.
- Diluted loss per ordinary share of $0.29 for the three months ended September 30, compared to a loss of $0.05 for the same period in 2021.
- Revenue of $2,026,680 for the nine months ended September 30, compared to $1,690,640 for the same period in 2021. An increase of over 19%.
- Net loss of 217,059 for the nine months ended September 30, compared to net earnings of $42,144 in the same period in 2021.
- Diluted loss per ordinary share of 0.21 for the nine months ended September 30, compared to earnings of $0.13 for the same period in 2021.
Portfolio 2
Portfolio 2 for the week ended November 11, 2022: UP ![]()
- Summit Industrial Income REIT (TSX:SMU.UN) soared 25.5% after Dream Industrial REIT (TSX:DIR.UN) said they were buying the company. Partnering with Dream is GIC, Singapore’s sovereign wealth fund.
- Take-Two Interactive (NASD:TTWO) slumped almost 14% after the videogame publisher lowered its annual sales outlook.
- Disney’s (NYSE:DIS) streaming service took a big bite out of revenues, costing Disney US$ 1.5 billion. As a result of Disney’s poor earnings report this week the company announced some jobs would be eliminated and a hiring freeze, with the only new hires limited to their most critical business units
- TC Energy (TSX:TRP) plans to raise funds for new projects by selling C$ 5 billion worth of assets.
Activity
No significant activity to report this week.
Dividends
Dividends Received this week for the following companies:
Companies followed by DRIP (Dividend Re-Investment Plan) indicate additional shares were purchased with the dividend. Any cash leftover was added to the cash balance.
Canadian $
Bank of Nova Scotia (TSX:BNS) DRIP
US $
No US$ dividends this past week.
Quarterly Reports
Take Two Interactive Software, Inc.
All currency listed in millions of US dollars, except Earnings/Loss per share numbers
Selected highlights from their second quarter 2022 financial results on November 7, 2022
- Revenue of $1,393.5 for the three months ended September 30, compared to $858.2 for the same period in 2021. An increase of almost 62%.
- Net loss of $257.0 for the three months ended September 30, compared to net income of $10.2 in the same period in 2021.
- Diluted loss per ordinary share of $1.54 for the three months ended September 30, compared to earnings of $0.09 for the same period in 2021.
- Revenue of $2,495.9 for the six months ended September 30, compared to $1,671.5 for the same period in 2021. An increase of over 49%.
- Net loss of $361.0 for the six months ended September 30, compared to net earnings of $162.5 in the same period in 2021.
- Diluted loss per ordinary share of $2.38 for the six months ended September 30, compared to earnings of $1.39 for the same period in 2021.
The Walt Disney Company
All currency listed in millions of US dollars, except Earnings/Loss per share numbers
Selected highlights from their fourth quarter 2022 financial results on November 8, 2022
- Revenue of $20,150 for the three months ended October 1, compared to $18,534 for the same period in 2021. An increase of almost 9%.
- Net income of $162 for the three months ended October 1, compared to net income of $160 in the same period in 2021.
- Diluted earnings per ordinary share of $0.09 for the three months ended October 1, compared to earnings of $0.09 for the same period in 2021.
- Revenue of $82,722 for the year ended October 1, compared to $67,418 for the same period in 2021. An increase of over 23%.
- Net earnings of $3,193 for the year ended October 1, compared to net earnings of $2,024 in the same period in 2021.
- Diluted earnings per ordinary share of $1.75 for the year ended October 1, compared to earnings of $1.11 for the same period in 2021.
Chorus Aviation Inc.
All currency listed in thousands of Canadian dollars, except Earnings/Loss per share numbers
Selected highlights from their third quarter 2022 financial results on November 9, 2022
- Revenue of $421,326 for the three months ended September 30, compared to $274,399 for the same period in 2021. An increase of almost 54%.
- Net income of $23,561 for the three months ended September 30, compared to net loss of $14,082 in the same period in 2021.
- Diluted earnings per ordinary share of $0.06 for the three months ended September 30, compared to a loss of $0.08 for the same period in 2021.
- Revenue of $1,156,049 for the nine months ended September 30, compared to $676,759 for the same period in 2021. An increase of over 70%.
- Net earnings of $6,065 for the nine months ended September 30, compared to a net loss of $30,644 in the same period in 2021.
- Diluted earnings per ordinary share of $0.05 for the nine months ended September 30, compared to earnings of $0.18 for the same period in 2021.
TC Energy Corporation
All currency listed in millions of Canadian dollars, except Earnings/Loss per share numbers
Selected highlights from their third quarter 2022 financial results on November 9, 2022
- Revenue of $3,799 for the three months ended September 30, compared to $3,240 for the same period in 2021. An increase of over 17%.
- Net income of $841 for the three months ended September 30, compared to net income of $779 in the same period in 2021.
- Diluted earnings per ordinary share of $0.84 for the three months ended September 30, compared to earnings of $0.80 for the same period in 2021.
- Revenue of $10,936 for the nine months ended September 30, compared to $9,803 for the same period in 2021. An increase of over 11%.
- Net earnings of $2,088 for the nine months ended September 30, compared to net earnings of $697 in the same period in 2021.
- Diluted earnings per ordinary share of $2.11 for the nine months ended September 30, compared to earnings of $0.72 for the same period in 2021.
iA Financial Corporation
All currency listed in millions of Canadian dollars, except Earnings/Loss per share numbers
Selected highlights from their third quarter 2022 financial results on November 9, 2022
- Revenue of $3,848 for the three months ended September 30, compared to $3,834 for the same period in 2021. An increase of less than 1%.
- Net income of $214 for the three months ended September 30, compared to net income of $226 in the same period in 2021.
- Diluted earnings per ordinary share of $2.03 for the three months ended September 30, compared to a loss of $2.01 for the same period in 2021.
- Revenue of $4,241 for the nine months ended September 30, compared to $9,509 for the same period in 2021. A decrease of over 55%.
- Net earnings of $589 for the nine months ended September 30, compared to net income of $635 in the same period in 2021.
- Diluted earnings per ordinary share of $5.48 for the nine months ended September 30, compared to earnings of $5.76 for the same period in 2021.
Kneat.com, Inc.
All currency listed in Canadian dollars
Selected highlights from their third quarter 2022 financial results on November 9, 2022
- Revenue of $5,751,558 for the three months ended September 30, compared to $3,734,193 for the same period in 2021. An increase of over 54%.
- Net loss of $2,546,960 for the three months ended September 30, compared to net loss of $2,509,638 in the same period in 2021.
- Diluted loss per ordinary share of $0.03 for the three months ended September 30, compared to a loss of $0.03 for the same period in 2021.
- Revenue of $16,499,162 for the nine months ended September 30, compared to $9,238,312 for the same period in 2021. An increase of over 79%.
- Net loss of $9,607,108 for the nine months ended September 30, compared to net loss of $8,308,792 in the same period in 2021.
- Diluted loss per ordinary share of $0.12 for the nine months ended September 30, compared to a loss of $0.11 for the same period in 2021.
Portfolio 3
Portfolio 3 for the week ended November 11, 2022: UP ![]()
- Microsoft faces another European Union antitrust complaint, this time over its cloud computing services. It is alleged Microsoft uses its dominant position in productivity software (Office products) to leverage its Office 365 users towards Microsoft’s Azure cloud services to the detriment of Amazon, Google, and other European cloud providers.
- Brookfield Asset Management (TSX:BAM.A) partnered with MidOcean Energy to buy out Australia’s second largest power producer Origin Energy with an offer of $11.8 billion. Origin Energy has backed the proposal which would see Brookfield acquire Origin’s energy markets business while MidOcean would control Origin’s integrated gas business.
Activity
No significant activity to report this week.
Dividends
Dividends Received this week for the following companies:
Companies followed by DRIP (Dividend Re-Investment Plan) indicate additional shares were purchased with the dividend. Any cash leftover was added to the cash balance.
No dividends this past week.
Quarterly Reports
Fortuna Silver Mines Inc.
All currency listed in thousands of US dollars, except Earnings/Loss per share numbers
Selected highlights from their third quarter 2022 financial results on November 9, 2022
- Revenue of $166,568 for the three months ended September 30, compared to $162,569 for the same period in 2021. An increase of over 2%.
- Net loss of $4,126 for the three months ended September 30, compared to net income of $211 in the same period in 2021.
- Diluted loss per ordinary share of $0.01 for the three months ended September 30, compared to earnings of $0 for the same period in 2021.
- Revenue of $516,768 for the nine months ended September 30, compared to $400,917 for the same period in 2021. An increase of almost 29%.
- Net earnings of $24,528 for the nine months ended September 30, compared to net earnings of $42,795 in the same period in 2021.
- Diluted earnings per ordinary share of $0.08 for the nine months ended September 30, compared to earnings of $0.19 for the same period in 2021.
Magnite, Inc.
All currency listed in thousands of US dollars, except Earnings/Loss per share numbers
Selected highlights from their third quarter 2022 financial results on November 9, 2022
- Revenue of $145,815 for the three months ended September 30, compared to $131,871 for the same period in 2021. An increase of almost 11%.
- Net loss of $24,391 for the three months ended September 30, compared to net loss of $24,319 in the same period in 2021.
- Diluted loss per ordinary share of $0.18 for the three months ended September 30, compared to earnings of $0.18 for the same period in 2021.
- Revenue of $401,670 for the nine months ended September 30, compared to $307,127 for the same period in 2021. An increase of over 30%.
- Net loss of $93,938 for the nine months ended September 30, compared to a net loss of $388 in the same period in 2021.
- Diluted earnings per ordinary share of $0.71 for the nine months ended September 30, compared to earnings of $0 for the same period in 2021.
GDI Integrated Facility Services Inc.
All currency listed in millions of Canadian dollars, except Earnings/Loss per share numbers
Selected highlights from their third quarter 2022 financial results on November 9, 2022
- Revenue of $563 for the three months ended September 30, compared to $408 for the same period in 2021. An increase of almost 38%.
- Net income of $11 for the three months ended September 30, compared to net income of $9 in the same period in 2021.
- Diluted earnings per ordinary share of $0.44 for the three months ended September 30, compared to earnings of $0.40 for the same period in 2021.
- Revenue of $1,584 for the nine months ended September 30, compared to $1,164 for the same period in 2021. An increase of over 36%.
- Net earnings of $27 for the nine months ended September 30, compared to net earnings of $36 in the same period in 2021.
- Diluted earnings per ordinary share of $1.13 for the nine months ended September 30, compared to earnings of $1.54 for the same period in 2021.
Unity Software Inc.
All currency listed in thousands of US dollars, except Earnings/Loss per share numbers
Selected highlights from their third quarter 2022 financial results on November 9, 2022
- Revenue of $322,881 for the three months ended September 30, compared to $286,328 for the same period in 2021. An increase of almost 13%.
- Net loss of $250,021 for the three months ended September 30, compared to a net loss of $115,152 in the same period in 2021.
- Diluted earnings per ordinary share of $0.84 for the three months ended September 30, compared to earnings of $0.41 for the same period in 2021.
- Revenue of $940,050 for the nine months ended September 30, compared to $794,662 for the same period in 2021. An increase of over 18%.
- Net loss of $631,734 for the nine months ended September 30, compared to a net loss of $370,954 in the same period in 2021.
- Diluted loss per ordinary share of $2.13 for the nine months ended September 30, compared to a loss of $1.32 for the same period in 2021.
Kneat.com, Inc.
All currency listed in Canadian dollars
Selected highlights from their third quarter 2022 financial results on November 9, 2022
- Revenue of $5,751,558 for the three months ended September 30, compared to $3,734,193 for the same period in 2021. An increase of over 54%.
- Net loss of $2,546,960 for the three months ended September 30, compared to net loss of $2,509,638 in the same period in 2021.
- Diluted loss per ordinary share of $0.03 for the three months ended September 30, compared to a loss of $0.03 for the same period in 2021.
- Revenue of $16,499,162 for the nine months ended September 30, compared to $9,238,312 for the same period in 2021. An increase of over 79%.
- Net loss of $9,607,108 for the nine months ended September 30, compared to net loss of $8,308,792 in the same period in 2021.
- Diluted loss per ordinary share of $0.12 for the nine months ended September 30, compared to a loss of $0.11 for the same period in 2021.
goeasy Ltd.
All currency listed in thousands of Canadian dollars, except Earnings/Loss per share numbers
Selected highlights from their third quarter 2022 financial results on November 10, 2022
- Revenue of $262,216 for the three months ended September 30, compared to $219,762 for the same period in 2021. An increase of over 19%.
- Net income of $47,189 for the three months ended September 30, compared to net income of $63,540 in the same period in 2021.
- Diluted earnings per ordinary share of $2.86 for the three months ended September 30, compared to earnings of $3.66 for the same period in 2021.
- Revenue of $746,010 for the nine months ended September 30, compared to $592,292 for the same period in 2021. An increase of over 73%.
- Net earnings of $111,585 for the nine months ended September 30, compared to net earnings of $194,982 in the same period in 2021.
- Diluted earnings per ordinary share of $6.71 for the nine months ended September 30, compared to earnings of $11.75 for the same period in 2021.
Brookfield Asset Management Inc.
All currency listed in millions of US dollars, except Earnings/Loss per share numbers
Selected highlights from their third quarter 2022 financial results on November 10, 2022
- Revenue of $23,418 for the three months ended September 30, compared to $19,248 for the same period in 2021. An increase of almost 22%.
- Net income of $716 for the three months ended September 30, compared to net income of $2,722 in the same period in 2021.
- Diluted earnings per ordinary share of $0.24 for the three months ended September 30, compared to earnings of $0.47 for the same period in 2021.
- Revenue of $68,556 for the nine months ended September 30, compared to $53,944 for the same period in 2021. An increase of over 27%.
- Net earnings of $5,151 for the nine months ended September 30, compared to net earnings of $8,927 in the same period in 2021.
- Diluted earnings per ordinary share of $1.40 for the nine months ended September 30, compared to earnings of $1.72 for the same period in 2021.