Items that may only interest or educate me ….
Canadian Economic news, US employment news, US credit rating surprise …
Over the last 30 years, August and September have been the worst two months for the markets, according to Bloomberg News. Will August be a reality check after the bullish June and July or more room for the bulls to run? Based on this past week, so far it seems to be a reality check. Let us hope this week was just a pothole on the upward path the markets have been on for the last few months.
Canadian Economic news
In an unexpected turn, Canada’s July Labour Force Survey revealed a decrease of 6,400 jobs, a stark contrast to the anticipated gain of 21,100 jobs for the same month. The most significant decline in employment was observed among men aged 25 to 54 years old. Conversely, employment figures saw an increase for young men aged 15 to 24 years.
Correspondingly, the unemployment rate experienced a 0.1 percentage point rise to 5.5%, marking the first instance of unemployment increase since the pandemic’s onset. Notably, most of the uptick in the unemployment rate was driven by women, whereas men experienced little change.
On an annual basis, the average hourly wages registered a 5.0% gain in July. This follows prior incremental gains of 4.2% in June and 5.1% in May. While wage growth continues to surpass the Bank of Canada’s (BoC) preferences, it is worth noting that wage trends tend to trail behind labor market movements.
With the job market displaying signs of slowing down and unemployment rates on the rise, it appears that the BoC’s endeavors to temper the economy’s pace are yielding results, resulting in an economic slowdown. This latest dataset strengthens the indication that the BoC will likely maintain the benchmark rate at 5% during its upcoming announcement on September 6th.
US employment news
At the start of the week, the Labor Department released its June Job Openings and Labor Turnover Survey (JOLTS) report, revealing a significant decrease in job openings to their lowest point in over two years. The count of job openings contracted by 34,000, settling at a total of 9.582 million. This figure is below May’s 9.824 million job openings and falls short of analysts’ projections, which had forecasted 9.630 million job openings for the same period.
Meanwhile, the ADP National Employment report indicated that private payrolls experienced a rise of 324,000 jobs in July. Although this number is below June’s addition of 455,000 jobs, it still surpasses the anticipated 189,000 jobs for July. This data suggests that the labour market is undergoing a phase of moderation while retaining its strength. In conjunction with the job increases, ADP’s report showed a 6.2% annual increase in wages. This represents a slight deceleration from June’s 6.4% growth.
Finally, at the end of the week, the Labor Department released its Employment Summary for July. The report outlined that non-farm payrolls added 187,000 jobs, trailing June’s robust addition of 209,000 jobs. Analysts’ expectations had centered around a gain of 200,000 jobs. Furthermore, the unemployment rate decreased to 3.5%, down from June’s 3.6%. Analysts had forecast the unemployment rate to remain at 3.6%. The report also showed a 0.4% monthly upswing in average hourly earnings, leading to a 4.4% annual increase. While this is great for employees, the annual wage growth now surpasses inflation. This suggests that consumers are likely to retain their purchasing power, potentially contributing to maintaining inflation levels above the Federal Reserve’s (Fed) 2% target.
These employment reports reinforce the perception that the economy is headed toward the Federal Reserve’s (Fed) sought-after “soft landing” rather than a recession. However, the data still points toward a tight labour market, which could prompt the Fed to maintain higher interest rates for a prolonged period. A “soft landing” refers to a controlled and gradual easing of economic activity, often coupled with a reduction in inflation, without incurring major disruptions or adverse impacts on employment and overall economic stability.
US credit rating surprise
Fitch Group, one of the three major credit rating agencies, downgraded the US’s credit rating from the top AAA rating to AA+ on Tuesday. The downgrade was due to growing US deficits and political dysfunction. Fitch cited the recent last-minute US debt ceiling negotiations that threatened the government’s ability to pay its bills, and the likelihood that brinkmanship would reoccur, as the financial concerns. The political instability the Fitch group referred to has be the political divide that currently exists in the US.
The US government strongly disagreed with the assessment, calling it “arbitrary and based on outdated data.” It does seem odd that the US would be downgraded while its economy is growing, however, the government is spending a lot of money and the constant political squabbles are unlikely to end any time soon.
With the downgrade, Fitch joins Standard & Poor’s who previously dropped the US government from the AAA rating in 2011. The downgrade puts the US at a level with Great Britain and Japan, but below Canada, Australia, Singapore, and a few western European countries.
After the gains of the last two months, August has started out like its determined to end the market’s summer hot streak. Let’s see what happened this past week to throw cold water on the markets ….
Weekly Market Review
Monday: Once again the markets got off to a good start with all four major North American indexes advancing. Investors are preparing for earnings reports from two more of the mega cap technology companies report, as well as many other well-known companies. Falling inflation and economic resilience in Canada and the US have improved investor optimism. Oil continued to rise as global supplies get tighter.
In Canada, the Toronto Stock Exchange Composite Index (TSX) edged higher as commodity prices rose on hopes the economy will avoid a recession. With commodity prices up, the Basic Materials (miners and fertilizer manufacturers) led all Canadian sectors, followed by the Technology sector. Telecommunications Services, Industrials and Utilities were the only sector to lose ground.
In the US, the S&P 500 Index (S&P), the Dow Jones Industrial Average (DJIA), and the Nasdaq Composite Index (Nasdaq) all posted monthly gains. The S&P 500 posted its fifth-straight monthly gain, its best streak since 2021. In trading, Energy and Basic Materials were the top American sectors, while Telecommunications Services, Consumer Staples and Healthcare were the only sectors to drop.
Tuesday: The markets stumbled today, with the DJIA the only index to gain ground. Mixed results from several large US companies and investors taking profits after a bullish July were the main drivers of the markets.
In Canada, concerns about China’s sputtering economy led to worries about demand for raw materials, sending the TSX lower. In the Canadian sectors, Industrials and Energy led the gainers, while Basic Materials and Utilities had the biggest drops.
In the US, second quarter earnings results continue to come in, but they have been unable to set a direction for the markets. Some big-name companies beat expectations, some meet expectations, and some miss. In the markets, Industrials was the only American sector to end in the green, while Basic Materials and Utilities were the deepest in the red.
Wednesday: All four indexes dropped sharply after private payrolls increased more than expected and the US unexpectedly received a downgrade in their credit rating from AAA to AA+ by one of the top three global credit rating agencies, the Fitch Group. Investors immediately unloaded stocks and moved into safer, more stable government bonds and cash, sending the stock markets lower.
In Canada, the TSX ended lower on the news out of the US and lower oil prices. All Canadian sectors declined today. Consumer Staples and Healthcare fell the least and Technology and Basic Materials fell the hardest.
In the USA, investors did not need to be told twice to take profits after the credit rating cut. It was a day of broad-based declines in the American sectors with Consumer Staples and Utilities falling the least and Technology and Basic Materials dropped the most.
Thursday: The selloff that started yesterday resumed this morning before the indexes started clawing their way into positive territory, only to fall back into negative territory at the end of the day. Today, investors are waiting for the earnings reports from two of bigger technology darlings – Apple (NASD: AAPL) and Amazon (NASD: AMZN). Oil prices climbed higher on tighter supply.
In Canada, disappointing quarterly reports and underwhelming forecasts by a few big-name Canadian companies added to the downward pressure created by the downgrade of the US’s credit rating. On Bay Street, Energy and Healthcare were the only Canadian sectors to end in the green while Technology and Utilities sank the farthest into the red.
In the US, it was a bit of a rollercoaster ride for the American indexes but eventually the weight of Wednesday’s downgrade sunk all three indexes. In trading on Wall Street, Energy and Consumer Staples were the only American sectors to advance, while Utilities and Telecommunications Services suffered the biggest declines.
Friday: Its always nice when a company you own is the catalyst for a market rally. Today, Amazon was the catalyst. Its earnings report beat expectations and, more importantly, they were optimistic about the third quarter based on strong cloud sales and shopping trends. However, it was not enough to save the three American indexes from ending in the red. Oil prices rose on supply concerns pushing oil higher for the sixth week in a row.
In Canada, the TSX was the lone index to stay in the green all day, driven by a rotation away from interest rate sensitive technology companies into commodities sectors energy and basic materials. This bodes well for the commodities heavy TSX as we head into the back half of 2023. In trading in the Canadian sectors, Financials and utilities were the biggest winners, while Technology and Consumer Cyclicals had the biggest drops.
In the US, the American indexes were riding high on the latest jobs report indicated the labor market continued to cool down. However, a disappointing report from Apple and profit taking overcame the upward momentum of the Amazon report and the jobs news. The afternoon drop caused the Nasdaq and S&P to have their worst weekly declines since March. In trading, Consumer Cyclicals and Energy were the only sectors to end higher, while Technology and Utilities had the largest declines.
Weekly Market and Portfolio Review
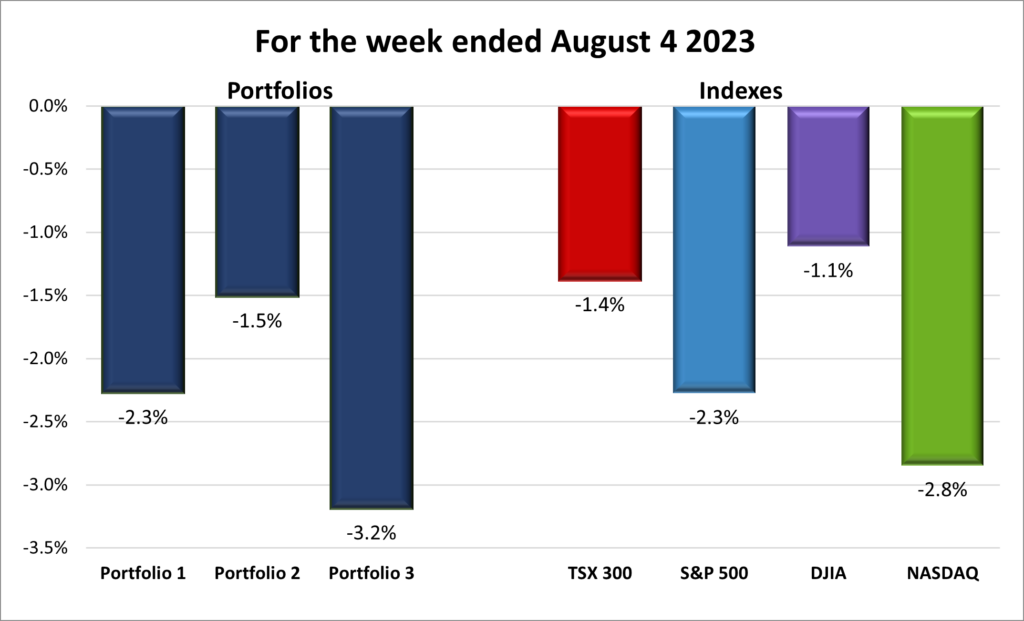
For the week, the TSX (SPTSX) slipped 1.4%, the S&P 500 (SPX) lost 2.3%, the DJIA (INDU) declined 1.1% and the Nasdaq (CCMP) fell 2.8%.
![]() As depicted in the graph above, the past week proved to be challenging for the four major North American stock indexes. Following a promising start to conclude July, the indexes dropped throughout the week. The primary driver behind this drop was the unforeseen credit rating downgrade of the US. Financial markets typically do not like surprises, and this instance was no different. Furthermore, a lacklustre earnings report and cautious outlook from Apple added to the uncertainty, prompting investors to question the potential for other unanticipated earnings disappointments. In contrast, the TSX managed to recuperate some lost ground, primarily driven by gains in the energy and commodity sectors.
As depicted in the graph above, the past week proved to be challenging for the four major North American stock indexes. Following a promising start to conclude July, the indexes dropped throughout the week. The primary driver behind this drop was the unforeseen credit rating downgrade of the US. Financial markets typically do not like surprises, and this instance was no different. Furthermore, a lacklustre earnings report and cautious outlook from Apple added to the uncertainty, prompting investors to question the potential for other unanticipated earnings disappointments. In contrast, the TSX managed to recuperate some lost ground, primarily driven by gains in the energy and commodity sectors.
![]() I was hoping the portfolios would build on the upward momentum from July, but it was not to be. As illustrated in the chart below, all three portfolios suffered sizable declines. Definitely not the way to start August. The retreat of the markets in general, the technology sector specifically, and investors taking profits after a strong bull run through June and July dragged all three portfolios lower. Hopefully next week will be better.
I was hoping the portfolios would build on the upward momentum from July, but it was not to be. As illustrated in the chart below, all three portfolios suffered sizable declines. Definitely not the way to start August. The retreat of the markets in general, the technology sector specifically, and investors taking profits after a strong bull run through June and July dragged all three portfolios lower. Hopefully next week will be better.
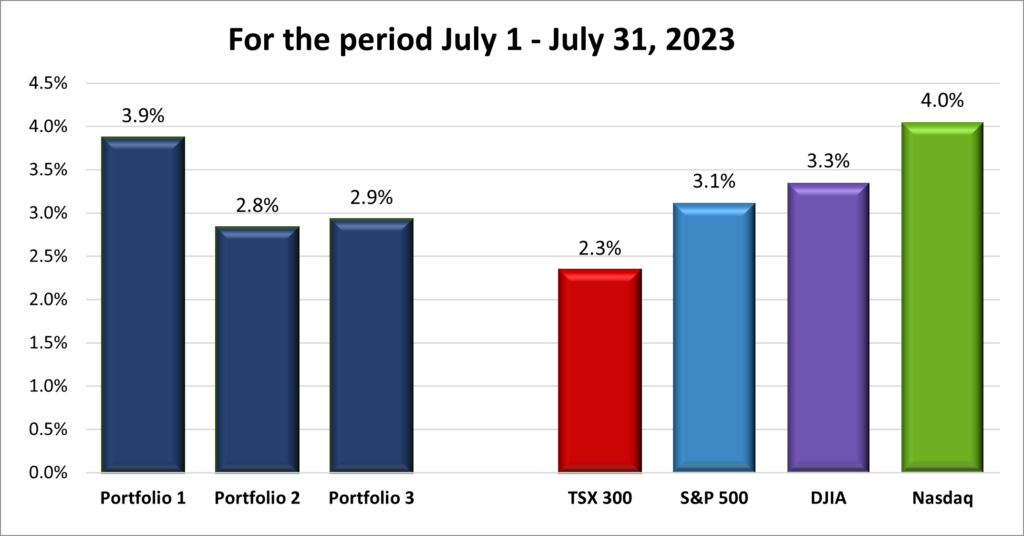
For the month, the TSX (SPTSX) gained 2.3%, the S&P 500 (SPX) rose 3.1%, the DJIA (INDU) advanced 3.3% and the Nasdaq (CCMP) increased 4.0%.
![]() Fortunately, the performance of the indexes throughout July stood in stark contrast to the recent week’s downturn. As evident from the provided graph, the markets enjoyed another robust month, with each index recording gains. Notably, both the S&P and Nasdaq marked their fifth consecutive month of upward movement. The beginning of July was marked by concerns surrounding elevated interest rates in both Canada and the US, resulting in an initial dip. However, the indexes adeptly reversed these early declines. With the exception of minor fluctuations observed in the TSX and Nasdaq, the upward trajectory remained intact through the end of the month. Improved economic data gave investors a renewed sense of confidence, propelling all four indexes higher.
Fortunately, the performance of the indexes throughout July stood in stark contrast to the recent week’s downturn. As evident from the provided graph, the markets enjoyed another robust month, with each index recording gains. Notably, both the S&P and Nasdaq marked their fifth consecutive month of upward movement. The beginning of July was marked by concerns surrounding elevated interest rates in both Canada and the US, resulting in an initial dip. However, the indexes adeptly reversed these early declines. With the exception of minor fluctuations observed in the TSX and Nasdaq, the upward trajectory remained intact through the end of the month. Improved economic data gave investors a renewed sense of confidence, propelling all four indexes higher.
![]() The bullish momentum observed throughout July provided a significant boost to all three portfolios. As indicated in the chart below, the technology heavy Nasdaq experienced a particularly successful month. Considering that all three portfolios are oriented to varying degrees on the technology sector, they were all able to ride the tailwinds that propelling this sector higher. Additionally, the uptick in oil prices and the expansion of the market rally beyond the technology sector contributed to the positive performance of each portfolio. It would be great if the coming months could replicate and build upon the gains of July. 😊
The bullish momentum observed throughout July provided a significant boost to all three portfolios. As indicated in the chart below, the technology heavy Nasdaq experienced a particularly successful month. Considering that all three portfolios are oriented to varying degrees on the technology sector, they were all able to ride the tailwinds that propelling this sector higher. Additionally, the uptick in oil prices and the expansion of the market rally beyond the technology sector contributed to the positive performance of each portfolio. It would be great if the coming months could replicate and build upon the gains of July. 😊
Companies on the Radar

In the past week, the Radar List underwent shifts and adjustments, with two new entrants and two departing companies, but in differing directions. The choice between Cameco (TSX: CCO) and BWX Technologies (NYSE: BWXT), both well regarded in the nuclear energy sector, presented a decision point. Opting for a single nuclear energy company, I chose to add Cameco due to its higher potential for growth. Notably, Cameco’s trading value was below Morningstar’s fair market valuation, a key consideration that tipped the scales.
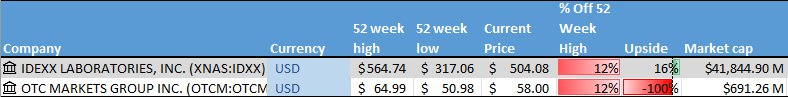
For the time being, I intend to remain on the sidelines unless a truly exceptional opportunity emerges. Nevertheless, I continue to monitor the markets for any potential investments, and during this period, two intriguing companies came onto my radar: OTC Markets Group Inc. (OTCM: OTCM) and Idexx Laboratories (NASD: IDXX).
OTC Markets Group Inc., a small-cap American company, that owns and operates the over-the-counter market trading system, often referred to as pink sheets. Interestingly, I had held shares of this company until 2021, when I decided to divest due to limited share price movement. It is somewhat disheartening to see the share price has surged by an impressive 65%.
Idexx Laboratories, a large-cap American firm, holds a prominent position within the animal industry. Serving veterinarians with a spectrum of products and tests for pets and livestock, Idexx is one of the industry’s top dogs 😊. If you own a pet and have ever taken it to the vet, this company’s products have likely played a role in the veterinary care your pet received.
As I conducted my Quick Test on OTCM, I encountered a lack of available information on the company. The absence of data from reputable sources such as Morningstar and Thomson-Reuters, as you can see in the second chart below, led me to a decision to move forward without further exploration of OTCM.
Regarding IDXX, while the company holds promise, the stock is considered overpriced, trading at a premium. This consideration prompted me to pass on IDXX, as it does not align with my valuation criteria.
Although neither of the companies passed the Quick Test, it is good to see that the Quick Test effectively fulfilled its intended purpose – efficiently filtering out companies that do not align with my investment strategy before committing valuable time to researching them. While this outcome might appear as a minor victory, it underscores the importance of this initial screening process in optimizing my investment research efforts.
The Radar Check was last updated August 4, 2023.

Portfolio Update
Portfolio 1
Portfolio 1 for the week ended August 4, 2023: DOWN ![]()
- Nvidia (NASD: NVDA) is teaming its Drive and Omniverse platforms with Hesai Technology’s (NASD: HSAI) lidar sensors for projects in the autonomous driving space. Another revenue stream for Nvidia
- Tesla (NASD: TSLA) is once again being investigated by National Highway Traffic Safety Administration (NHTSA). This time over reports of loss of steering control in 280,000 new Model 3 and Model Y electric vehicles (EV).
More bad news for Tesla, the company is the subject of a class action lawsuit in California. This time Tesla is accused of false advertising when it comes to the estimated driving range of their EV. Surprisingly, the advertised their cars went farther on a full charge than they actually did. 😊 - Amazon is back into buying real estate after a year ago saying they had too many warehouses. This time they are looking for smaller properties to double the number of same-day delivery centers they own. The plan is for these smaller centres to carry the 100,000 most-popular items on Amazon. When a same day centre gets an order, the product is on its way within 11 minutes. Now that is fast.
In other Amazon news, the company is expanding its digital health care unit, Amazon Clinic, throughout the US to all 50 states.
Activity
Liberty Media’s Formula 1 tracking (NASD: FWONK) split off its Braves Holdings, LLC unit. The new public company, Atlanta Braves Holdings, owns and operates the Atlanta Braves major league baseball club, operates the team’s baseball stadium, and owns a mixed-use real estate development project. The new company trades under the ticker (NASD: BATRK).
Bought: Cameco: Cameco is a major Canadian company that is one of the world’s largest uranium producers and global suppliers of uranium fuel and nuclear reactor components for clean energy production. As the global shift towards cleaner energy intensifies, nuclear power is emerging as a crucial energy source. Cameco stands out not only for its uranium mining operations but also for its leadership in uranium refining, conversion of fuel for light water and heavy water nuclear reactors, and the manufacturing and distribution of in-core reactor components for CANDU reactors worldwide. With a solid track record spanning over three decades, Cameco has been instrumental in generating electricity through nuclear reactors across the globe.
In contrast to the challenges posed by the intermittent nature of solar and wind energy, as well as the lengthy timeline for hydroelectric dam construction, nuclear energy emerges as a viable and reliable option. In fact, some nuclear reactors slated for closure have been extended, while new reactors have begun operations in both Canada and the US.
Cameco benefits from a stable senior management team with over a decade of experience in the uranium mining industry. The company’s positive corporate culture rating speaks to its conducive work environment. From a financial perspective, Cameco is performing well, with growth in sales, net income, and free cash flow. Debt remains manageable, and the controlled growth of outstanding shares is a positive sign. While the dividend is modest, at C$0.12 per year, it adds to the overall appeal.
Risks do exist, encompassing potential government regulations affecting the uranium sector, reactor-related challenges influencing shifts away from nuclear energy, opposition to nuclear power, and competition from other uranium producers.
A few years ago, I would not have ever thought about investing in a nuclear energy company. Then again, I never would have invested in oil companies. Now I am invested in both. 😊 I made a strategic investment decision to invest in Cameco because the world will need energy from nuclear reactors if emissions are to be reduced. As one of the top global suppliers of uranium and nuclear reactor components, it is well positioned to benefit from this tailwind. While the stock may not experience explosive growth like technology companies, I expect steady expansion as the demand for clean energy and its products increases over time.
I believe that Cameco is a well-positioned company with a bright future. I am confident in its long-term growth prospects and look forward to seeing the company and the share price grow.
Dividends
Dividends Received this week for the following companies:
Companies followed by DRIP (Dividend Re-Investment Plan) indicate additional shares were purchased with the dividend. Any cash leftover was added to the cash balance.
Canadian $
Toronto-Dominion Bank (TSX: TD) DRIP
Bank of Nova Scotia (TSX: BNS) DRIP
US $
No US$ dividends this past week.
Quarterly Reports
Lattice Semiconductor Corporation
All currency listed in thousands of US dollars, except for per share data.
Selected highlights from their second quarter 2023 financial results on July 31, 2023
- Revenue of $190,079 for the three months ended June 30, compared to $161,372 for the same period in 2022. An increase of almost 18%.
- Net income of $50,644 for the three months ended June 30, compared to net income of $44,532 in the same period in 2022.
- Diluted earnings per ordinary share of $0.36 for the three months ended June 30, compared to earnings of $0.32 per share for the same period in 2022.
- Revenue of $374,389 for the six months ended June 30, compared to $311,887 for the same period in 2022. An increase of over 20%.
- Net earnings of $106,567 for the six months ended June 30, compared to net earnings of $80,610 in the same period in 2022.
- Diluted earnings per ordinary share of $0.76 for the six months ended June 30, compared to earnings of $0.57 per share for the same period in 2022.
Pinterest, Inc
All currency listed in thousands of US dollars, except for per share data.
Selected highlights from their second quarter 2023 financial results on August 1, 2023
- Revenue of $708,025 for the three months ended June 30, compared to $665,930 for the same period in 2022. An increase of over 6%.
- Net loss of $34,942 for the three months ended June 30, compared to a net loss of $43,076 in the same period in 2022.
- Diluted loss per ordinary share of $0.05 for the three months ended June 30, compared to a loss of $0.07 per share for the same period in 2022.
- Revenue of $1,310,606 for the six months ended June 30, compared to $1,240,815 for the same period in 2022. An increase of over 5%.
- Net loss of $243,521 for the six months ended June 30, compared to a net loss of $48,357 in the same period in 2022.
- Diluted loss per ordinary share of $0.36 for the six months ended June 30, compared to a loss of $0.07 per share for the same period in 2022.
Andlauer Healthcare Group Inc.
All currency listed in thousands of Canadian dollars, except for per share data.
Selected highlights from their second quarter 2023 financial results on August 1, 2023
- Revenue of $157,357 for the three months ended June 30, compared to $169,402 for the same period in 2022. An increase of over 7%.
- Net income of $15,716 for the three months ended June 30, compared to net income of $20,985 in the same period in 2022.
- Diluted earnings per ordinary share of $0.37 for the three months ended June 30, compared to earnings of $0.49 per share for the same period in 2022.
- Revenue of $322,131 for the six months ended June 30, compared to $317,753 for the same period in 2022. An increase of over 1%.
- Net earnings of $32,244 for the six months ended June 30, compared to net earnings of $37,456 in the same period in 2022.
- Diluted earnings per ordinary share of $0.76 for the six months ended June 30, compared to earnings of $0.88 per share for the same period in 2022.
Unity Software Inc.
All currency listed in thousands of US dollars, except for per share data.
Selected highlights from their second quarter 2023 financial results on August 2, 2023
- Revenue of $533,478 for the three months ended June 30, compared to $297,043 for the same period in 2022. An increase of almost 80%.
- Net loss of $193,324 for the three months ended June 30, compared to a net loss of $204,158 in the same period in 2022.
- Diluted loss per ordinary share of $0.51 for the three months ended June 30, compared to earnings of $0.69 per share for the same period in 2022.
- Revenue of $1,033,839 for the six months ended June 30, compared to $617,169 for the same period in 2022. An increase of over 67%.
- Net loss of $447,736 for the six months ended June 30, compared to a net loss of $387,779 in the same period in 2022.
- Diluted loss per ordinary share of $1.18 for the six months ended June 30, compared to a loss of $1.29 per share for the same period in 2022.
Innovative Industrial Properties, Inc.
All currency listed in thousands of US dollars, except for per share data.
Selected highlights from their second quarter 2023 financial results on August 2, 2023
- Revenue of $76,457 for the three months ended June 30, compared to $70,511 for the same period in 2022. An increase of over 8%.
- Net income of $41,268 for the three months ended June 30, compared to net income of $40,214 in the same period in 2022.
- Diluted earnings per ordinary share of $1.44 for the three months ended June 30, compared to earnings of $1.42 per share for the same period in 2022.
- Revenue of $152,524 for the six months ended June 30, compared to $135,015 for the same period in 2022. An almost 13%.
- Net earnings of $82,361 for the six months ended June 30, compared to net earnings of $74,588 in the same period in 2022.
- Diluted earnings per ordinary share of $2.87 for the six months ended June 30, compared to earnings of $2.75 per share for the same period in 2022.
PayPal Holdings, Inc.
All currency listed in thousands of US dollars, except for per share data.
Selected highlights from their second quarter 2023 financial results on August 2, 2023
- Revenue of $7,287 for the three months ended June 30, compared to $6,806 for the same period in 2022. An increase of over 7%.
- Net income of $1,029 for the three months ended June 30, compared to a net loss of $341 in the same period in 2022.
- Diluted earnings per ordinary share of $0.92 for the three months ended June 30, compared to a loss of $0.29 per share for the same period in 2022.
- Revenue of $14,327 for the six months ended June 30, compared to $13,289 for the same period in 2022. An increase of almost 8%.
- Net earnings of $1,824 for the six months ended June 30, compared to net earnings of $168 in the same period in 2022.
- Diluted earnings per ordinary share of $1.62 for the six months ended June 30, compared to earnings of $0.14 per share for the same period in 2022.
Ferrari N.V.
All currency listed in thousands of Euros, except for per share data.
Selected highlights from their second quarter 2023 financial results on Aug 2, 2023
- Revenue of $1,473,708 for the three months ended June 30, compared to $1,291,491 for the same period in 2022. An increase of over 14%.
- Net income of $334,399 for the three months ended June 30, compared to net income of $250,572 in the same period in 2022.
- Diluted earnings per ordinary share of $1.83 for the three months ended June 30, compared to earnings of $1.36 per share for the same period in 2022.
- Revenue of $2,902,714 for the six months ended June 30, compared to $2,477,473 for the same period in 2022. An increase of over 17%.
- Net earnings of $631,308 for the six months ended June 30, compared to net earnings of $489,965 in the same period in 2022.
- Diluted earnings per ordinary share of $3.46 for the six months ended June 30, compared to earnings of $2.65 per share for the same period in 2022.
Progeny, Inc
All currency listed in thousands of US dollars, except for per share data.
Selected highlights from their second quarter 2023 financial results on August 3, 2023
- Revenue of $279,373 for the three months ended June 30, compared to $195,004 for the same period in 2022. An increase of over 43%.
- Net income of $14,991 for the three months ended June 30, compared to net income of $8,768 in the same period in 2022.
- Diluted earnings per ordinary share of $0.15 for the three months ended June 30, compared to earnings of $0.09 per share for the same period in 2022.
- Revenue of $537,767 for the six months ended June 30, compared to $367,221 for the same period in 2022. An increase of over 46%.
- Net earnings of $32,669 for the six months ended June 30, compared to net earnings of $13,739 in the same period in 2022.
- Diluted earnings per ordinary share of $0.33 for the six months ended June 30, compared to earnings of $0.14 per share for the same period in 2022.
Amazon.com, Inc
All currency listed in millions of US dollars, except for per share data.
Selected highlights from their second quarter 2023 financial results on August 3, 2023
- Revenue of $134,383 for the three months ended June 30, compared to $121,234 for the same period in 2022. An increase of almost 11%.
- Net income of $6,750 for the three months ended June 30, compared to a net loss of $2,028 in the same period in 2022.
- Diluted earnings per ordinary share of $0.65 for the three months ended June 30, compared to a loss of $0.20 per share for the same period in 2022.
- Revenue of $261,741 for the six months ended June 30, compared to $237,678 for the same period in 2022. An increase of over 10%.
- Net earnings of $9,922 for the six months ended June 30, compared to a net loss of $5,872 in the same period in 2022.
- Diluted earnings per ordinary share of $0.95 for the six months ended June 30, compared to a loss of $0.58 per share for the same period in 2022.
Cloudflare, Inc.
All currency listed in thousands of US dollars, except for per share data.
Selected highlights from their second quarter 2023 financial results on August 3, 2023
- Revenue of $308,494 for the three months ended June 30, compared to $234,517 for the same period in 2022. An increase of almost 32%.
- Net loss of $94,467 for the three months ended June 30, compared to a net loss of $63,537 in the same period in 2022.
- Diluted loss per ordinary share of $0.28 for the three months ended June 30, compared to a loss of $0.20 per share for the same period in 2022.
- Revenue of $598,669 for the six months ended June 30, compared to $446,684 for the same period in 2022. An increase of over 34%.
- Net loss of $132,549 for the six months ended June 30, compared to a net loss of $104,918 in the same period in 2022.
- Diluted loss per ordinary share of $0.40 for the six months ended June 30, compared to a loss of $0.32 per share for the same period in 2022.
BCE Inc.
All currency listed in millions of Canadian dollars, except for per share data.
Selected highlights from their second quarter 2023 financial results on August 3, 2023
- Revenue of $6,066 for the three months ended June 30, compared to $5,861 for the same period in 2022. An increase of over 3%.
- Net income of $397 for the three months ended June 30, compared to net income of $654 in the same period in 2022.
- Diluted earnings per ordinary share of $0.37 for the three months ended June 30, compared to earnings of $0.66 per share for the same period in 2022.
- Revenue of $12,120 for the six months ended June 30, compared to $11,711 for the same period in 2022. An increase of over 3%.
- Net earnings of $1,185 for the six months ended June 30, compared to net earnings of $1,588 in the same period in 2022.
- Diluted earnings per ordinary share of $1.16 for the six months ended June 30, compared to earnings of $1.62 per share for the same period in 2022.
Lightspeed Commerce Inc.
All currency listed in thousands of US dollars, except for per share data.
Selected highlights from their first quarter 2024 financial results on August 3, 2023
- Revenue of $209,086 for the three months ended June 30, compared to $173,882 for the same period in 2022. An increase of over 20%.
- Net loss of $48,703 for the three months ended June 30, compared to a net loss of $100,796 in the same period in 2022.
- Diluted loss per ordinary share of $0.32 for the three months ended June 30, compared to a loss of $0.68 per share for the same period in 2022.
Copperleaf Technologies Inc.
All currency listed in thousands of Canadian dollars, except for per share data.
Selected highlights from their second quarter 2023 financial results on August 3, 2023
- Revenue of $18,504 for the three months ended June 30, compared to $20,584 for the same period in 2022. A decrease of over 10%.
- Net loss of $12,606 for the three months ended June 30, compared to a net loss of $7,303 in the same period in 2022.
- Diluted loss per ordinary share of $0.18 for the three months ended June 30, compared to a loss of $0.11 per share for the same period in 2022.
- Revenue of $38,470 for the six months ended June 30, compared to $36,153 for the same period in 2022. An increase of over 7%.
- Net loss of $24,396 for the six months ended June 30, compared to a net loss of $18,331 in the same period in 2022.
- Diluted loss per ordinary share of $0.34 for the six months ended June 30, compared to a loss of $0.27 per share for the same period in 2022.
Apple Inc.
All currency listed in millions of US dollars, except for per share data.
Selected highlights from their third quarter 2023 financial results on August 3, 2023
- Revenue of $81,797 for the three months ended June 30, compared to $82,959 for the same period in 2022. A decrease of over 1%.
- Net income of $19,881 for the three months ended June 30, compared to net income of $19,442 in the same period in 2022.
- Diluted earnings per ordinary share of $1.26 for the three months ended June 30, compared to earnings of $1.20 per share for the same period in 2022.
- Revenue of $293,787 for the nine months ended June 30, compared to $304,182 for the same period in 2022. A decrease of over 3%.
- Net income of $74,039 for the nine months ended June 30, compared to net income of $79,082 in the same period in 2022.
- Diluted earnings per ordinary share of $4.67 for the nine months ended June 30, compared to earnings of $4.82 per share for the same period in 2022.
Liberty Media Corporation (Formula 1 Group)
All currency listed in millions of US dollars, except for per share data.
Selected highlights from their second quarter 2023 financial results on Aug 4, 2023
- Revenue of $724 for the three months ended June 30, compared to $744 for the same period in 2022. A decrease of almost 3%.
- Net income of $116 for the three months ended June 30, compared to net income of $111 in the same period in 2022.
- Diluted earnings per ordinary share of $0.41 for the three months ended June 30, compared to earnings of $0.35 per share for the same period in 2022.
- Revenue of $1,105 for the six months ended June 30, compared to $1,104 for the same period in 2022. An increase of less than 1%.
- Net earnings of $7 for the six months ended June 30, compared to net earnings of $76 in the same period in 2022.
- Diluted loss per ordinary share of $0.03 for the six months ended June 30, compared to earnings of $0.29 per share for the same period in 2022.
FuboTV Inc.
All currency listed in thousands of US dollars, except for per share data.
Selected highlights from their second quarter 2023 financial results on August 4, 2023
- Revenue of $312,735 for the three months ended June 30, compared to $222,072 for the same period in 2022. An increase of almost 41%.
- Net loss of $54,209 for the three months ended June 30, compared to a net loss of $116,274 in the same period in 2022.
- Diluted loss per ordinary share of $0.17 for the three months ended June 30, compared to a loss of $0.63 per share for the same period in 2022.
Telus Corporation
All currency listed in millions of Canadian dollars, except for per share data.
Selected highlights from their second quarter 2023 financial results on August 4, 2023
- Revenue of $4,946 for the three months ended June 30, compared to $4,401 for the same period in 2022. An increase of over 12%.
- Net income of $196 for the three months ended June 30, compared to net income of $498 in the same period in 2022.
- Diluted earnings per ordinary share of $0.14 for the three months ended June 30, compared to earnings of $0.34 per share for the same period in 2022.
- Revenue of $9,910 for the six months ended June 30, compared to $8,683 for the same period in 2022. An increase of over 14%.
- Net earnings of $420 for the six months ended June 30, compared to net earnings of $902 in the same period in 2022.
- Diluted earnings per ordinary share of $0.29 for the six months ended June 30, compared to earnings of $0.62 per share for the same period in 2022.
Portfolio 2
Portfolio 2 for the week ended August 4, 2023: DOWN ![]()
- Telus (TSX: T) announced they have become the official Canadian security breach response provider for consumer cybersecurity specialist Norton. Telus will provide services to companies that need assistance planning for and responding to security and data breaches.
- Guardant Health (NASD: GH) came to an agreement with Illumina Inc. (NASD: ILMN), that resolved their pending litigation and promotes a shared resolution to advance both companies’ long-term interests. The two companies will share specimens to improve cancer research.
- Last week TC Energy (TSX: TRP) declared a force majeure, or act of god, when an unforeseen incident along interstate 81 Virginia ruptured one of their pipelines, leading to a pressure loss. This past week TC Energy replaced the affected section and began re-pressurizing the pipeline. The impacted pipeline system will run with lower pressure and other risk mitigation measures, while the impacted pipeline segment will remain closed until it Is safe to re-open it.
- Canadian Natural Resources Ltd (TSX: CNQ) said it expects the newly expanded Trans Mountain Expansion (TMX) pipeline to request Alberta oil producers to start filling the new pipeline as early as this month. CNQ plans to ship 94,000 barrels per day (bpd) through the pipeline. At full capacity, the TMX will be able to ship an additional 590,000 bpd. This is good for both parties and Canada.
Activity
No significant activity to report this week.
Dividends
Dividends Received this week for the following companies:
Companies followed by DRIP (Dividend Re-Investment Plan) indicate additional shares were purchased with the dividend. Any cash leftover was added to the cash balance.
Canadian $
TC Energy Corp (TSX: TRP)
Bank of Nova Scotia (TSX: BNS)
US $
No US$ dividends this past week.
Quarterly Reports
Fortis Inc.
All currency listed in millions of Canadian dollars, except for per share data.
Selected highlights from their second quarter 2023 financial results on Aug 2, 2023
- Revenue of $2,594 for the three months ended June 30, compared to $2,487 for the same period in 2022. An increase of over 4%.
- Net income of $346 for the three months ended June 30, compared to net income of $330 in the same period in 2022.
- Diluted earnings per ordinary share of $0.61 for the three months ended June 30, compared to earnings of $0.59 per share for the same period in 2022.
- Revenue of $5,913 for the six months ended June 30, compared to $5,322 for the same period in 2022. An increase of over 11%.
- Net earnings of $830 for the six months ended June 30, compared to net earnings of $723 in the same period in 2022.
- Diluted earnings per ordinary share of $1.51 for the six months ended June 30, compared to earnings of $1.33 per share for the same period in 2022.
Chorus Aviation Inc.
All currency listed in thousands of Canadian dollars, except for per share data.
Selected highlights from their second quarter 2023 financial results on Aug 3, 2023
- Revenue of $396,775 for the three months ended June 30, compared to $392,343 for the same period in 2022. An increase of over 1%.
- Net income of $20,318 for the three months ended June 30, compared to a net loss of $40,403 in the same period in 2022.
- Diluted earnings per ordinary share of $0.05 for the three months ended June 30, compared to a loss of $0.24 per share for the same period in 2022.
- Revenue of $812,027 for the six months ended June 30, compared to $734,723 for the same period in 2022. An increase of over 10%.
- Net earnings of $52,337 for the six months ended June 30, compared to a net loss of $17,496 in the same period in 2022.
- Diluted earnings per ordinary share of $0.16 for the six months ended June 30, compared to a loss of $0.13 per share for the same period in 2022.
Canadian Natural Resources Limited
All currency listed in millions of Canadian dollars, except for per share data.
Selected highlights from their second quarter 2023 financial results on Aug 3, 2023
- Revenue of $7,890 for the three months ended June 30, compared to $11,475 for the same period in 2022. A decrease of over 31%.
- Net income of $1,463 for the three months ended June 30, compared to net income of $3,502 in the same period in 2022.
- Diluted earnings per ordinary share of $1.32 for the three months ended June 30, compared to earnings of $3.00 per share for the same period in 2022.
- Revenue of $16,520 for the six months ended June 30, compared to $22,152 for the same period in 2022. A decrease of over 25%.
- Net earnings of $3,262 for the six months ended June 30, compared to net earnings of $6,603 in the same period in 2022.
- Diluted earnings per ordinary share of $2.94 for the six months ended June 30, compared to earnings of $5.63 per share for the same period in 2022.
iA Financial Corporation Inc.
All currency listed in millions of Canadian dollars, except for per share data.
Selected highlights from their second quarter 2023 financial results on Aug 3, 2023
- Revenue of $1,376 for the three months ended June 30, compared to $1,250 for the same period in 2022. An increase of over 10%.
- Net income of $204 for the three months ended June 30, compared to net income of $152 in the same period in 2022.
- Diluted earnings per ordinary share of $1.89 for the three months ended June 30, compared to earnings of $1.41 per share for the same period in 2022.
- Revenue of $2,735 for the six months ended June 30, compared to $2,480 for the same period in 2022. A decrease of over 10%.
- Net earnings of $477 for the six months ended June 30, compared to net earnings of $138 in the same period in 2022.
- Diluted earnings per ordinary share of $4.48 for the six months ended June 30, compared to earnings of $1.17 per share for the same period in 2022.
Guardant Health, Inc.
All currency listed in thousands of US dollars, except for per share data.
Selected highlights from their second quarter 2023 financial results on Aug 3, 2023
- Revenue of $137,150 for the three months ended June 30, compared to $109,144 for the same period in 2022. An increase of almost 26%.
- Net loss of $72,771 for the three months ended June 30, compared to a net loss of $229,432 in the same period in 2022.
- Diluted loss per ordinary share of $0.67 for the three months ended June 30, compared to a loss of $2.25 per share for the same period in 2022.
- Revenue of $265,864 for the six months ended June 30, compared to $205,243 for the same period in 2022. An increase of over 29%.
- Net loss of $206,304 for the six months ended June 30, compared to a net loss of $352,660 in the same period in 2022.
- Diluted loss per ordinary share of $1.95 for the six months ended June 30, compared to a loss of $3.46 per share for the same period in 2022.
Airbnb, Inc.
All currency listed in millions of US dollars, except for per share data.
Selected highlights from their second quarter 2023 financial results on Aug 3, 2023
- Revenue of $2,484 for the three months ended June 30, compared to $2,104 for the same period in 2022. An increase of over 18%.
- Net income of $650 for the three months ended June 30, compared to net income of $379 in the same period in 2022.
- Diluted earnings per ordinary share of $0.98 for the three months ended June 30, compared to earnings of $0.56 per share for the same period in 2022.
- Revenue of $4,302 for the six months ended June 30, compared to $3,613 for the same period in 2022. An increase of over 19%.
- Net earnings of $767 for the six months ended June 30, compared to net earnings of $360 in the same period in 2022.
- Diluted earnings per ordinary share of $1.15 for the six months ended June 30, compared to earnings of $0.53 per share for the same period in 2022.
Telus Corporation
See report under Portfolio 1.
Hammond Power Solutions
All currency listed in thousands of Canadian dollars, except for per share data.
Selected highlights from their second quarter 2023 financial results on August 4, 2023
- Revenue of $172,451 for the three months ended June 30, compared to $137,476 for the same period in 2022. An increase of over 25%.
- Net income of $13,333 for the three months ended June 30, compared to net income of $6,505 in the same period in 2022.
- Diluted earnings per ordinary share of $1.12 for the three months ended June 30, compared to earnings of $0.55 per share for the same period in 2022.
- Revenue of $343,585 for the six months ended June 30, compared to $265,258 for the same period in 2022. An increase of over 29%.
- Net earnings of $29,059 for the six months ended June 30, compared to net earnings of $15,074 in the same period in 2022.
- Diluted earnings per ordinary share of $2.44 for the six months ended June 30, compared to earnings of $1.27 per share for the same period in 2022.
Brookfield Renewable Partners L.P.
All currency listed in millions of US dollars, except for per share data.
Selected highlights from their second quarter 2023 financial results on August 4, 2023
- Revenue of $1,205 for the three months ended June 30, compared to $1,274 for the same period in 2022. A decrease of over 5%.
- Net income of $151 for the three months ended June 30, compared to net income of $122 in the same period in 2022.
- Diluted loss per ordinary share of $0.10 for the three months ended June 30, compared to a loss of $0.03 per share for the same period in 2022.
- Revenue of $2,536 for the six months ended June 30, compared to $2,410 for the same period in 2022. An increase of over 5%.
- Net earnings of $328 for the six months ended June 30, compared to net earnings of $155 in the same period in 2022.
- Diluted loss per ordinary share of $0.20 for the six months ended June 30, compared to a loss of $0.19 per share for the same period in 2022.
Portfolio 3
Portfolio 3 for the week ended August 4, 2023: DOWN ![]()
- Lithium Americas (TSX: LAC) shareholders approved the plan to divide the company into two lithium producing companies. One will operate in the North American market to take advantage of Canadian and US government programs. The other company will operate out of Argentina and will look for global opportunities.
- Britain’s competition regulator, the Competition and Markets Authority (CMA), is investigating Cameco and Brookfield Renewable Partners’ (TSX: BEP.UN) $7.9 billion deal to acquire Westinghouse Electric, a nuclear power plant equipment maker. According to Cameco this is standard procedure for deals of this nature. Once the deal closes Cameco would own 49% of Westinghouse, with Brookfield and its partners controlling the rest.
- Brookfield Asset Management (TSX: BAM) is teaming up with India’s Reliance Industries to investigate opportunities in Australia to manufacture renewable energy and decarbonisation equipment.
Activity
No significant activity to report this week.
Dividends
Dividends Received this week for the following companies:
Companies followed by DRIP (Dividend Re-Investment Plan) indicate additional shares were purchased with the dividend. Any cash leftover was added to the cash balance.
Canadian $
Toronto-Dominion Bank (TSX: TD)
US $
No US$ dividends this past week.
Quarterly Reports
Unity Software Inc.
See report under Portfolio 1.
Shopify Inc.
All currency listed in millions of US dollars, except for per share data.
Selected highlights from their second quarter 2023 financial results on Aug 2, 2023
- Revenue of $1,694 for the three months ended June 30, compared to $1,295 for the same period in 2022. An increase of almost 31%.
- Net loss of $1,311 for the three months ended June 30, compared to a net loss of $1,204 in the same period in 2022.
- Diluted loss per ordinary share of $1.02 for the three months ended June 30, compared to a loss of $0.95 per share for the same period in 2022.
- Revenue of $3,202 for the six months ended June 30, compared to $2,499 for the same period in 2022. An increase of over 28%.
- Net earnings of $1,243 for the six months ended June 30, compared to net earnings of $2,678 in the same period in 2022.
- Diluted loss per ordinary share of $0.97 for the six months ended June 30, compared to a loss of $2.12 per share for the same period in 2022.
Cloudflare, Inc.
See report under Portfolio 1.
Telus International Inc.
All currency listed in millions of Canadian dollars, except for per share data.
Selected highlights from their second quarter 2023 financial results on Aug 4, 2023
- Revenue of $667 for the three months ended June 30, compared to $624 for the same period in 2022. An increase of almost 7%.
- Net loss of $7 for the three months ended June 30, compared to net income of $56 in the same period in 2022.
- Diluted loss per ordinary share of $0.03 for the three months ended June 30, compared to earnings of $0.21 per share for the same period in 2022.
- Revenue of $1,353 for the six months ended June 30, compared to $1,1223 for the same period in 2022. An increase of almost 11%.
- Net earnings of $7 for the six months ended June 30, compared to net earnings of $90 in the same period in 2022.
- Diluted earnings per ordinary share of $0.03 for the six months ended June 30, compared to earnings of $0.33 per share for the same period in 2022.
Brookfield Renewable Partners L.P.
See report under Portfolio 2.