
Paying to Play: What Nvidia and AMD’s China Access Means for Investors
The Trump administration has struck a highly unusual deal with Nvidia (NASD: NVDA) and AMD (NASD: AMD) to sell certain artificial intelligence (AI) chips to China – Nvidia’s H20 and AMD’s MI308 – the companies must hand over 15% of those sales to the US government. In return, they get the export licenses needed to ship the chips to China. This effectively reopens a market that had been closed off under earlier restrictions.
While it might sound like a simple trade-off – a cut for the US, access for the companies – it sets a dangerous precedent:
1. Mixing security with money.
Export controls are meant to keep sensitive technology out of the wrong hands, not raise revenue. Linking approval to a 15% payout turns a national security decision into a business deal – and risks making US policy look like it’s for sale.
2. A possible blueprint for other industries.
If this becomes normal, any company – in aerospace, pharmaceuticals, or defence – could be told to “pay up” for the right to export. That turns global market access into a government toll booth.
3. A legal minefield.
The US Constitution bans export taxes unless Congress approves them. While this is being called a “license fee,” legal experts say it looks and acts like an export tax, which could spark court challenges and messy reversals.
4. Asking for retaliation.
Other countries, including China, could respond with their own “license fees” on US companies, leading to a tit-for-tat trade fight – and no one wins in trade wars.
5. More uncertainty for global business.
Companies plan years ahead based on stable rules. If export permissions can be negotiated deal-by-deal with the president, it creates unpredictability – a real risk for industries like AI chips with global supply chains.
For Nvidia and AMD, this might feel like a win compared to being locked out of China entirely, but the long-term costs to policy stability, legal clarity, and global trade norms could be much higher.
For us investors, the takeaway is clear: this deal shows how political decisions can change a company’s fortunes overnight – for better or worse. Nvidia and AMD regained access to a massive market, but at the cost of a permanent cut to their sales revenues. It’s a reminder that stock prices don’t just move on earnings and product launches – they also react to government policy, trade agreements, and geopolitical tensions. For investors, keeping an eye on the political landscape is just as important as following quarterly results.
And while this “pay-to-play” deal grabbed early headlines last week, it wasn’t the only story shaping the markets. Fresh US inflation data and retail sales figures offered a glimpse of how tariffs are filtering through the economy and affecting consumer and investor sentiment. Let’s take a look at what else moved the markets – and what it could mean for us going forward. 😊
Items that may only interest or educate me ….
Canadian Economic news, US Economic news
Canadian Economic news
This past week’s key economic data that the Bank of Canada (BoC) considers when deciding whether to raise or lower the interest rate.
Bank of Canada minutes
The Bank of Canada held its key policy rate steady at 2.75% during its late July meeting, signaling a cautious approach as it balances tariffs, inflation, and economic momentum. The minutes reveal a split among policymakers: some believe the rate cuts since June 2024 may already be enough to support the economy through the shock of tariffs, while others feel additional easing could be needed if growth slows further.
Tariffs are on the Bank’s radar, but they aren’t yet a crisis. So far, US tariffs have had a modest impact on consumer prices, and inflation expectations remain anchored. That said, the BoC noted that rising underlying inflation and ongoing trade disruptions keep risks elevated. Officials considered several scenarios – tariffs staying the same, de-escalating, or escalating – and while none triggered a sharp inflation spike yet, the uncertainty has policymakers on alert.
For now, the Canadian economy is holding up. Despite falling exports and trade tensions, business spending, consumer demand, and employment remain stable. Still, upcoming inflation and labour market data will be closely watched, as they will guide the Bank’s next move ahead of the September 17 decision.
In short, the BoC isn’t signaling immediate rate cuts, but it hasn’t ruled them out. If inflation continues to ease and economic growth softens, rate reductions could come later this year.
Canadian Market Volatility
Canada’s volatility gauge, the S&P/TSX 60 Volatility Index (VIXC), started the week at 10.33 but spiked into the 11.4 range as jitters over US inflation rippled through markets. Once the latest US CPI report landed in line with expectations, the tension eased and the VIXC drifted between 10.8 and 10.1 before dropping to 9.88 at the end of the trading session – a calm finish to a choppy few days.
Think of the VIXC like a “fear gauge” for the Canadian stock market. When investors feel uneasy, often due to uncertainty or sudden news, this index ticks higher. Lower numbers, like where it ended the week, signal calmer sentiment. It’s a helpful snapshot of market mood, especially for anyone new to investing.
US Economic news
This past week’s key data points that the Federal Reserve (Fed) considers when deciding whether to raise or lower the interest rate.
Consumer Price Index (CPI)
The latest inflation report from the Bureau of Labor Statistics (BLS) gave investors a reason to smile. Headline CPI, which tracks the cost of everything from groceries to gas, rose 0.2% in July, matching expectations after June’s 0.3% bump. On a yearly basis, prices climbed 2.7%, slightly cooler than analysts’ 2.8% forecast.
Energy prices were a mixed bag: fuel oil (for home heating) jumped 1.8%, while gasoline prices dropped 2.2% in July and is now down 9.5% over the past year. Utility (piped) gas service remained stubbornly high, up 13.8% year-over-year.
The biggest weight keeping inflation elevated were Shelter costs. Rent and homeowner expenses ticked up another 0.2% last month, pushing the annual rise to 3.7%, just a hair lower than June.
Core CPI, which strips out the more volatile food and energy components, rose 0.3% in July, the largest monthly increase in six months. Year-over-year, core inflation came in at 3.1%, hotter than the expected 3.0% and up from June’s 2.9%.
For investors, this was “good enough.” The S&P 500 (S&P) hit a record high as traders now see a September Fed rate cut as highly likely. Lower rates mean cheaper borrowing for companies and consumers – and that’s a tailwind for stocks.
Retail Sales
The latest US Census Bureau retail sales report showed consumer spending cooled in July, with headline sales rising 0.5% after a stronger 0.9% gain in June (revised upward). On a year-over-year basis, sales climbed 3.9%, matching June’s pace and analysts’ expectations.
The standout monthly gain came from motor vehicle and parts dealers, up 1.6%, while miscellaneous retailers saw the steepest monthly drop at 1.7%. Over the past year, spending at miscellaneous retailers jumped 10.6%, while gasoline stations posted the largest decline, falling 2.9%.
Core retail sales, which exclude autos, parts, and gasoline, rose just 0.2% in July, slowing sharply from June’s revised 0.6% increase. Year over year, core sales gained 4.4%, slightly above June’s 4.1%.
While consumer demand remains resilient, momentum has clearly eased from early summer. A sizable portion of the gain may reflect higher prices on imported goods due to tariffs, rather than stronger buying activity. Discretionary categories like dining and electronics saw signs of pullback, suggesting that rising costs are eating into household budgets.
Tariff concerns may also be influencing the timing of purchases. If shoppers anticipated higher prices once tariffs took effect on August 7, many may have accelerated buying in June and July – a “pull forward” effect that often precedes tax hikes or cost increases. While that can temporarily boost sales, it often sets the stage for softer demand in the months that follow. If that’s the case here, the summer’s strength could give way to a cooler autumn for retail.
Consumer Sentiment Index (CSI)
American consumer sentiment appears to have lost the upward momentum seen in July, according to the University of Michigan’s preliminary August reading. The index fell to 58.6, below expectations of 62.0 and down 5% from July’s 61.7. This marks the first decline in four months, reflecting growing unease among American consumers. Year over year, sentiment is down 13.7%, signaling a significant drop in confidence compared to last August. Overall sentiment is still far below the 101 seen before the pandemic, suggesting the US economy is unlikely to accelerate anytime soon.
The decline came from both sides of the index. The Current Conditions Index, which gauges how people feel about their personal finances and the economy right now, dropped 10.4%, from 68.0 in July to 60.9 in August, and is down slightly (0.7%) from a year ago. This points to reduced confidence about the present, likely influenced by rising prices and economic uncertainties.
The Expectations Index, which looks ahead six months, slipped slightly to 57.2 from July’s 57.7, but is down more than 20% from a year ago. While the monthly drop is modest, it highlights caution about the future, with inflation and job security concerns weighing on outlooks.
Consumers remain focused on rising prices and job security. Both short- and long-term inflation expectations increased, while buying conditions for durable goods fell sharply – a sign that higher prices are making shoppers hesitant to commit to big-ticket purchases. This softer sentiment suggests the public is bracing for costlier times ahead. Even if spending hasn’t yet declined, these mood shifts can serve as an early warning of a slowdown in consumer spending, which drives much of the US economy. Softer sentiment often precedes weaker retail sales, slower economic growth, and potentially lower corporate earnings. For investors, it signals that sectors tied to consumer demand – like retail, autos, and discretionary goods – could face pressure in the months ahead.
American Market Volatility
Wall Street’s “fear gauge” – the CBOE Volatility Index (VIX) – started the week at 15.81 and crept up to 16.5 as traders braced for the latest consumer inflation data (CPI). When the report matched expectations, nerves eased and the VIX slid below 15.5, touching 14.5. But a hotter-than-expected producer price index (PPI) report, which tracks the costs businesses pay for the materials needed to make their products and can foreshadow consumer prices, sent it back above 15 before where it closed the week at 15.09.
If you’re new to the VIX, think of it as a real-time pulse check on investor anxiety. It tends to spike when markets get rattled – whether from geopolitical flare-ups, inflation surprises, or something like the Fed chair getting unexpectedly replaced. When fear rises, so does the VIX.
A reading between 12 and 20 suggests calm conditions. Once it pushes past 20, traders start bracing for bigger swings. The higher it climbs, the more uncertainty is being priced into the market.
Weekly Market and Portfolio Review
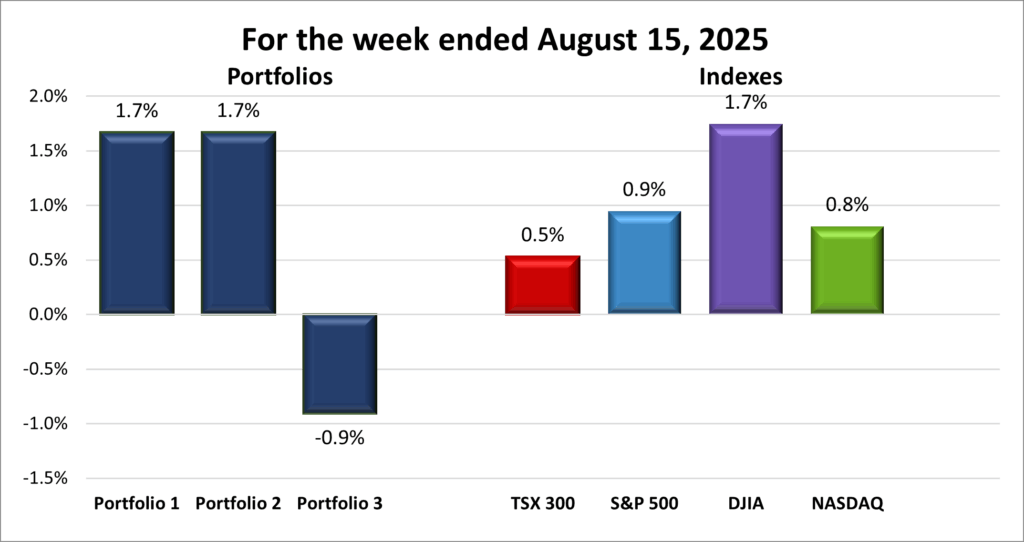
For the week, the TSX (SPTSX) advanced 0.5%, the S&P 500 (SPX) rose 0.9%, the DJIA (INDU) jumped 1.7% and the Nasdaq (CCMP) gained 0.8%.
| Index | Weekly Streak |
| TSX: | 2 – week winning streak |
| S&P: | 2 – week winning streak |
| DJIA: | 2 – week winning streak |
| Nasdaq: | 2 – week winning streak |
![]() It was another strong week in the markets, with the Toronto Stock Exchange Composite Index (TSX), S&P, and Nasdaq Composite Index (Nasdaq) setting multiple record highs. The S&P posted a three-day mid-week winning streak, while the Dow Jones Industrial Average (DJIA) came close to a new peak.
It was another strong week in the markets, with the Toronto Stock Exchange Composite Index (TSX), S&P, and Nasdaq Composite Index (Nasdaq) setting multiple record highs. The S&P posted a three-day mid-week winning streak, while the Dow Jones Industrial Average (DJIA) came close to a new peak.
Trade tensions eased slightly after the US extended its tariff truce with China for another 90 days, reducing fears of an immediate escalation. Still, ongoing negotiations over tariffs and trade policy continued to shape investor sentiment.
In a move seen as setting a risky precedent, President Trump announced that Nvidia and AMD could sell AI-specific chips to China, provided the US government receives 15% of the revenue. Critics warned this “pay-to-play” approach could link export approvals to revenue rather than national security.
On the policy front, Trump named loyalist E.J. Antoni as the new BLS commissioner, sparking concern that the agency’s reputation as a politically independent “gold standard” for economic data could be at risk.
Economic data released during the week painted a mixed picture. The Consumer Price Index (CPI), which measures the average change in prices paid by urban consumers, suggested consumer inflation remains moderate. Core CPI increased at its fastest pace since the start of the year. Investors initially cheered, focusing on the headline number and ignoring the underlying numbers, sending markets higher, especially technology heavyweights that have been driving market gains since October 2023. But that momentum faltered with the release of the Producer Price Index (PPI), which tracks changes in prices paid by domestic producers. PPI came in well above expectations, and on an annual basis it rose the most since February 2025. Core PPI, which strips out the volatile food and energy components, recorded its biggest gain since 2022, signaling rising inflationary pressures at the wholesale level.
While CPI shows consumer prices are stable for now, the PPI suggests businesses are facing higher input costs – partly due to tariffs – that could eventually reach consumers. Adding to the complexity, July retail sales slowed, hinting that higher prices may be weighing on discretionary spending. On a yearly basis, however, sales are still solid. Meanwhile, American consumer sentiment dipped in August for the first time in four months, reflecting concerns over prices, job security, and the economic outlook. Together, the data tempered hopes for a September Fed rate cut, though most analysts still expect one.
The Fed now faces a difficult choice: cut rates to support growth and risk fueling inflation or keep rates high and risk slowing the economy further. Rising inflation alongside cooling growth and employment leaves little room for error.
In Canada, it was another positive week for the TSX, as investors weighed economic data (mainly from the US), BoC minutes, and trade headlines. Optimism over the 90-day US–China tariff truce supported sentiment. At home, in the BoC meeting minutes, the governors noted that while US tariffs have so far had only a modest effect on Canadian consumer prices, ongoing trade uncertainty could threaten both inflation and business investment.
Overall, it was a week of record highs, easing trade tensions, and inflation surprises, leaving investors upbeat but cautious as markets extended their gains for another week.
| Portfolio | Weekly Streak |
| Portfolio 1: | 2 – week winning streak |
| Portfolio 2: | 2 – week winning streak |
| Portfolio 3: | 1 – week losing streak |
![]()
![]() With the flurry of record highs across the major indexes this week, I expected my three portfolios to post stronger gains, but the results were a bit more mixed.
With the flurry of record highs across the major indexes this week, I expected my three portfolios to post stronger gains, but the results were a bit more mixed.
Portfolio 1 delivered a respectable 1.7% gain for the week, matching the DJIA, the top performer of the indexes. A solid 62% of its holdings finished higher, powered by a 19% jump in Sea Limited (NYSE: SE) after a string second quarter earnings report, and an 11% rise in indie Semiconductor (NASD: INDI). Celestica (TSE: CLS) also notched yet another all-time high. I really wished I bought more Celestica when the share price dropped in April. ☹
Portfolio 2 kept pace with Portfolio 1, also gaining 1.7%, with two-thirds of its holdings finishing in the green. While no single stock stole the spotlight, weakness in energy names, held back by lower oil prices, put a lid on what could have been stronger gains.
Portfolio 3 was the lone laggard, dipping 0.9%. Just half of its holdings finished higher, while pullbacks in its three biggest positions – Nvidia, Shopify (TSE: SHOP), and Microsoft (NASD: MSFT) – weighed heavily. This portfolio tends to soar when its heavyweights are firing, but when two or more stumble in the same week, the impact is hard to miss. ☹
Not the clean sweep I was hoping for, but as Meat Loaf once sang, “Two out of three ain’t bad.” 😊 Here’s to Portfolio 3 bouncing back next week and the other two keeping their winning streaks alive.
Companies on the Radar
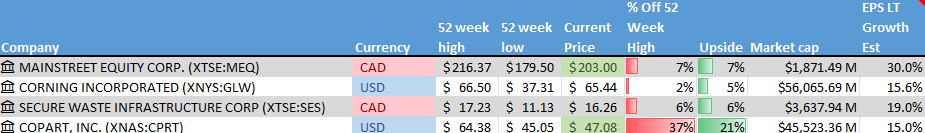
 One new name just popped onto my radar this week – Corning Incorporated (NYSE: GLW). I was digging for companies that could ride the AI wave indirectly when I stumbled across them. Like most people, I knew Corning as “the glass company,” but that’s an outdated view. Today, they’re a leader in specialty glass, optical fiber, environmental technology, life sciences, and other specialty glasses.
Their sales have nearly doubled on the back of soaring demand for high-capacity fiber optic cable in AI – powered data centres. And their Apple connection runs deep. Corning has supplied iPhone glass since 2007. Now, Apple (NASD: AAPL) is doubling down, investing $2.5 billion in a new Kentucky facility that will make Corning the sole US producer of iPhone and Apple Watch cover glass.
Corning is the kind of technology/legacy company I love – an established brand finding new life through innovation and strategic partnerships. Between their Apple deal and the AI-driven fiber optic boom, there’s a lot of optionality here, and I’m looking forward to digging deeper.
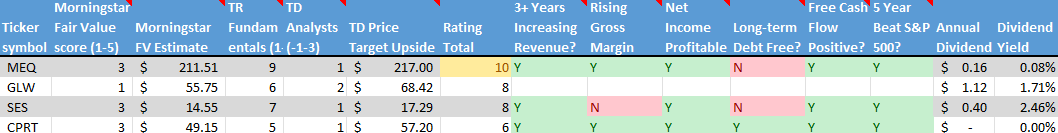
Corning now joins the three other companies currently on my radar list:
- Mainstreet Equity Corp. (TSE: MEQ): a Calgary-based real estate company focused on mid-market apartment buildings – typically under 100 units – across Western Canada. It buys underperforming properties at below-market prices, renovates them, and increases rental income through improved operations. With strong demand for rental housing, a repeatable value-add strategy, and a solid balance sheet, Mainstreet offers a compelling mix of income and growth. Shares currently trade below net asset value, giving investors a margin of safety alongside steady cash flow and long-term upside.
- Secure Energy Services (TSE: SES): a Canadian industrial company that focuses on environmental and waste management services for energy and industrial clients. It offers recycling, disposal, and infrastructure support across North America.
- Copart (NASD: CPRT): this American company runs one of the world’s largest online vehicle auction platforms, specializing in salvage cars from accidents and natural disasters. It sells on behalf of insurers, dealerships, rental companies, and individuals. Copart earns revenue through transaction fees, storage, transportation, and listing services. Its digital model, global buyer network, and asset-light approach support strong margins and steady growth. With no long-term debt and rising tailwinds from vehicle values and insurance claims, it’s a steady growth story that’s earned a spot on my radar.
As always, these are not buy recommendations. Make sure to do your own research and choose investments that fit your personal financial goals.
The Radar Check was last updated August 15, 2025.
That’s a wrap for this week, thanks for reading – may your portfolio stay green and your dividends steady. See you next time!