Items that may only interest or educate me ….
Canadian Economic news, US Economic news, Debt and Interest rates…
It was a slow week for US economic reports, so I decided to explain the reports I will be covering on a regular basis going forward, and why I chose them. If you are interested, please check out Key Economic Data in the Commentary section.
Now, on to our regularly scheduled items that may interest me ….
Canadian Economic news
Inflation news
Canada’s annual inflation rate for July, as measured by the Consumer Price Index (CPI), surged to 3.3%, up from 2.8% in June. This was higher than analysts’ expectations of 3.0%.
The CPI tracks the prices of a basket of goods and services that are commonly purchased by Canadians. The biggest increases in July were in the food component, which surged by 7.8%, and the health and personal care component, which climbed by 5.8%. Conversely, the gas subcomponent had the largest decline, plummeting 12.9%.
On a monthly basis, the CPI was up 0.6% in July, accelerating from June’s 0.1% increase. This was also higher than analysts’ expectations of 0.3%. The biggest increases were in the recreation, education and reading component, up 2.1%, and the fuel components, up 0.9%, while the biggest decrease was in the clothing component, down 1.0%.
The headline CPI, encompassing all components and providing a comprehensive view of overall inflation trends, beat expectations with a notable upswing. However, the core CPI, which excludes the food and energy segments, maintained a steadier trajectory, edging up by 3.4% on a yearly basis and an increase of 0.6% from June.
While the elevation in headline CPI might raise concerns, the Bank of Canada (BoC) will be pleased to see their preferred metric, core CPI, was essentially flat on a monthly basis. Analysts are split on whether the BoC will opt for another rate hike to drive down inflation faster or maintain the benchmark rate at its upcoming meeting in September. Either way, the BoC will be closely monitoring the data in the next few weeks to determine if they need to take action to keep inflation trending downward.
Industrial and raw materials price indexes
The Industrial Product Price Index (IPPI) and the Raw Materials Price Index (RMPI) provide a glimpse into the price movements of industrial products and raw materials, reflecting economic trends and dynamics that influence various sectors and industries. The IPPI data for July showed product prices rebounded by 0.4% from a prior drop of 0.6% in June. Looking at the broader picture, the annual trend reveals a decrease of 2.7% in prices. When energy and petroleum products are omitted from the IPPI calculation, the index remains unchanged from June, despite an annual increase of 0.5% in prices.
On a monthly basis, the lumber and other wood products, as well as energy and petroleum products, had the biggest price increases of the twenty one IPPI sectors. Conversely, chemicals and chemical products, along with primary ferrous metal products, had the largest monthly declines.
On an annual basis, the largest price gains were in sectors like cement, glass, and other non-metallic mineral products, as well as tobacco products. Conversely, energy and petroleum products, along with lumber and other wood products, suffered the largest annual price decreases.
Shifting to the Raw Materials Price Index (RMPI) for July, the prices for raw materials experienced growth of 3.5% in June, while dropping 11.1% compared on an annual basis. When energy products are removed from the RPMI calculation, prices recorded a monthly uptick of 1% and a yearly increase of 0.7%.
On a monthly basis, crude energy products increased the most of the seven RMPI sectors, while logs, pulpwood, natural rubber and other forestry products was the only sector to see a decline in prices.
Taking a broader view on an annual basis, the biggest increase was in the animals and animal products sector, while the crude energy products sector declined the most on a yearly basis.
US Economic news
FOMC minutes
During their most recent meeting in late July, the Federal Open Market Committee (FOMC) of the Federal Reserve (Fed) decided to increase the benchmark interest rate for the 11th time within a span of 17 months. This decision was aimed at getting inflation down to their target of 2%. The minutes of that meeting that were released this week reveal that the Fed remains concerned about persistently high inflation and recognizes the potential need for further interest rate hikes. However, they acknowledged some data suggested inflation was falling. This mixed view echoed Fed Chair Jerome Powell’s post meeting comments about future rate hikes.
Although the decision to raise the rate was unanimous among the FOMC’s eleven members, two nonvoting participants from the broader Fed expressed an opposing perspective. These participants argued for maintaining the existing rate rather than implementing an increase.
As the upcoming FOMC meeting approaches, the Fed’s members have displayed varying stances on whether to raise or maintain the current interest rate. Some are of the belief that the benchmark rate has reached a level that can effectively curb economic growth and bring inflation back to the targeted 2%. Conversely, others argue that an additional rate increase is imperative to sustain the ongoing trajectory of decreasing inflation. Regardless of the ultimate decision, the Fed’s choices will be based on the latest economic data and trends. Perhaps the most intriguing aspect of the upcoming meeting will be whether a unanimous decision can be reached on the path forward.
Debt and Interest rates
While reviewing CrowdStrike’s (NASD: CRWD) Form 10-K, I stumbled upon a strong argument against investing in heavily indebted companies. The statement I encountered highlighted the drawbacks of such debt-heavy companies:
“…requiring a portion of our cash flows to be dedicated to debt service payments instead of other purposes, thereby reducing the amount of cash flows available for working capital, capital expenditures, acquisitions and other general corporate purposes.”
When a company has significant debt obligations, a significant portion of its cash flow must be directed towards servicing these debts. This allocation can curtail the availability of funds for essential operational needs, growth initiatives, acquisitions, and other vital aspects of the business.
The statement also highlights the negative impact of rising interest rates on such companies. As interest rates increase, the cost of servicing debt also rises. This not only exacerbates the allocation of cash flows towards debt servicing but can also impede the growth prospects of a company. Elevated interest rates can result in a higher cost of capital, making it more challenging for growing companies to secure funding and pursue expansion opportunities.
I thought this statement was a great reminder of the potential risks associated with investing in companies burdened by significant debt in the current high interest environment. It underlines the importance of carefully evaluating a company’s debt position and financial health before deciding whether to become an owner of a business.
Now, let’s see what happened this past week….
Weekly Market Review
Monday: A good way to start the week for the three American indexes, not so great for the Toronto Stock Exchange Composite Index (TSX). Oil prices slipped as investors worried about lower demand coming out of China.
In Canada, commodity prices dropped on concerns of weak demand from China as the world’s second largest economy struggles with its economic recovery. Investors are waiting for the latest CPI report due later this week to get an idea what the BoC will do with the interest rate at their next meeting in September. In trading, Technology and Industrials were the only Canadian sectors to advance, while Basic Materials (miners and fertilizer manufacturers) and Telecommunications Services had the biggest setbacks.
In the US of A, after sliding for the last week or so, the mega cap technology companies, and technology companies in general, had their best day in a long time helping boost the Nasdaq Composite Index (Nasdaq) higher and the S&P 500 Index (S&P) into positive territory. The Dow Jones Industrial Average (DJIA) ended slightly above the breakeven point, carried by market sentiment. In trading, Technology and Healthcare were the top gainers while Utilities and Energy sank the most.
Tuesday: Weak economic data out of China sent all four indexes sharply lower as investors concerns grow about the world’s second largest economy. In response to their sputtering economy, China’s central bank lowered its key interest rates to jumpstart its economy. As one of the world’s largest consumers of raw materials and exporter of manufactured products, China’s problems can quickly become global problems. In contrast, the US continues to show resilience in retail sales with an increase of 0.7% in July over June, beating expectations of a 0.4% increase. The news out of China did not help oil prices either as investors worried about lower demand.
In Canada, the TSX had its biggest drop since October 2022 as the July CPI report came in higher than expected, sparking concerns the BoC will hike interest rates. All Canadian sectors declined with Consumer Cyclicals and Healthcare falling the least and Basic Materials and Energy falling the furthest.
In the US, the American indexes did not fall as hard as the TSX, but they fell just the same. The retail sales report was stronger than expected leading to speculation interest rates will remain high for longer. Investors are waiting for the release of the minutes from the last Fed’s last policy meeting in July when they raised the interest rate another 0.25%. Analysts will be looking for clues to indicate which way the Fed is leaning heading into their September meeting. Every American sector ended lower, with Healthcare and Telecommunications Services dropping the least and Energy and Basic Materials suffering the biggest declines.
Wednesday: When the best performing index ends flat, you know it has not been a great day. Minutes from the Fed’s last session revealed many members still felt there was upside risk to inflation and were divided on the need for an additional rate increase. With no clear direction on interest rates, fears they could go higher sent the American indexes lower and the TSX marginally lower.
In Canada, the TSX was in positive territory for most of the day before settling slightly below the breakeven bar. The economic slowdown in China continued to weigh on the resource/commodity oriented TSX. Today was good illustration of how dominant sectors can dictate the direction of the overall index. Seven of the ten sectors end higher, yet the TSX still ended in the red. In the Canadian sectors, Technology and Consumer Staples posted the biggest gains, however, the Basic Materials, Telecommunications Services, and Financials were the only sectors to end lower. Basic Materials and Financials account for 45% of the TSX.
In the USA, investors were not only concerned about the possibility of another rate increase but now they are also worried the Fed will hold the rates at the current or higher rate for longer. In the American sectors, only the defensive Utilities sector advanced, all other sectors posted losses with the interest sensitive Consumer Cyclicals and Technology posting the biggest losses.
Thursday: The week just keeps sliding lower as all four major North American indexes once again ended in negative territory. Analysts are now not only debating how high interest rates will go, but how long they will remain elevated. Oil prices rose after China implemented economic measures to stimulate their economy.
In Canada, the bad news is the TSX hit a six-week low. Worse news, September is historically the worst month of the year, so the skid is likely to continue for a while. On Bay Street, the Canadian Energy sector was the lone bright spot, ending in positive territory. Falling the furthest were the interest rate sensitive Technology and Consumer Cyclicals sectors.
In the US, the recent positive economic news has investors spooked that high interest rates will linger longer than originally expected, sending all three indexes lower. On Wall Street, Energy was the only American sector to advance. Consumer Cyclicals and Financials suffered the heaviest losses.
Friday: Stronger than expected US economic news led to a mixed day for the four indexes. The growth-oriented S&P and Nasdaq sank, while the TSX and DJIA advanced. Investors are concerned rates will need to remain high longer than originally anticipated to prevent inflation from reversing its decline and moving upward. Weaker than expected economic news out of China further weighed on the markets. Oil prices climbed on news of lower US production levels.
In Canada, the TSX barely made it into the green today, with higher oil prices overcoming declines in many of the other Canadian sectors. In trading, Utilities and Energy posted the largest gains, while Consumer Staples and Telecommunications Services had the biggest losses.
In the US, declines in the mega cap technology companies dragged the S&P and Nasdaq below the flatline, while the DJIA finished barely above it thanks to gains in the Energy sector. In trading, Energy and Consumer Staples advanced the most, while Consumer Cyclicals and Basic Materials had the biggest drops.
Weekly Market and Portfolio Review
For the week, the TSX (SPTSX) fell 2.9%, the S&P 500 (SPX) declined 2.1%, the DJIA (INDU) sunk 2.2% and the Nasdaq (CCMP) dropped 2.6%.
![]() The rapid shift in market sentiment over the past few weeks has been quite noticeable. What was a summer rally just three weeks ago now seems like a distant memory, as the markets continue to sink. The primary driver behind this shift appears to be the performance of the US economy, the world’s largest. Its persistent strength has raised concerns among investors that the Fed might not only implement another interest rate hike, but also maintain these elevated rates for an extended period.
The rapid shift in market sentiment over the past few weeks has been quite noticeable. What was a summer rally just three weeks ago now seems like a distant memory, as the markets continue to sink. The primary driver behind this shift appears to be the performance of the US economy, the world’s largest. Its persistent strength has raised concerns among investors that the Fed might not only implement another interest rate hike, but also maintain these elevated rates for an extended period.
The optimism that fueled the summer rally has now been replaced by a sense of caution and uncertainty. The concern over higher rates for longer has triggered an upward trajectory in US government bond yields, with 10-year yields inching closer to levels not seen since 2007.
Many investors, having reaped substantial gains in the Technology sector, have taken the opportunity to lock in profits and shifted their money from riskier stocks towards safer investments, like US government bonds. As yields on these risk-free bonds continue to rise, they become an even more attractive option for investors.
Conversely, on the global stage, the Chinese economy, the world’s second largest, is showing signs of a slowdown. The reduction in demand from Chinese consumers and industries, coupled with China’s role as a major supplier of manufactured goods, has raised concerns that this deceleration could potentially exert a drag on other economies. Consequently, many investors are reallocating their investments into safer assets such as …. US government bonds.
As evident from the above graph, the commodity heavy TSX index experienced the largest decline due to the impact of waning demand from China for raw materials. However, there was a silver lining as oil prices managed to edge higher, providing a boost to energy stocks and thereby limiting the overall decline of the index. Among the American sectors, all three major indexes saw declines of over 2%, with the Nasdaq, being particularly sensitive to interest rates, experiencing the biggest fall and its third straight weekly decline. The losses seen in the S&P and DJIA indexes were limited to some extent by gains in the Energy sector. However, the DJIA was additionally weighed down by declines in US bank stocks, a consequence of a credit rating agency suggesting possible credit rating downgrades for several US banks, including some of the larger, well-known ones.
![]() It is like déjà vu all over again for the three Portfolios. While I mentioned this last week, the recurrence of losses over another week has me feeling like I have been transported back to 2022. Last year, the portfolios seemed to be in a constant state of downward drift, and as a result, I became somewhat desensitized to the weekly losses. This year, after the strong bull market performance during the initial seven months, I was optimistic the rally would persist, albeit not as strong as the first half of the year. Consequently, these three consecutive weeks of declines feels worse than last year. ☹
It is like déjà vu all over again for the three Portfolios. While I mentioned this last week, the recurrence of losses over another week has me feeling like I have been transported back to 2022. Last year, the portfolios seemed to be in a constant state of downward drift, and as a result, I became somewhat desensitized to the weekly losses. This year, after the strong bull market performance during the initial seven months, I was optimistic the rally would persist, albeit not as strong as the first half of the year. Consequently, these three consecutive weeks of declines feels worse than last year. ☹
As illustrated in the chart below, Portfolio 1 stands out as the sole portfolio or index to achieve a weekly gain. Considering the overall market trend saw all indexes experiencing drops of over 2%, this unexpected development was certainly a pleasant surprise. The driving force behind Portfolio 1’s performance was Nvidia (NASD: NVDA), which surged by 10% over the week. Portfolios 2 and 3 were more of what I expected, dragged down by the overall markets. Portfolio 2 also felt the sting of drops in the financial sector which took a hit due to concerns surrounding higher interest rates. Lastly, Portfolio 3 faced the biggest losses of the week, largely stemming from Dutch financial payments company Adyen (OTCM: ADYEY) reporting earnings below expectations, leading to a 50% decline in its share price. Unfortunately, most companies faced declines throughout the week, and there was no company to offset the losses caused by Adyen.
Hopefully the losses experienced in the past week will present buying opportunities in the upcoming week and get the markets resuming their upward march. One can only hope for such an outcome, though I have a suspicion that we might be in for a few more weeks of declines. 😊

Companies on the Radar
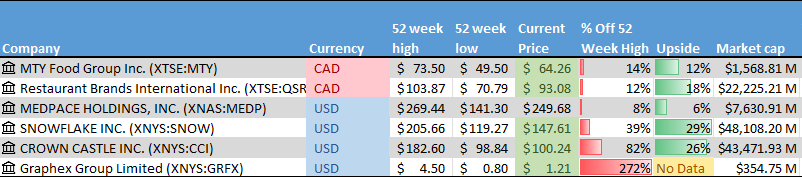
 I removed Kinsale Capital Group, (NYSE: KNSL) and Zoetis Inc. (NYSE: ZTS) from my Radar List because both are in industries I am not that familiar with. This week I added Crown Castle Inc. (NYSE: CCI), a large cap American company that owns and operates cell towers throughout America, along with a fiber optic network supporting those towers. Given the ongoing expansion of mobile communications, Crown Castle sound interesting.
The other company joining the list is Graphex Group Limited (NYSE: GRFX). Headquartered in Hong Kong, Graphex Group is a micro cap company that specializes in the processing and sale of graphite and graphene products. My interest in this company was piqued by the growing demand for graphite in the production of lithium-ion battery anodes, which are needed for the batteries used in EVs. As you can see in the lower table below, when I ran it through my Radar Check it scored very poorly. Suffice to say, it will not be on my Radar List next week.
These companies will join the holdovers from last week:
- MTY Food Group Inc. (TSE: MTY): A small cap Canadian consumer cyclical company that operates and franchises quick service and casual dining restaurants throughout North America and internationally.
- Restaurant Brands International Inc. (TSE: QSR): A large cap Canadian consumer cyclical company that operates in the North American quick serve restaurant industry. The company owns Tim Horton’s, Burger King, and Popeye’s Louisiana Kitchen among others.
- Medpace Holdings, Inc. (NASD: MEDP): A medium cap American healthcare company. The company provides clinical research-based drug and medical device development services to other healthcare companies in the development services.
- Snowflake, Inc. (NYSE: SNOW): A large cap American technology company that provides a data cloud environment that enables customers to consolidate all their databases into a single source to enable better insights.
The Radar Check was last updated August 18, 2023.

Portfolio Update
Portfolio 1
Portfolio 1 for the week ended August 18, 2023: UP ![]()
- Amazon (NASD: AMZN) met with three commissioners of the Federal Trade Commission (FTC) to determine if an anti trust lawsuit can be avoided.
Separately, Amazon Pharmacy will now automatically apply manufacturers’ discount to many insulin and diabetes medications. This will help consumers from trying to find discount coupons and manually entering them when ordering their medications. This should be a great help to consumers. - Tesla (NASD: TSLA) lowered prices in China for their Model Y electric vehicles (EV), lowering margins further. They also announced cheaper version of their Model S and Model X in the US. These latest American versions have shorter driving ranges than their pricier siblings, but Tesla hopes the lower prices will increase overall sales.
In a boost to Tesla, the state of Texas approved a mandate that all EV chargers include Tesla’s EV charging technology. Tesla is slowly becoming the North America charging standard. - ZIM Shipping (NYSE: ZIM) announced that in accordance with its dividend policy that payments will be made on a quarterly basis at a rate of approximately 30% of the net quarterly income, there will be no dividend to shareholders on account of the net loss it recoded for the second quarter. The only reason I have been holding onto ZIM was for the dividend. I will have to rethink that. ☹
Activity
No significant activity to report this week.
Dividends
Dividends Received this week for the following companies:
Companies followed by DRIP (Dividend Re-Investment Plan) indicate additional shares were purchased with the dividend. Any cash leftover was added to the cash balance.
Canadian $
Dream Industrial Real Estate Investment Trust (TSX: DIR.UN)
US $
Apple Inc (NASD: AAPL)
BSR Real Estate Investment Trust (TSX: HOM.U)
Quarterly Reports
Boston Omaha Corporation
All currency listed in of US dollars.
Selected highlights from their second quarter 2024 financial results on August 14, 2023
- Revenue of $24,216,394 for the three months ended June 30, compared to $20,895,016 for the same period in 2022. An increase of almost 16%.
- Net income of $1,541,612 for the three months ended June 30, compared to a net loss of $11,496,339 in the same period in 2022.
- Diluted earnings per ordinary share of $0.05 for the three months ended June 30, compared to a loss of $0.39 per share for the same period in 2022.
- Revenue of $47,032,179 for the six months ended June 30, compared to $37,187,963 for the same period in 2022. An increase of over 73%.
- Net loss of $1,779,542 for the six months ended June 30, compared to net earnings of $4,806,254 in the same period in 2022.
- Diluted loss per ordinary share of $0.06 for the six months ended June 30, compared to earnings of $0.16 per share for the same period in 2022.
Navitas Semiconductor Corporation
All currency listed in thousands of US dollars, except for per share data.
Selected highlights from their second quarter 2024 financial results on August 14, 2023
- Revenue of $18,062 for the three months ended June 30, compared to $8,611 for the same period in 2022. An increase of almost 210%.
- Net loss of $58,527 for the three months ended June 30, compared to net income of $33,837 in the same period in 2022.
- Diluted loss per ordinary share of $0.35 for the three months ended June 30, compared to earnings of $0.26 per share for the same period in 2022.
- Revenue of $31,420 for the six months ended June 30, compared to $15,351 for the same period in 2022. An increase of almost 205%.
- Net loss of $120,893 for the six months ended June 30, compared to net earnings of $113,629 in the same period in 2022.
- Diluted earnings per ordinary share of $0.75 for the six months ended June 30, compared to earnings of $0.87 per share for the same period in 2022.
Cargojet Inc.
All currency listed in millions of Canadian dollars, except for per share data.
Selected highlights from their second quarter 2024 financial results on August 14, 2023
- Revenue of $209.7 for the three months ended June 30, compared to $246.6 for the same period in 2022. A decrease of almost 15%.
- Net income of $31.1 for the three months ended June 30, compared to net income of $169.2 in the same period in 2022.
- Diluted earnings per ordinary share of $1.68 for the three months ended June 30, compared to earnings of $8.20 per share for the same period in 2022.
- Revenue of $441.6 for the six months ended June 30, compared to $480.2 for the same period in 2022. A decrease of over 8%.
- Net earnings of $61.7 for the six months ended June 30, compared to net earnings of $104.6 in the same period in 2022.
- Diluted earnings per ordinary share of $3.32 for the six months ended June 30, compared to earnings of $5.55 per share for the same period in 2022.
SEA Limited
All currency listed in thousands of US dollars, except for per share data.
Selected highlights from their second quarter 2024 financial results on August 15, 2023
- Revenue of $2,942,599 for the three months ended June 30, compared to $3,095,660 for the same period in 2022. A decrease of almost 5%.
- Net income of $1,335.8 for the three months ended June 30, compared to net income of $888.2 in the same period in 2022.
- Diluted earnings per ordinary share of $11.11 for the three months ended June 30, compared to earnings of $7.38 per share for the same period in 2022.
- Revenue of $5,842,170 for the six months ended June 30, compared to $6,136,764 for the same period in 2022. A decrease of almost 5%.
- Net loss of $1,512,920 for the six months ended June 30, compared to net earnings of $409,680 in the same period in 2022.
- Diluted loss per ordinary share of $2.72 for the six months ended June 30, compared to earnings of $0.69 per share for the same period in 2022.
Home Depot, Inc.
All currency listed in millions of US dollars, except for per share data.
Selected highlights from their second quarter 2024 financial results on August 15, 2023
- Revenue of $42,916 for the three months ended June 30, compared to $43,792 for the same period in 2022. A decrease of 2%.
- Net income of $4,659 for the three months ended June 30, compared to net income of $5,173 in the same period in 2022.
- Diluted earnings per ordinary share of $4.65 for the three months ended June 30, compared to earnings of $5.05 per share for the same period in 2022.
- Revenue of $80,173 for the six months ended June 30, compared to $82,700 for the same period in 2022. A decrease of over 3%.
- Net earnings of $8,532 for the six months ended June 30, compared to net earnings of $9,404 in the same period in 2022.
- Diluted earnings per ordinary share of $8.46 for the six months ended June 30, compared to earnings of $9.13 per share for the same period in 2022.
ZIM Integrated Shipping services Ltd.
All currency listed in millions of US dollars, except for per share data.
Selected highlights from their second quarter 2024 financial results on July 16, 2023
- Revenue of $1,309.6 for the three months ended June 30, compared to $3,428.8 for the same period in 2022. A decrease of almost 62%.
- Net loss of $212.7 for the three months ended June 30, compared to net income of $1,335.8 in the same period in 2022.
- Diluted loss per ordinary share of $1.79 for the three months ended June 30, compared to earnings of $11.07 per share for the same period in 2022.
- Revenue of $2,683.9 for the six months ended June 30, compared to $7,145.2 for the same period in 2022. A decrease of over 62%.
- Net loss of $270.8 for the six months ended June 30, compared to net earnings of $3,046.8 in the same period in 2022.
- Diluted loss per ordinary share of $2.29 for the six months ended June 30, compared to earnings of $25.26 per share for the same period in 2022.
Nano-X Imaging Ltd.
All currency listed in thousands of US dollars, except for per share data.
Selected highlights from their second quarter 2024 financial results on August 17, 2023
- Revenue of $2,582 for the three months ended June 30, compared to $2,200 for the same period in 2022. An increase of over 17%.
- Net loss of $17,364 for the three months ended June 30, compared to a net loss of $19,614 in the same period in 2022.
- Diluted loss per ordinary share of $0.31 for the three months ended June 30, compared to a loss of $0.38 per share for the same period in 2022.
- Revenue of $5,029 for the six months ended June 30, compared to $4,008 for the same period in 2022. An increase of over 25%.
- Net loss of $29,125 for the six months ended June 30, compared to a net loss of $43,528 in the same period in 2022.
- Diluted loss per ordinary share of $0.53 for the six months ended June 30, compared to a loss of $0.79 per share for the same period in 2022.
Portfolio 2
Portfolio 2 for the week ended August 18, 2023: DOWN ![]()
- MongoDB (NASD: MDB) announced the general availability of their latest service – MongoDB Queryable Encryption. This technology provides built in protection for sensitive information when it is queried and in use in MongoDB. This capability is key for companies in data sensitive industries such as financial services, healthcare and government.
- Mitek Systems (NASD: MITK) reported they received notice from the Nasdaq Stock Exchange that it was not in compliance with Nasdaq’s continued listing requirements for failing to file its Quarterly report for the quarter ended June 30, 2023. Mitek says they have addressed the issue and presented their plan to become fully compliant.
Activity
Bought SmartCentres Real Estate Investment Trust (TSX: SRU.UN): This is the 2nd purchase of SRU.UN. The initial purchase was made the first week in July for Portfolio 3. I considered adding more shares to the Dream Industrial REIT (TSX: DIR.UN) but wanted some REIT diversification in the portfolio.
The investment was made to generate income from the 7.4% dividend yield. As well, SRU has growth potential as SmartCentres is in the process of converting many of its retail mall properties into multi use town centres that includes rental apartments, condos, townhomes, seniors’ residences, self-storage, offices, retail outlets, hotels and industrial.
Dividends
Dividends Received this week for the following companies:
Companies followed by DRIP (Dividend Re-Investment Plan) indicate additional shares were purchased with the dividend. Any cash leftover was added to the cash balance.
No dividends this past week.
Quarterly Reports
No quarterly reports this past week.
Portfolio 3
Portfolio 3 for the week ended August 18, 2023: DOWN ![]()
- News I do not like to hear, Dutch payments processor Adyen N.V., missed analysts’ first-half earnings estimates and got pummeled by the markets, falling 39% in one day. Ouch! ☹Adyen is Europe’s equivalent of PayPal (NASD: PYPL), a global payment processor providing back-end financial infrastructure for merchants.
- Brookfield Reinsurance (TSX: BNRE) announced it will begin to offer holders of Class A Limited voting shares of Brookfield Corporation (TSX: BN) the opportunity to exchange up to 40 million BN shares for newly issued Brookfield Reinsurance shares on a one-for-one basis. Brookfield Reinsurance and Brookfield Corporation are considered a “paired entity”, which allows the offer to be structured so that the equity base and market capitalization of Brookfield Reinsurance can be enhanced without any dilution to Brookfield Corporation or Brookfield Reinsurance shareholders.
Activity
No significant activity to report this week.
Dividends
Dividends Received this week for the following companies:
Companies followed by DRIP (Dividend Re-Investment Plan) indicate additional shares were purchased with the dividend. Any cash leftover was added to the cash balance.
Canadian $
SmartCentres Real Estate Investment Trust (TSX: SRU.UN) DRIP
US $
No US$ dividends this past week.
Quarterly Reports
Adyen N.V.
All currency listed in thousands of Euros, except for per share data.
Selected highlights from their first half 2023 financial results on August 17, 2023.
Note: Companies whose primary stock exchange resides in Europe, such as Adyen (AMS: ADYEN) on the Amsterdam Stock Exchange, report twice a year as opposed to quarterly as required on North American exchanges.
- Revenue of €853,550 for the first half of 2023 ended June 30, compared to €3,947,481 for the same period in 2022. A decrease of over 78%.
- Net income of €282,173 for the first half of 2023 ended June 30, compared to net income of €282,137 in the same period in 2022.
- Diluted earnings per ordinary share of €9.07 for the first half of 2023 ended June 30, compared to earnings of €9.09 per share for the same period in 2022.