
Last week, I talked about sector diversification and how it helps reduce risk in your portfolio. This week, I want to build on that by introducing sector rotation – a strategy some investors use to try and stay ahead of market trends.
But before we dive in, if you’re new to investing, sector rotation might be a bit more complicated than you’d like. It involves tracking economic trends, monitoring data, and making frequent portfolio adjustments, which can be tricky (even for experienced investors). Instead of trying to time the market by jumping between sectors, a better approach for beginners is to focus on building a strong, diversified portfolio of 20+ solid companies across different industries. This way, no matter what’s happening in the economy, part of your portfolio is likely doing well. Over time, as you gain experience, you can decide if sector rotation is something worth exploring.
That said, if you’re curious about how and why some investors rotate between sectors, stick around! If not, feel free to skip to the next section. 😊
So, what is sector rotation?
Sector rotation is the idea that different parts of the market perform better at different points in the economic cycle. Investors who use this strategy try to move their money into sectors that are expected to do well next.
For example, when the economy is booming, people tend to spend more on things like gadgets, vacations, and luxury goods. This benefits technology and consumer cyclicals stocks. But when the economy slows down, people cut back on extras and stick to essentials like groceries and medical care. That’s when healthcare, consumer staples, and utilities tend to hold up better.
The Economic Cycle: Why It Matters
The economy moves in cycles, and each stage affects different sectors in unique ways. Here’s a simplified breakdown:
- Expansion (Growth Mode 🚀) – The economy is strong, businesses are investing, and consumers are spending. Sectors that do well: Technology, Consumer Cyclicals, and Industrials.
- Peak (Everything’s Hot 🔥) – Growth is at its highest, but investors start worrying about a slowdown. Sectors that do well: Defensive sectors like Healthcare and Utilities.
- Contraction (Slowdown 🛑) – The economy cools down, and businesses and consumers cut spending. Sectors that do well: Consumer Staples, Utilities, Healthcare.
- Trough (Rock Bottom 📉) – The economy is at its weakest, but recovery is on the horizon. Sectors that do well: Financials, Industrials, and early-stage Tech investments.
Real-World Example: Sector Rotation During COVID-19
A great example of sector rotation happened during the COVID-19 crash in early 2020. When the market tanked, investors pulled out of high-risk sectors like Technology and Consumer Discretionary and rushed into safer areas like Healthcare and Consumer Staples (think grocery stores and drug companies). But as the economy started recovering in late 2020 and 2021, the money rotated back into Technology and Consumer Cyclicals stocks, especially as people started spending again.
Should You Use Sector Rotation?
For new investors, probably not yet. Instead of trying to jump between sectors, focus on building a strong, diversified portfolio that can weather different market conditions. Think of it like this: Instead of constantly switching between different teams in a sports league, why not build a well-rounded team from the start?
That said, if you’re interested in learning about sector trends, here are a few tips:
- Pay attention to economic indicators – Things like GDP growth, unemployment rates, and inflation give clues about where the economy is headed.
- Look at sector performance – Sector ETFs (exchange-traded funds) can help you see which sectors are doing well.
- Don’t overcomplicate things – Even professional investors don’t get sector rotation right all the time. Sticking with a diversified approach is often the best bet.
Final Thoughts
Sector rotation is an interesting concept, but it’s not something new investors need to worry about right away. A diversified portfolio across multiple industries already gives you exposure to different sectors at different times. As you gain more experience, you might decide to fine-tune your portfolio based on economic trends – but for now, keeping it simple is often the best strategy. 😊
Knowing how sectors perform in different economic cycles is useful, but the real question is – what’s driving the markets right now? Let’s take a look at this week’s biggest movers and what they mean for us investors.
Items that may only interest or educate me ….
Canadian Economic news, US Economic news .…
Canadian Economic news
This past week’s key economic data that the Bank of Canada (BoC) considers when deciding whether to raise or lower the interest rate.
Consumer Price Index (CPI)
Canada’s inflation rate edged higher in January, coming in above expectations both monthly and annually. According to Statistics Canada, headline inflation rose 0.1%, reversing December’s 0.4% decline, while markets had expected no change. On a yearly basis, inflation climbed to 1.9%, slightly above the forecasted 1.8% and marking the first acceleration since October 2024. Despite the increase, inflation has remained below the BoC’s 2% target for six straight months.
Gas prices were a key driver, jumping 4.0% in January and 8.6% year over year. Meanwhile, ‘Recreation, education, and reading’ and ‘Alcoholic beverages, tobacco products, and recreational cannabis’ both saw prices dip 0.6% for the month. One area that continues to pressure consumers is shelter costs, which rose 0.3% in January and are up 4.5% from a year ago.
Core inflation, which excludes volatile food and energy prices, declined 0.1% for the third straight month. However, on an annual basis, core CPI came in at 2.2%, edging above both the expected and December’s 2.1%.
While rising energy costs, particularly gasoline and natural gas, pushed inflation higher, the temporary GST/HST tax break and falling food prices helped soften the overall increase. It will take until the March CPI report for the effects of the GST break to be fully removed from inflation data.
With higher inflation readings, stronger-than-expected jobs data, and uncertainty around potential US tariffs, many analysts now believe the central bank may hold off on rate cuts at its next meeting on March 12. However, if tariffs are imposed, expectations for rate cuts could shift once again.
Retail Trade
Canadian retail sales saw a major rebound in December, surging 2.5% after staying flat in November – the biggest jump since May 2022. This strong finish to the year pushed annual sales growth to 3.9%, well above November’s 1.6% and crushing expectations of just 0.8%.
Stripping out volatile categories like auto sales and gasoline, core retail sales also jumped 2.5% in December, bouncing back from a 1.0% drop the previous month. Year over year, core sales climbed 3.0%, far outpacing November’s sluggish 0.8% growth.
The sharp rise in spending was largely driven by the GST tax holiday, which kicked in on December 15 and encouraged shoppers to spend more in the second half of the month. However, early data suggests sales dipped 0.4% in January, indicating that the initial boost didn’t sustain into the new year.
Retail sales are a key driver of economic growth, making up nearly 40% of total consumer spending. December’s surge suggests that many Canadians delayed purchases until the tax break kicked in, giving the economy an extra push to close out 2024 on a high note.
Canadian market volatility
Canada’s Volatility Index (VIXC) started the week at 14.86, staying mostly within the range of 14.30 to 16.0. But the week wasn’t all smooth sailing – thanks to some new mid week tariff threats, the VIXC temporarily spiked above 20 following a lumber tariff warning. Things then took an unexpected turn with a sharp, short-lived drop to 10.75 before settling back in the 15-point range, ending the week at 14.99, essentially where the VIXC started.
For those new to the VIXC (traded as VIXI on the Toronto Stock Exchange), think of it as the market’s fear gauge. Readings below 10 signal smooth sailing, while 10 to 20 reflect normal market fluctuations. Once it pushes past 20, uncertainty starts creeping in, and things can get choppy. 😊
US Economic news
This past week’s key data points that the Federal Reserve (Fed) considers when deciding whether to raise or lower the interest rate.
Federal Open Market Committee (FOMC) minutes
The FOMC just released the minutes from its January 28-29 meeting, offering insight into the Fed’s current stance. The key takeaway? Policymakers remain cautious, weighing optimism about economic growth against persistent inflation concerns.
- Interest Rates Stay Put – The Fed kept its benchmark interest rate unchanged at 4.25% to 4.5%, choosing to wait and see how things unfold. This means borrowing costs – like mortgages, car loans, and business loans – won’t change for now. If you’re considering a big purchase, your financing costs should stay steady.
- Inflation Worries Remain – The Fed is still keeping a close watch on inflation (aka rising prices), especially with tariffs potentially driving costs higher. Before considering rate cuts, they want more proof that inflation is under control. The goal? Keeping your everyday expenses from spiraling out of control.
- Economic Optimism – There’s a positive outlook on the economy, partly thanks to expected regulatory changes and tax policy adjustments that could support business growth. A stronger economy can mean more job opportunities and better investment returns.
- A Wait-and-See Approach – With past rate cuts already making monetary policy less restrictive, the Fed is in no rush to act. They’re assessing economic data before making any major moves.
- Policy Independence – Fed Chair Jerome Powell emphasized that their decisions are guided by data – not politics. This helps ensure stability and predictability for businesses and investors.
- Future Rate Cuts? – While the Fed isn’t ruling out future rate adjustments, they’re not in a hurry to lower rates until they’re confident inflation is under control. For now, patience is the plan.
Bottom Line:
The Fed is keeping rates steady, balancing cautious optimism about the economy with concerns about inflation. For both consumers and investors, this means rate cuts aren’t coming just yet. However, understanding the Fed’s decisions – and the reasoning behind them – can help you see the bigger economic picture and make more informed financial choices.
Consumer Sentiment Index (CSI)
The University of Michigan’s final CSI for February came in at 64.7, marking a sharp drop of 9.8% from January’s 71.1 and falling well short of analysts’ expectations of 67.8. Compared to last year’s 76.9, sentiment is down 15.9%, hitting its lowest level since November 2023. This also marks the second straight month of declining consumer confidence.
Looking at the details: The Current Economic Conditions Index, which reflects how people feel about their finances right now, dropped to 65.7 from 75.1—a steep 12.5% decline and 17.3% lower than a year ago. Meanwhile, the Index of Consumer Expectations, which gauges optimism about the next six months, slipped to 64.0, down 7.9% from January and 14.9% year-over-year.
This decline wasn’t limited to one group—sentiment dropped across all age, income, and wealth brackets. The main culprit? Growing concerns that tariff-driven price hikes could erode consumers’ purchasing power.
American market volatility
The CBOE Volatility Index (VIX), often called the market’s “fear gauge,” started the week at 15.57 and hovered around 16 as investors largely brushed off ongoing tariff threats. By week’s end, investors seemed to grow numb to the uncertainty – until a last-minute surge pushed the VIX to 18.21, triggered by weaker-than-expected economic data that reignited concerns about the economy.
For those new to the VIX, think of it as the market’s stress meter. A reading below 12 means calm waters, while 12 to 20 signals normal market swings. If it climbs above 20, nerves are rising, and anything over 30 usually signals real trouble.
Weekly Market and Portfolio Review
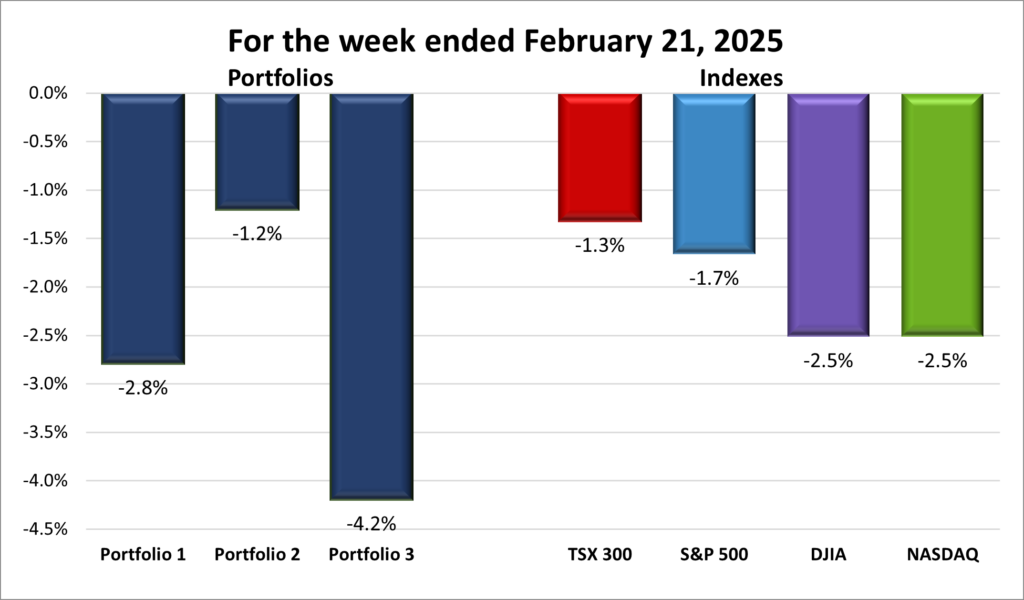
For the week, the TSX (SPTSX) slipped 1.3%, the S&P 500 (SPX) lost 1.7%, the DJIA (INDU) and the Nasdaq (CCMP) both fell 2.5%.
| Index | Weekly Streak |
| TSX: | 1 – week losing streak |
| S&P: | 1 – week losing streak |
| DJIA: | 1 – week losing streak |
| Nasdaq: | 1 – week losing streak |
 Markets sailed through rough waters this week, with waves of uncertainty growing stronger as fresh tariff threats and weakening consumer demand pulled indexes underwater by week’s end, as shown in the weekly progress chart above.
At first, markets managed to stay afloat despite last week’s stronger-than-expected US inflation report. But the tide turned when President Trump announced a series of industry-specific tariffs. Early in the week, he signaled forthcoming 25% tariffs on imported cars, semiconductors, and pharmaceuticals. Investors barely flinched – until he later tacked on lumber and forest products, sending markets into stormy seas. These latest threats have rattled investors, stoking fears that a broader trade war may be on the horizon.
As businesses and investors try to navigate these shifting currents, the impact is already showing up in inflation expectations. Long-term inflation forecasts among US consumers surged to their highest level since 1995, with many expecting prices to rise at an annual rate of 3.5%. With each new tariff announcement, concerns over higher costs, economic uncertainty, and market volatility continue to mount.
Not long ago, artificial intelligence and Magnificent 7 companies were steering market sentiment, but tariffs, inflation fears, and lackluster corporate earnings have now taken the helm. As a result, consumer confidence has taken a hit, weighed down by growing concerns over employment, a slowing economy, and rising rates.
In Canada, the Big Six banks will report earnings next week against a backdrop of uncertainty. If tariffs take effect, they could create ripple effects for Canadian businesses, making it harder for some to repay loans—bad news for banks and, in turn, the broader economy. A wave of rising defaults from struggling businesses and consumers would only add to an already turbulent environment.
To put an exclamation point on how rough the shortened week was, Friday delivered the worst trading day of 2025 for both the Canadian and U.S. markets – a stormy end to an already turbulent stretch. ☹
| Portfolio | Weekly Streak |
| Portfolio 1: | 1 – week losing streak |
| Portfolio 2: | 1 – week losing streak |
| Portfolio 3: | 1 – week losing streak |
At the halfway mark, all three portfolios were sitting in the green – but unfortunately, the week wasn’t over. A rough final two days pushed them into the red ☹, as shown in the weekly performance chart below.
Portfolio 1 had a tough week, slipping 2.8%, with only 32% of holdings managing a gain. There weren’t many bright spots, but Celsius Holdings (NASD: CELH) soared 140% on its acquisition of a competitor. Offsetting that strength were steep losses from Cloudflare (NYSE: NET), down 13%, Trade Desk (NASD: TTD) and indie Semiconductor (NASD: INDI), both down 12%, and Datadog (NASD: DDOG), which slipped 10%.
Portfolio 2 fared the best – or rather, lost the least – dipping 1.2% with 40% of holdings in positive territory. There weren’t any major swings, but iA Financial (TSE: IAG) set a record high early in the week before giving up those gains to finish lower, while Take-Two Interactive (NASD: TTWO) hit an all-time high on its way to a weekly win.
Portfolio 3 had the roughest stretch, with only 21% of its holdings closing higher as it fell 4.2%. Cloudflare took a hit, dropping 13%, while Vertiv Holdings (NYSE: VRT) slid 11%, adding to the drag.
While the week didn’t end the way I’d hoped, that’s just part of the ride in investing. February has brought its fair share of volatility, but with that comes opportunity. Next week is a fresh slate – and a chance for the portfolios to bounce back!
Companies on the Radar
 This past week, two companies in the semiconductor space caught my attention – Onto Innovation (NYSE: ONTO) and Ultra Clean Holdings (NASD: UCTT). Neither of them actually makes semiconductors, but both play a key role in the chip-making process.
Ultra Clean Holdings specializes in critical components and ultra-high purity cleaning and analytical services, helping semiconductor manufacturers improve efficiency from design to production. Onto Innovation, on the other hand, develops advanced process control tools – though, if I’m being honest, their technology is a bit beyond my understanding. And if I can’t easily grasp what a company does, it usually ends up in my ‘too-hard-to-understand basket.’ That said, I’ll still take a quick look before deciding whether to keep it on my radar.
With these two additions, my radar list now sits at six US companies, including the four holdovers below.
- Sportradar Group AG (NASD: SRAD): A mid-cap Swiss company specializing in sports data, content, and integrity services that support businesses in sports, media, and betting industries.
- Interactive Brokers (NASD: IBKR), a large-cap, American online brokerage firm known for its advanced trading platform used by professional of all levels.
- Rubrik, Inc. (NASD: RBRK): a high-growth, large-cap American cybersecurity firm.
- Axon Enterprise, Inc. (NASD: AXON): A large-cap innovator in body cameras, TASER devices, and cloud-based evidence management software, serving law enforcement and public safety agencies.
As always, these are not buy recommendations – be sure to do your own research and make decisions that align with your personal financial goals!
The Radar Check was last updated February 21, 2025.


Portfolio Update
Portfolio 1
Portfolio 1 for the week ended February 21, 2025: DOWN 
- Celsius Holdings made its largest deal in its 20-year history with the acquisition of energy drink rival Alani Nu for US$1.8 billion. Both brands have a strong foothold in the fitness and wellness space, but the acquisition gives Celsius an easy entry into the supplement and snack market, expanding its reach beyond beverages. Celsius is hoping this deal will help them to reclaim lost market share and accelerate growth.
Activity
Buy: Walmart (NYSE: WMT) I first invested in Walmart back in March 2024. Walmart is a steady performer through most of the economic cycle, but it really shines when times get tough – making it a great counterbalance to some of the riskier, growth-focused stocks in my portfolio.
Since that initial investment, Walmart has delivered strong results, and the stock price has followed suit – up nearly 60% as of this update. My original reasons for investing still hold: Walmart’s ability to generate solid, stable revenue and profit, backed by a well-diversified business model that spans retail, wholesale, and e-commerce.
Their fourth-quarter earnings report beat revenue and profit expectations, but the company’s cautious outlook for 2025 gave some investors pause, leading to a temporary drop in the stock price. That didn’t change my conviction. In fact, during their earnings presentation, CEO Doug McMillon reinforced Walmart’s momentum, saying:
“We have momentum driven by our low prices, a growing assortment, and an eCommerce business driven by faster delivery times. We’re gaining market share, our top line is healthy, and we’re in great shape with inventory.”
So, when Walmart’s stock pulled back after the earnings presentation, I saw it as an opportunity to add to my position at a discount – so I did. 😊
Dividends
Dividends Received this week for the following companies:
Canadian $
BSR Real Estate Investment Trust (TSE: HOM.UN)
US $
No US$ dividends this past week.
Quarterly Reports
Cameco Corporation
Fourth quarter 2024 financial results on February 20, 2025
Walmart Inc.
Fourth quarter 2024 financial results on February 20, 2025
Grab Holdings Limited
Fourth quarter 2024 financial results on February 20, 2025
indi Semiconductor, Inc.
Fourth quarter 2024 financial results on February 20, 2025
Celsius Holdings, Inc.
Fourth quarter 2024 financial results on February 20, 2025
Portfolio 2
Portfolio 2 for the week ended February 21, 2025: DOWN
- Zoetis (NASD: ZTS) announced they have received conditional approval for the use of its bird flu vaccine in poultry.
Activity
No significant activity to report this week.
Dividends
Dividends Received this week for the following companies:
Companies followed by DRIP (Dividend Re-Investment Plan) indicate additional shares were purchased with the dividend. Any cash leftover was added to the cash balance.
Canadian $
SmartCentres Real Estate Investment Trust (TSE: SRU.UN)
Whitecap Resources Inc (TSE: WCP) DRIP
US $
No US$ dividends this past week.
Quarterly Reports
iA Financial Group
Fourth quarter 2024 financial results on February 18, 2025
Whitecap Resources Inc.
Fourth quarter 2024 financial results on February 19, 2025
Birkenstock Holding plc
First quarter 2025 financial results on February 20, 2025
Guardant Health, Inc.
Fourth quarter 2024 financial results on February 20, 2025
Supremex Inc.
Fourth quarter 2024 financial results on February 20, 2025
Portfolio 3
Portfolio 3 for the week ended February 21, 2025: DOWN
- Microsoft (NASD: MSFT) announced they planned to spend an additional US$7 million in Poland to help improve Polish cybersecurity capabilities.
In other Microsoft news, the company announced a new quantum computing chip, the Majorana 1. The company claims the new chip means quantum computers capable of solving industrial-scale problems are only years rather than decades away.
Activity
No significant activity to report this week.
Dividends
Dividends Received this week for the following companies:
Canadian $
SmartCentres Real Estate Investment Trust (TSE: SRU.UN) DRIP
US $
No US$ dividends this past week.
Quarterly Reports
No quarterly reports this past week.