
This past week, the Dow Jones Industrial Average (DJIA) dropped below its 200-day moving average (DMA). OK, you say, but what does this mean, and why should we care? Well, let’s take a closer look at two of the most commonly watched moving averages: the 200-DMA and its shorter-term counterpart, the 50-DMA.
What Are Moving Averages?
Moving averages are tools investors use to smooth out daily price fluctuations and identify trends. The 200-day moving average (200-DMA) tracks long-term trends, while the 50-day moving average (50-DMA) focuses on shorter-term movements.
The 200-Day Moving Average: The Long-Term Trend Tracker
The 200-DMA represents the average closing price of a stock or index over the last 200 trading days. It’s a key indicator of the long-term trend – helping investors gauge if a stock is trending up, down, or moving sideways.
Why It Matters:
- Bearish Signal: A drop below the 200-DMA can signal weakening long-term momentum.
- Investor Sentiment: Falling below this level can shake investor confidence and lead to further declines.
- Support Level: The 200-DMA often acts as support. If a stock falls below it, that support can turn into resistance.
💡 Think of the 200-DMA as the track of a roller coaster. When the track is steadily climbing, the ride feels smooth. But if it starts sloping downward, it could signal a rough drop ahead. Investors brace themselves, deciding whether to ride it out or prepare for more turbulence.
The 50-Day Moving Average: The Short-Term Pulse
The 50-DMA tracks the average over the past 50 days, making it more sensitive to recent price movements and helping investors spot short-term trends.
Why It Matters:
- Short-Term Bearish Signal: A drop below the 50-DMA may indicate a short-term downtrend.
- Investor Sentiment Shift: If a stock consistently trades below its 50-DMA, it could suggest weakening confidence.
- Potential Opportunity: Some investors view a dip below the 50-DMA as a potential buying opportunity, assuming the stock will bounce back.
💡 If the 200-DMA is the track guiding the entire roller coaster, the 50-DMA is like the smaller hills and dips along the way. When the ride stays above these smaller hills, the momentum feels strong. But if each hill dips below the last, it could signal a slowdown, or a sharper drop ahead. Investors watch these shifts to gauge whether momentum is fading or still strong.
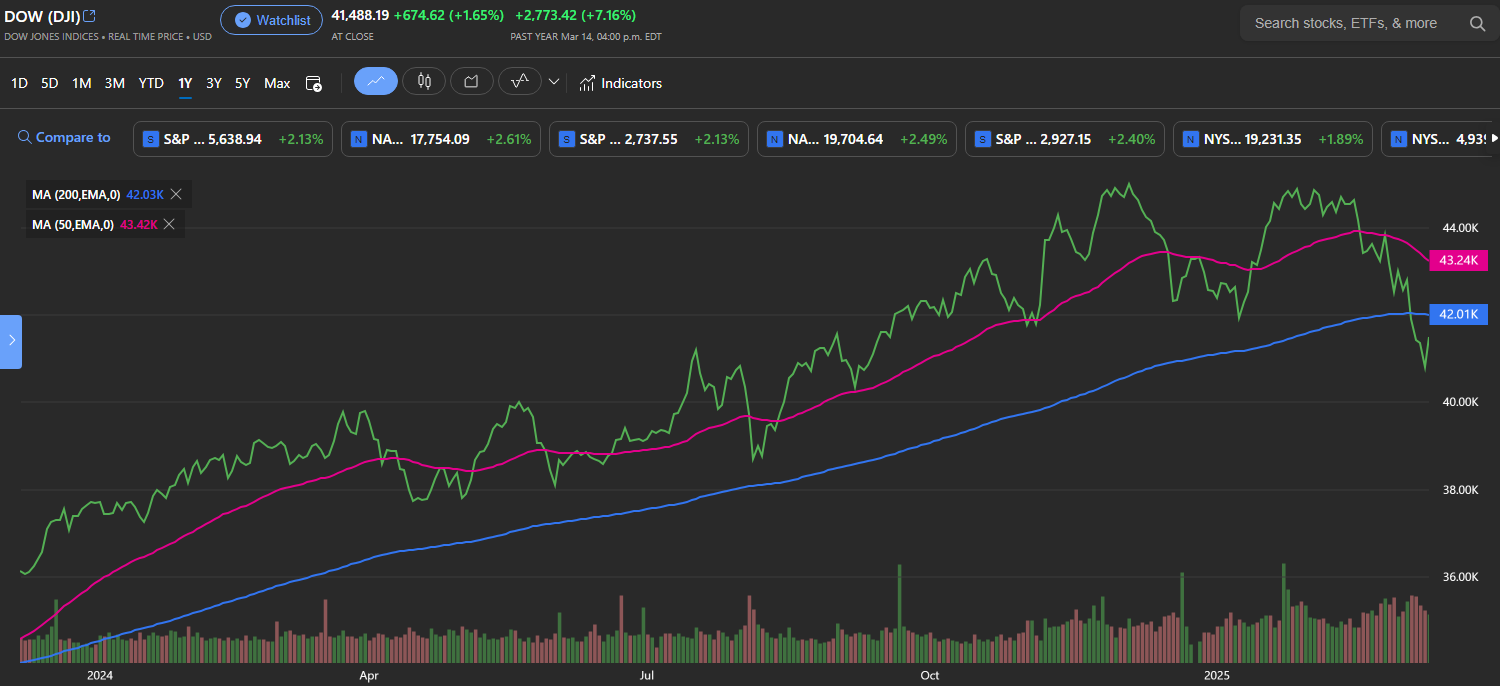
In this chart below of DJIA’s 1-year performance as of March 14, the pink line represents the 50-DMA, while the blue line is the 200-DMA. As you can see, the 50-DMA reacts faster than the 200-DMA, rising and falling more quickly. You can see the DJIA has dropped below both the 50 and 200 DMAs.
Comparing the 200-DMA and 50-DMA
| Feature | 200-DMA | 50-DMA |
|---|---|---|
| Timeframe | Long-term (200 days) | Short-term (50 days) |
| Sensitivity | Less reactive to price swings | More sensitive to price changes |
| Usage | Used by long-term investors | Used by short-term traders |
| Signals | Crossing below = potential long-term downtrend | Crossing below = possible short-term weakness |
The Golden Cross & Death Cross
When the 50-DMA crosses the 200-DMA, it signals important market trends:
- Golden Cross: When the 50-DMA crosses above the 200-DMA, it suggests potential strength.
- Death Cross: When the 50-DMA falls below the 200-DMA, it signals potential weakness.
💡 Imagine the 200-DMA as a slow-moving train tracking the big picture, while the 50-DMA is a zippy sports car reacting to the twists and turns. Both offer valuable perspectives on market trends.
Final Thoughts
Moving averages aren’t foolproof, but they offer valuable insights into market direction. A dip below a moving average doesn’t guarantee disaster, and a rise above doesn’t promise endless gains. I use them to gauge the overall market trend or the momentum of a specific stock. These moving averages are just one of many tools in my toolbox as I aim to grow my wealth through investing. 😊
Now that we’ve covered how moving averages can provide a clearer view of the market’s direction, let’s take a look at what moved the markets this past week and how those movements influenced the DMAs…
Items that may only interest or educate me ….
Canadian Economic news, US Economic news
Canadian Economic news
This past week’s key economic data that the Bank of Canada (BoC) considers when deciding whether to raise or lower the interest rate.
Bank of Canada rate decision
As expected, the BoC lowered its key interest rate by 0.25% to 2.75% in an effort to counter the impact of US tariffs. This marks the second rate cut of the year and the seventh consecutive reduction, bringing rates down a total of 2.25% from 5.0% just nine months ago.
The decision comes as Canada faces fresh economic challenges from rising trade tensions and US tariffs, which could slow growth and push inflation higher. BoC Governor Tiff Macklem acknowledged these risks, stating that the bank will “proceed carefully with any further changes” as it balances inflation concerns with the need to support the economy. He emphasized that while Canada started the year in solid shape, with inflation near their 2% target, uncertainty surrounding US tariffs is already dampening economic confidence. Macklem also cautioned, “Depending on the extent and duration of new US tariffs, the economic impact could be severe.”
What this means for the economy
The BoC’s rate cut aims to stimulate growth by making borrowing cheaper, but US trade tensions add an element of uncertainty. While the economy has been strong, the bank warns that tariffs are causing consumers and businesses to become more cautious.
For consumers, lower rates mean cheaper mortgages, loans, and credit cards, providing some relief. Homeowners with variable-rate mortgages will see smaller payments. However, if tariffs drive up import costs, those savings could be offset by higher prices.
For businesses, lower borrowing costs can help fund expansion and investment. However, trade uncertainty may cause delays in hiring and spending, especially in export-heavy industries like manufacturing and natural resources, which are particularly vulnerable to US tariffs.
For us investors, lower rates allow companies to borrow more cheaply to grow their businesses, which can boost profits and, in turn, stock prices. This often leads to more investors buying stocks, pushing the market even higher.
Overall, while the rate cut offers short-term relief, its full impact depends on how trade tensions unfold. If tariffs continue to weigh on confidence, the BoC may need to adjust its approach again. For now, uncertainty remains the biggest challenge.
Canadian market volatility
Canada’s Volatility Index (VIXC) kicked off the week at 14.63 but didn’t stay there for long. By midweek, it had climbed into the 16-point range, occasionally spiking as high as 17.0. The BoC’s rate cut and signs of slowing US inflation kept the index fluctuating before it ultimately settled at 16.43 to close out the week.
For those new to the VIXC (traded as VIXI on the TSX), think of it as a gauge of market nerves. When it’s below 10, investors are feeling confident, while readings between 10 and 20 reflect normal market ups and downs. If it climbs above 20, uncertainty is taking over. This week’s midweek jump suggests investors were reacting to shifting economic signals but weren’t hitting the panic button.
US Economic news
This past week’s key data points that the Federal Reserve (Fed) considers when deciding whether to raise or lower the interest rate.
Labour data
Job Openings and Labor Turnover Survey (JOLTS)
The latest JOLTS report from the US Bureau of Labor Statistics (BLS) showed January job openings rising to 7.75 million, up from December’s revised 7.5 million, signaling strong hiring demand. However, openings remain 728,000 lower than a year ago. With 1.2 job openings per unemployed person, the labour market remains tight, reinforcing the economy’s resilience. That said, since JOLTS covers January while last week’s ADP and Employment Situation Summary reports reflected February data, it offers little new insight beyond confirming that the job market remains stable but faces some emerging headwinds. However, it does indicate that President trump inherited a strong labour market.
Consumer Price Index (CPI)
The latest CPI inflation report for February 2025 shows that prices cooled more than expected, offering some relief to investors. Headline CPI, which tracks the overall cost of goods and services, rose 2.8% year-over-year, slightly below the expected 2.9% and down from 3.0% in January. On a monthly basis, prices increased 0.2%, also coming in lower than the forecasted 0.3%, after a sharper 0.5% jump in January.
Looking at specific price changes, ‘Utility gas services’ saw the biggest increase, jumping 2.5% in February. Meanwhile, ‘Gasoline’ and ‘New vehicle’ prices both fell 1.0%, helping ease inflation pressures. Compared to last year, ‘Transportation services’ and ‘Utility gas services’ costs were up 6.0%, while ‘Fuel oil’ prices dropped 5.1%, making it the biggest annual decliner.
Housing costs – including rent and mortgages – rose 0.3% monthly, slowing from 0.4% in January. Over the past year, shelter inflation cooled to 4.2%, a positive sign for affordability concerns.
Core CPI, which strips out volatile food and energy prices, also showed signs of easing. It rose 0.2% in February, down from 0.4% in January, while the annual rate slowed to 3.1% from 3.3% – its lowest level since April 2021. Both figures came in slightly softer than expected.
For us investors, this is good news. Softer inflation eases pressure on the Fed, making it more likely that they could cut interest rates later this year. Lower rates tend to boost stocks, as they make borrowing cheaper for businesses and improve overall market sentiment. The markets responded favourably, with all four major indexes moving higher after three straight days of losses.
While inflation isn’t fully tamed yet, today’s report suggests it’s moving in the right direction, paving the way for a more investor-friendly environment in the months ahead. Now, if only those tariffs – threatening to push prices higher – would go away. 😊
Consumer Sentiment Index (CSI)
The University of Michigan’s preliminary Consumer Sentiment Index reading for March tumbled to 57.9 from 64.7 in February, well below expectations of 63.1. This marks the third consecutive monthly decline and a 22% drop since the start of the year, bringing sentiment to its lowest level since July 2022. The 10.5% slide from last month and the 27.1% decline from a year ago highlight growing consumer unease.
Digging into the details: The Current Economic Conditions Index, which reflects how consumers feel about their financial situation, dipped to 63.5 from 65.7—a 3.3% drop from February and 23% lower than a year ago. The bigger hit came from the Index of Consumer Expectations, which measures optimism for the next six months. It plunged to 54.2, down 15.3% from February and a steep 30% from March 2024’s reading of 77.4%. The decline was broad-based, cutting across all demographics and political groups.
So, what does this mean? The sharp drop suggests households are growing increasingly cautious, likely due to rising inflation expectations and uncertainty over economic policies. When policies – such as tariffs or trade restrictions – are constantly shifting, it makes it harder for consumers to plan for the future. When confidence falls, people tend to save more and spend less, which can slow economic growth since consumer spending is a key driver of GDP.
For us investors, weaker sentiment can lead to increased market volatility. When consumers hold back on major purchases, corporate profits can take a hit, weighing on stock prices. Meanwhile, rising inflation concerns could pressure the Fed to adjust its interest rate strategy, adding another layer of uncertainty.
In short, this latest drop in consumer sentiment is a warning sign that both the economy and markets may face some headwinds in the months ahead.
American market volatility
The CBOE Volatility Index (VIX), often called the market’s “fear gauge,” started the week at 24.70 and hovered between 24.50 and 27.50 for most of the week. It briefly spiked just below 29 before easing back to 21.77 at the end of a volatile week. The main culprit behind the market jitters? The back-and-forth over potential electricity tariffs between Canada and the US But with both sides ultimately backing down, along with better-than-expected inflation data, the VIX had cooled off by the end of the week.
For those new to the VIX, think of it as the market’s stress meter. A reading below 12 means smooth sailing, 12 to 20 signals typical market swings, and anything above 20 suggests rising anxiety. When it climbs past 30, buckle up – markets are in turmoil. With the VIX closing above 20, traders are clearly bracing for volatility ahead.
Weekly Market and Portfolio Review
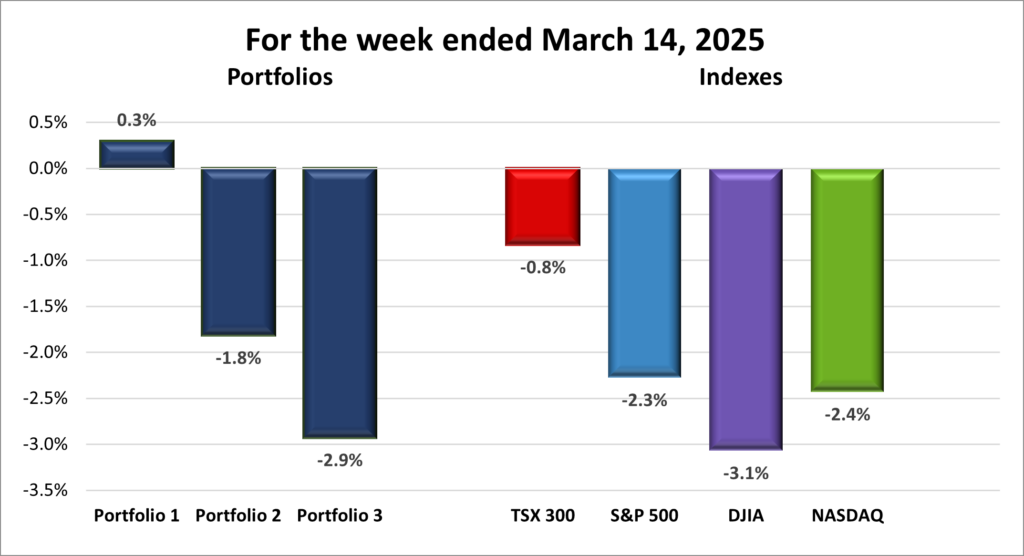
For the week, the TSX (SPTSX) dropped 0.8%, the S&P 500 (SPX) slipped 2.3%, the DJIA (INDU) declined 3.1% and the Nasdaq (CCMP) lost 2.4%.
| Index | Weekly Streak |
| TSX: | 2 – week losing streak |
| S&P: | 4 – week losing streak |
| DJIA: | 2 – week losing streak |
| Nasdaq: | 4 – week losing streak |
![]() This past week picked up right where last week’s selloff left off, as shown in the chart above, with markets still rattled by US trade wars. Investors are growing more risk-averse, fearing a recession – or worse, stagflation, where economic growth stalls while inflation stays high, in this case due to tariffs. President Trump downplayed concerns, calling it a mere “period of transition.
This past week picked up right where last week’s selloff left off, as shown in the chart above, with markets still rattled by US trade wars. Investors are growing more risk-averse, fearing a recession – or worse, stagflation, where economic growth stalls while inflation stays high, in this case due to tariffs. President Trump downplayed concerns, calling it a mere “period of transition.
It was another rough week for stocks, capped by one of the worst trading days in three years. Tariff whiplash, market volatility, and economic uncertainty fueled the selloff. The US government narrowly avoided a shutdown, but that wasn’t enough to calm investor nerves. The TSX slipped 0.8%, while the S&P 500 (S&P), DJIA, and Nasdaq Composite Index (Nasdaq) all dropped more than 2%.
The post-election market optimism has vanished, replaced by tariff-driven chaos. Unpredictable trade policies are hitting industries across the board, with consumers pulling back on everything from essentials to travel. Investor confidence is slipping too. Even us retail investors – who’d normally ‘buy the dip’ – are hesitant, wondering if stock prices have further to fall.
Monday kicked off with a steep drop, delivering the worst market returns in three years. The Nasdaq was down nearly 15% in under a month, with heavyweight tech stocks among the hardest hit. Typically, tech thrives in bullish markets, but this week, it was the last place anyone wanted to be.
The S&P fell below its 200-day moving average, a key support level, for the first time since November 2023. A day later, it officially entered correction territory, down more than 10% from its February 19 high. The decline was historic – just 16 trading days to correction, making it the fifth-fastest drop in the last 75 years. This also marks the third time under Trump’s presidency (2018, 2020, and now 2025) that the S&P has suffered one of the fastest corrections on record. The Nasdaq hit correction territory the previous week.
Amid the turmoil, there was one bright spot – better-than-expected US inflation data. If you’ve been holding gold, you’re probably smiling, as it surged past US$3,000 per troy ounce. But any optimism was overshadowed by Trump’s trade war with allies and the lingering threat of a US government shutdown.
Here in Canada, the BoC cut its benchmark rate to stimulate growth amid escalating US trade tensions. That uncertainty weighed on investor sentiment, stretching the TSX’s weekly losing streak to two.
Fortunately, the week ended on a strong note with a late rally. Whether the momentum lasts is anyone’s guess, but we’ll find out soon enough. Hopefully, it wasn’t just a ‘buy the dip’ rally – maybe, just maybe, it’s the start of a winning streak. 😊
| Portfolio | Weekly Streak |
| Portfolio 1: | 1 – week winning streak |
| Portfolio 2: | 2 – week losing streak |
| Portfolio 3: | 4 – week losing streak |
![]() Given the shaky market environment, I expected all three portfolios to take a hit this week. But to my surprise, my three portfolios played out like a classic Western – The Good, the Bad, and the Ugly. 😊
Given the shaky market environment, I expected all three portfolios to take a hit this week. But to my surprise, my three portfolios played out like a classic Western – The Good, the Bad, and the Ugly. 😊
The Good
Portfolio 1 rode off into the sunset with a 0.3% gain, defying the broader market selloff. Only 31% of holdings finished in the green, but one heavyweight carried the load – Nvidia (NASD: NVDA) surged 10%, easily outweighing losses elsewhere, including a 15% drop from The Trade Desk (NASD: TTD). Just last week, I was frustrated about Nvidia’s oversized weight in this portfolio. This week? It was the lone gunslinger keeping things afloat.
The Bad
Portfolio 2 took a hit, falling 1.8%. It actually had the most winners (39% of holdings posted gains), including an 11% jump from Guardant Health (NASD: GH). But the losses outnumbered the victories, leaving this portfolio stuck in no man’s land.
The Ugly
And then there was Portfolio 3—the outlaw that got run out of town, sinking 2.9%. Only 21% of its holdings managed gains, and none were big enough to matter. The only saving grace? No catastrophic losses. Otherwise, the damage could have been a whole lot worse.
Right now, investor fears are outweighing solid earnings and economic data, dragging the markets lower. With the portfolios following suit, it’s starting to feel like 2022, when all four major indexes cratered 20% or more, and each of the portfolios lost 27% or more. It wasn’t fun then. It isn’t fun now! ☹
Companies on the Radar
 After a rough week in the markets – and with volatility likely sticking around for a while – I’ve hit pause on searching for new companies to add to my portfolios. Meanwhile, with Rubrik, Inc. (NASD: RBRK) tumbling over 34% since early February, it’s officially off my radar. Mind you, that 27% jump following its earnings report this week did give me pause. That brings my watchlist down to the four companies below:
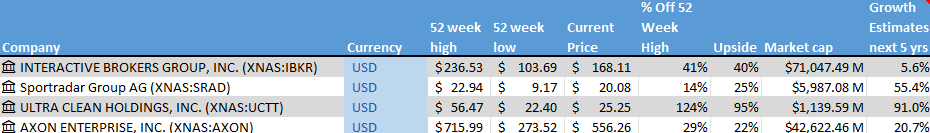
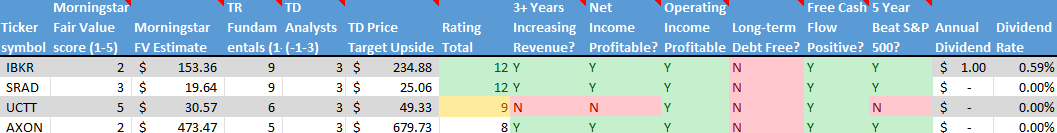
- Interactive Brokers (NASD: IBKR), A large-cap American online brokerage firm known for its advanced trading platform used by professionals and retail investors like us at all levels.
- Sportradar Group AG (NASD: SRAD): A mid-cap Swiss company specializing in sports data, content, and integrity services that support businesses in sports, media, and betting industries.
- Ultra Clean Holdings (NASD: UCTT): A small-cap American company specializing in critical components and ultra-high purity cleaning and analytical services in the semiconductor industry.
- Axon Enterprise, Inc. (NASD: AXON): A large-cap American innovator in body cameras, TASER devices, and cloud-based evidence management software, serving law enforcement and public safety agencies.
As always, these are not buy recommendations – be sure to do your own research and make decisions that align with your personal financial goals!
The Radar Check was last updated March 14, 2025.
That’s a wrap for this week—see you next time! Happy investing!