
Weekly Update for the week ending March 3, 2023

Items that may only interest or educate me ….

Canadian interest rate pause, global central banks, impact of US rate increases, Canadian GDP stalls, share buybacks, …


Analysts believe the BoC will hold Canada’s benchmark interest rate at 4.5% for the remainder of the year. Economic data has shown Canadian inflation has been heading downward so the Bank of Canada (BoC) has adopted a ‘wait and see’ attitude before making any changes to the interest rate. Many believe that the rate will remain at 4.5% unless the US Federal Reserve (Fed) raises the US key interest rate to far from the Canadian interest rate. If the two benchmark rates diverge too much, Canada risks importing inflation through the exchange rate.


Canada stands alone when it comes to pausing interest rate hikes. In February, the central banks responsible for the most widely traded currencies all raised their respective key interest rates. As has been mentioned in earlier blog posts, the Fed raised their benchmark rate by 0.25% and plan to raise the rate higher and maintain it there longer. Elsewhere around the globe:

  • The Reserve Bank of Australia raised its rate by 0.25% to 2.35%, the highest in over ten years.
  • The Bank of England raised their benchmark rate by 0.5% bringing the rate to 4.0%, its highest since the financial crisis.
  • The European Central Bank raised interest rates 0.5% to 2.5% and suggested there would be at least one more similar sized increase in March.
  • The Reserve Bank of New Zealand raised their benchmark rate by 0.5% to 4.75%, reaching levels last seen during the global financial crisis. They too said they expect there to be additional rate hikes coming as they battle with inflation.
  • Sweden’s Riksbank raised its key borrowing rate by 0.5% to 3% and hinted there could be at least two more 0.25% increases coming.

The BoC would appear to be the only major central bank to hold the line on interest rates. Good on them for following the data rather than the crowd.


The BoC has said they will pause further increases to Canada’s benchmark interest rate while the past rate increases have a chance to work through the Canadian economy. Currently inflation in Canada is headed lower, allowing the BoC to stay true to its plan to freeze hikes. However, recent US economic data indicates the American economy is still running too strong. As a result, the Fed is likely to raise the US benchmark interest rate a few more times, then keep it high until inflation in the US starts declining.

What does that have to do with us Canadians, you ask? As American interest rates climb, the value of the US dollar rises at the expense of foreign currencies, including the Canadian dollar. When US interest rates rise, it makes US financial markets more attractive to investors, which increases the demand for US dollars, leading to a stronger US currency. As the Canadian dollar falls against the US dollar, products coming from the US become more expensive. If the gap between the Canadian and US interest rates gets too wide, the BoC will be forced to raise the Canadian interest rate to prevent the cost of importing American goods and services becoming too high.

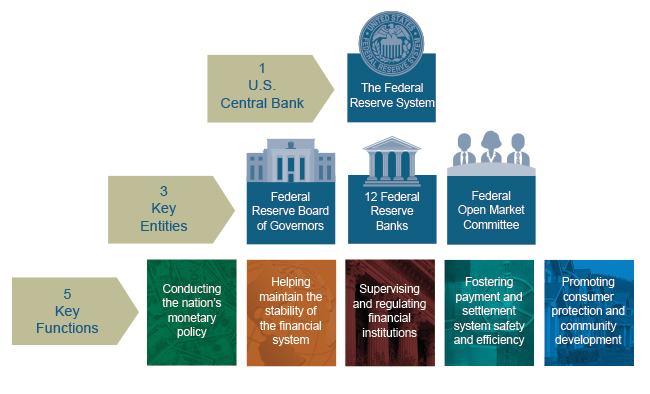
As I mentioned in the article on Central Banks this is how Canadians are affected by US interest rates and the actions of the Fed. I just didn’t see this real-world example coming so soon.


According to Statistics Canada, the Canadian economy, measured by Gross Domestic Product (GDP), stalled the last three months of 2023, ending a string of five straight quarterly gains. This was well below analysts’ expectations of a 1.5% increase from the previous quarter. The BoC’s itself had projected a 1.3% improvement.

Declines in business investment in equipment, housing starts and a slower buildup of inventory, offset by greater household and government spending, all contributed to zero economic growth. The flat GDP would seem to indicate the higher interest rates are acting as a brake on the Canadian economy and suggests the BoC made the right call in suspending future increases to the Canadian interest rate.


Recently, Warren Buffet, considered by many to be the greatest investor of all time, published his latest annual letter to shareholders. In it, he took a shot those who were critical of companies that bought back their own shares.

“When you are told that all repurchases are harmful to shareholders or to the country, or particularly beneficial to CEOs, you are listening to either an economic illiterate or a silver-tongued demagogue (characters that are not mutually exclusive).”

So, what exactly are share buybacks? As the term suggests, share buybacks are when a company chooses to buy back some of its own shares on the open market. This is considered a shareholder friendly action because it can increase the value of the remaining shares. In his letter, Mr. Buffet provides a great example of how share buybacks benefit all shareholders of the company.

“Imagine, if you will, three fully-informed shareholders of a local auto dealership, one of whom manages the business. Imagine, further, that one of the passive owners wishes to sell his interest back to the company at a price attractive to the two continuing shareholders. When completed, has this transaction harmed anyone? Is the manager somehow favored over the continuing passive owners? Has the public been hurt?”

Without doing anything, or costing you a penny, the value of your shares has increased in value. That is fairly friendly! 😊

When I take a deep dive on a company, one of the things I check is to see if the number of outstanding shares is increasing or decreasing. Generally, if the share count is stable or shrinking, I view that as a positive sign. The company is acting in shareholders’ interest or at worst, they are not hurting shareholders interests by diluting the value of the existing shares.

On the other hand, if the number of shares is increasing, I want to know why. A bit of growth is acceptable, however, if the shares are growing rapidly (say, greater than 5% per year), I take that as a yellow flag. I want to know why the shares are growing so fast. If the company is increasing the outstanding shares to raise cash, that concerns me, as they may be tight on cash. At that point I’ll most likely move on from the company.


Let’s see what moved the market this past week….

Weekly Market Review

Monday: The markets got off to a hot start today before ending the day with modest gains. After last week’s losses, any gains were good gains. Once again, concerns about higher interest rates held back all four major North American indexes.

In Canada, the Toronto Stock Exchange Composite Index (TSX) was lifted by higher energy and commodity prices. In the Canadian sectors, the Basic Materials (miners and fertilizer manufacturers) and the Consumer Cyclical sectors gained the most while Consumer Staples and Healthcare fell the farthest.

In the US, the three American indexes – the S&P 500 Index (S&P), the Dow Jones Industrial Average (DJIA), and the Nasdaq Composite Index (Nasdaq) – ended the day marginally higher. Investors were looking for some bargains after last week’s beat down. In the American sectors, the Consumer Cyclicals and Industrials advanced the most, with Utilities and Consumer Staples dropped the most.

Tuesday: A lumpy day for the indexes was a fitting way to close out a volatile February. The TSX and DJIA spent the day bouncing around in negative territory while the S&P and Nasdaq bumped along in positive territory before diving below the bar at the end of the day. Concerns about the likelihood of higher interest rates continues to cast a shadow over all the indexes. Oil prices ended higher as hopes for strong demand out of China won the tug of war with fears of higher US interest rates.

In Canada, the TSX was dragged lower by the Financials sector. Banks must set aside more money for tougher economic conditions that could lead to more loan defaults caused by the higher interest rates. This has led to lower profits as well as forecasts for lower profits going forward. Of the Canadian S&P sectors that advanced, Basic Materials and Technology led the way, while Energy and Utilities lost the most ground.

In the US, of the American S&P sectors, only Basic Materials and Financials were able to gain ground, while the Utilities and Energy sectors dropped the most.

Wednesday: Strong talk from the Fed sent the growth-oriented Nasdaq and S&P lower while the TSX ended higher and the DJIA ended on the positive side of flat. In Canada, news of China’s manufacturing sector growing at its fastest pace in 10 years lifted the TSX. The Basic Materials and Energy sectors were the main beneficiaries of the news and were the best performers of the Canadian sectors. At the other end of the spectrum, Technology and Healthcare dropped the most.

In the US, weak domestic manufacturing data indicated inflation was remaining high. Add in talk from the Fed about a possible 0.5% raise to the interest rate and its no wonder the Nasdaq and S&P fell for a second day. In trading across the three American indexes, Basic Materials, Energy, and Industrials were the only American sectors to end higher, while falling the farthest were Utilities and Consumer Cyclicals.

Thursday: Despite a shaky start to today’s session, all four indexes rallied in the afternoon to end in the green. The rally was started when the Fed said it might be able to suspend interest rate hikes in the summer. After all the tough talk from the Fed about the need for higher, longer interest rates, this was music to investors’ ears. Oil prices continue to climb on signs of economic growth in China.

In Canada, the talk of a pause in US interest rate hikes was enough to send the TSX to its highest close in two weeks. The Technology and Energy sectors had the biggest gains of the Canadian S&P sectors, while the Consumer Staples and Telecommunications Services dropped the most.

In the US, once again weekly jobless claims were lower. The good news for workers, bad news for investors was more than offset by the comments from the Fed about slow and steady increases with a possible mid summer pause. In trading, the Utilities and Technology sectors were the biggest gainers of the American S&P sectors. The Financials and Telecommunications Services were the only two sectors to end lower.

Friday: It was a bullish day for all four indexes as each ended the day sharply higher, finishing the week in the green. Economic data out of the USA showed healthy economic growth, coupled with slowing price increases. Oil price continued to rise on growing demand from China.

In Canada, strong economic data from China and the US, and rising commodity prices boosted the resource heavy TSX to its highest point in a few weeks. All the Canadian sectors ended higher with the Technology and Basic Materials sectors rising the most and Consumer Staples and Healthcare gaining the least.

South of the border, the three American indexes were up sharply on the positive economic news. Comments from the Fed that they were open to a 0.25% increase rather than a feared 0.5% raise but would let the data guide them. In the markets, it was an upbeat day as all American sectors finished in the green. Technology and Consumer Cyclicals advanced the most while Consumer Staples and Telecommunications Services had the smallest gains.


Weekly Portfolio Review

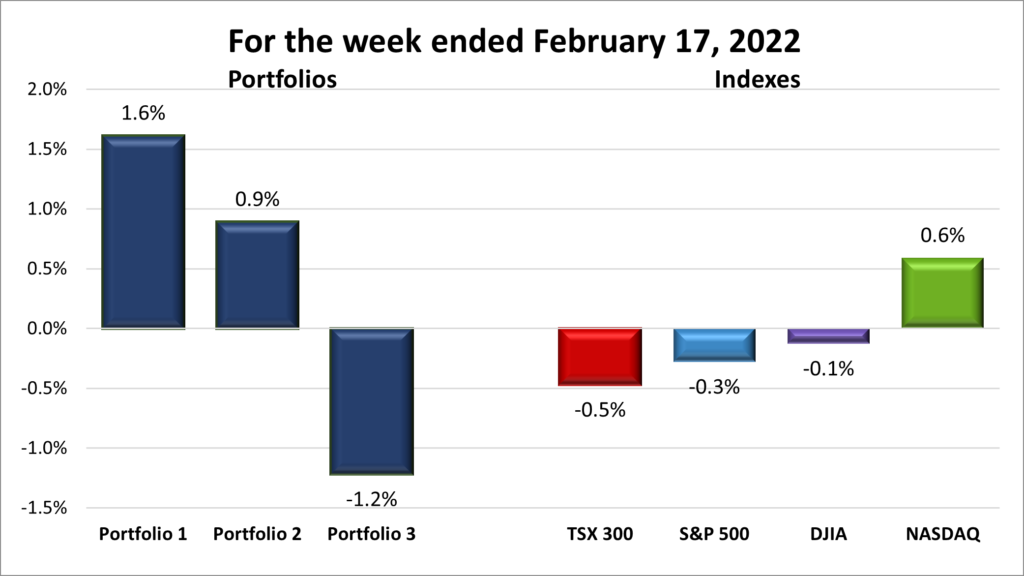
For the week, the TSX advanced 1.8%, the S&P got back in the win column gaining 1.9%, the DJIA returned to positive territory gaining 1.7% and the Nasdaq jumped 2.6%.
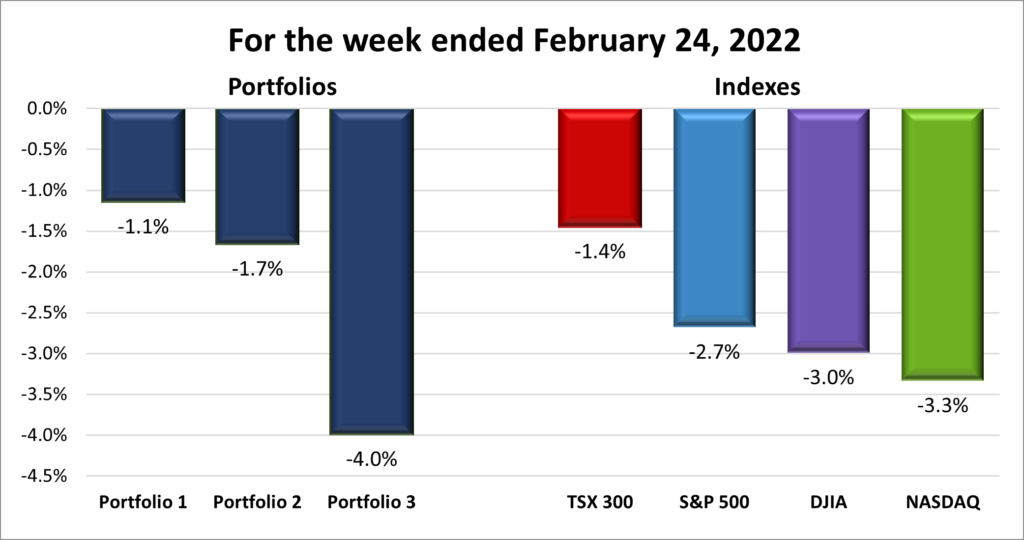
Bull market. A good week for the North American stock markets.The stock markets closed the week on an upswing, with each index back in the win column. Looking at the chart above, its almost like once February was over the stock markets, represented by the indexes, snapped out of their funk. It was a week of good news coming out of America where employment remains strong while inflation is drifting downward. It seems investors have come to grips with higher interest rates for a longer duration but now feel the next increase by the Fed will be 0.25% rather than a feared 0.5% increase. In the current high interest rate environment, the thought of a lower interest rate hike is enough to get investors back into the markets but that seems to be what happened this past week.

Investors moved back into technology companies, lifting the Nasdaq and S&P. It seems on any good news investors pile back into technology companies, not wanting to miss out on any upward momentum. On the TSX, many investors moved back into companies with large amounts of long-term debt, like the amounts that are often associated with energy, mining, and technology companies (long term debt is typically used by energy and mining companies to invest in expensive machinery and equipment while technology companies use debt to keep the company running).

As with the indexes, the three Portfolios were happy to see the end of February as all three posted another weekly gain. Portfolios 1 and 3, both technology company heavy, benefited from the rally in technology companies. Portfolio 2 is like my tortoise in the tortoise and hare race – slow and steady. As long as it keeps growing, I’m happy. 😊

Weekly Portfolio & Index performance
Weekly Portfolio & Index performance for the week ended March 3, 2023.

Monthly Portfolio Review

For February, each of the four indexes ended the month lower. The TSX dropped 2.6%, the S&P fell 2.6%, the DJIA sank 4.2% and the Nasdaq declined 1.1%.

Bearish marketAfter two steps forward in January to start the year with a bang, the markets and indexes took a step back in February. Fortuntely, three of the four indexes are still ahead on a year to date basis. The DJIA is the only index that is lower in 2023. Economic data and comments from Fed drove the markets as skittish investors weighed the chances the Fed would hike rates to a higher level and then keep them there longer than initially expected. In January analysts and investors were hoping for a 0.25% increase, with the optimistic hoping for a pause in increases. This led to a strong January. With the February US economic data, investors feared an interest rate hike of 0.5% and a higher overall interest rate that would remain longer and pushed the three American indexes lower. The Canadian TSX, with its many energy and natural resource companies with their high amounts of long-term debt, also felt the sting of concerns about higher interest rates.

As for the three Portfolios, I am surprised Portfolio 1 was able to post a gain in February. I think the mega cap technology companies in Portfolio 1 kept the portfolio in the green. Portfolio 2’s less risky companies limited its losses. These companies do not grow as fast as riskier technology companies, but they don’t fall as hard. Portfolio 3’s losses were highlighted by Shopify’s 20% drop in share price during the month. In today’s environment, its amazing Portfolio 3 did not drop farther.

Monthly Portfolio & Index performance
Monthly Portfolio & Index performance for February 2023.

Companies on the Radar

Stocks on my Radar
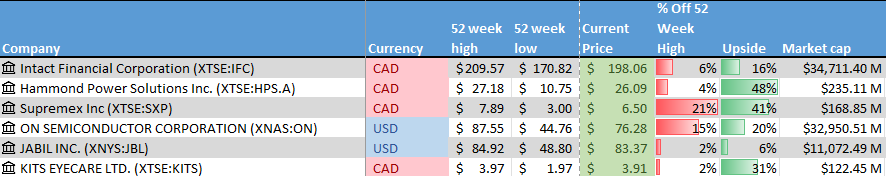
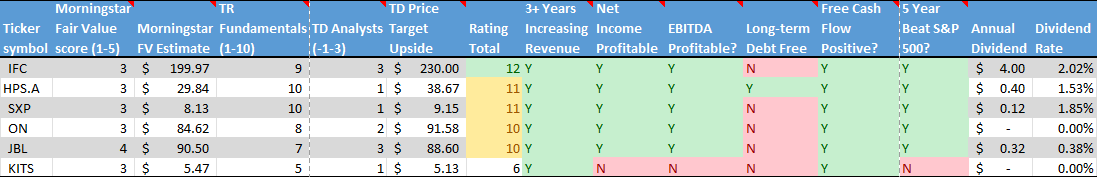
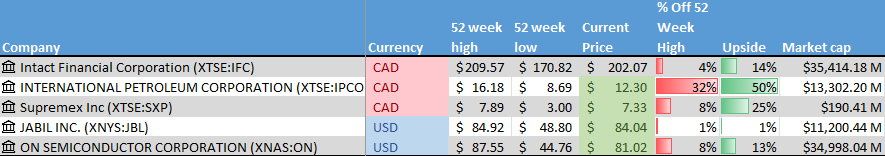
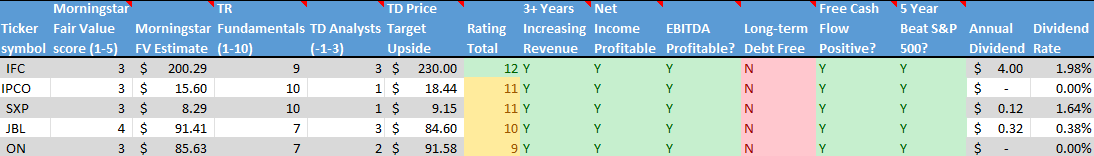
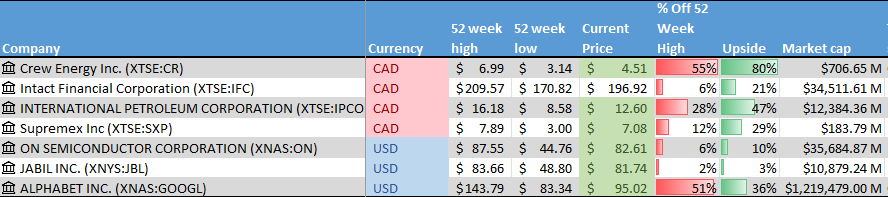
This past week I dropped ON Semiconductor (NASD:ON) from my Radar List because there are already three semiconductor companies in Portfolio 1 – Nvidia (NASD:NVDA), Lattice Semiconductor (NASD:LSCC) and Skyworks Solutions (NASD:SWKS). If I wanted to put more money into semiconductors, I would add to one of those companies. Otherwise, the five companies listed below currently are on my radar.

On a side note, companies on the radar are companies not owned in any of the three portfolios. When it comes to investing in a company, it may be from the list below or a company in one of the Portfolios.

  • Intact Financial (TSX:IFC): a mid size insurance company supplying home, car and business insurance in Canada, the US, and the UK.
  • Hammond Power Solutions (TSX:HPS.A): a Canadian company manufacturing transformers used throughout the world in a wide variety of industries.
  • Supremex (TSX:SXP): a small cap company selling packing solutions throughout Canada and the USA.
  • Jabil Inc. (NYSE:JBL): an American company with global operations that specializes in providing manufacturing services and solutions.
  • Kits Eyecare (TSX:KITS): a Canadian company operating an online eyeglass platform.

The Radar Check was last updated March 3, 2022.

Graphical user interface Description automatically generated

A picture containing graphical user interface Description automatically generated


Portfolio Update

Portfolio 1

Portfolio 1 for the week ended March 3, 2023: UP Green Up Arrow, signifying a positive week

  • Tesla (NASD:TSLA) announced they will build another Gigafactory assembly plant in the northern Mexico industrial hub of Monterrey. It has yet to be determined which vehicles will be produced at the facility. This will be Tesla’s sixth gigafactory (a term coined by Tesla to refer to factories producing electric vehicles at large scale) and third outside the US.
    At Tesla’s Investor Day, the company unveiled ‘Master Plan 3’. Unfortunately, there were no big announcements. They did say their Cybertruck should start shipping later this year, and they are attempting to lower their vehicle assembly costs by 50% (good plan but not big news).
  • In January, General Motors (NYSE:GM) announced they planned to reduce cost by US$ 2 billion without resorting to layoffs. Fast forward and GM announced they would be reducing the headcount of executive level and salaried employees. GM said these were not layoffs, but rather a reduction in structural costs. Hmmm. For those who lost their jobs, I doubt they see the difference.
    A few weeks ago GM announced a major investment in Lithium America Corp (TSX:LAC) to help fund the development of a major lithium mine in Nevada. In return for the investment, GM has exclusive rights to 40,000 tonnes of lithium per year. Not only does this provide a secure supply of lithium, but because the mine is in the US it will qualify for electric vehicle subsidies in the Inflation Reduction Act. Two birds, one stone. Well done GM. 😊
  • Rivian (NASD:RIVN) received the highest marks for customer satisfaction from JD Power. Unfortunately, I do not own a Rivian so I cannot attest to the quality of their vehicles or how Rivian treats its customer. However, I do own a part of the company and it has become a black hole for cash. Rivian has set a new standard for burning through cash, ending 2022 with a negative cash flow of US$ 6.4 billion. Ouch! I knew Rivian’s share price would fall back after shooting up after the IPO, but I never thought the share price would fall so far.
  • Visa (NYSE:V) has decided to delay the launch of their crypto related products and services. After being all the rage in 2020 – 2021, cryptocurrency fell on very tough times in 2022, taking down several cryptocurrency companies. While not abandoning their crypto plans, the company has decided it would be better to wait until the crypto market and the regulations surrounding the industry improve.
  • Alphabet (NASD:GOOGL) announced a second round of layoffs at its Waymo self driving vehicle unit as the company seeks to reduce costs. Driverless cars appear to have surrendered the spotlight to the latest technology – artificial intelligence (AI). After the recent stumble of Google’s Bard chat bot, Google has shifted its focus to AI to maintain its lead in online search.

Activity

No significant activity to report this week.

Dividends

Dividends Received this week for the following companies:

Companies followed by DRIP (Dividend Re-Investment Plan) indicate additional shares were purchased with the dividend. Any cash leftover was added to the cash balance.

Canadian $

Shaw Communications Inc (TSX:SJR.B)

US $

Visa Inc (NYSE:V)

Quarterly Reports

Innovative Industrial Properties, Inc.

All currency listed in thousands of US dollars.

Selected highlights from their fourth quarter 2022 financial results on February 27, 2023

  • Revenue of $70,461 for the three months ended December 31, compared to $58,943 for the same period in 2021. An increase of over 19%.
  • Net income of $41,168 for the three months ended December 31, compared to net income of $28,292 in the same period in 2021.
  • Diluted earnings per ordinary share of $1.46 for the three months ended December 31, compared to earnings per share of $1.14 for the same period in 2021.


  • Revenue of $276,359 for the year ended December 31, compared to $204,551 for the same period in 2021. An increase of over 35%.
  • Net earnings of $153,034 for the year ended December 31, compared to net earnings of $112,638 in the same period in 2021.
  • Diluted earnings per ordinary share of $5.52 for the year ended December 31, compared to earnings per share of $4.55 for the same period in 2021.

fuboTV Inc.

All currency listed in thousands of US dollars.

Selected highlights from their fourth quarter 2022 financial results on February 27, 2023

  • Revenue of $319,315 for the three months ended December 31, compared to $231,077 for the same period in 2021. An increase of over 39%.
  • Net loss of $152,082 for the three months ended December 31, compared to net loss of $111,892 in the same period in 2021.
  • Diluted loss per ordinary share of $0.76 for the three months ended December 31, compared to a loss per share of $0.76 for the same period in 2021.


  • Revenue of $1,008,696 for the year ended December 31, compared to $638,370 for the same period in 2021. An increase of over 58%.
  • Net loss of $561,919 for the year ended December 31, compared to net loss of $382,963 in the same period in 2021.
  • Diluted loss per ordinary share of $3.08 for the year ended December 31, compared to a loss per share of $2.78 for the same period in 2021.

Progeny, Inc.

All currency listed in thousands of US dollars.

Selected highlights from their fourth quarter 2022 financial results on February 27, 2023

  • Revenue of $214,321 for the three months ended December 31, compared to $127,553 for the same period in 2021. An increase of over 68%.
  • Net income of $3,408 for the three months ended December 31, compared to net income of $15,080 in the same period in 2021.
  • Diluted earnings per ordinary share of $0.03 for the three months ended December 31, compared to earnings per share of $0.15 for the same period in 2021.


  • Revenue of $786,913 for the year ended December 31, compared to $500,621 for the same period in 2021. An increase of over 57%.
  • Net earnings of $30,358 for the year ended December 31, compared to net earnings of $65,769 in the same period in 2021.
  • Diluted earnings per ordinary share of $0.30 for the year ended December 31, compared to earnings per share of $0.66 for the same period in 2021.

Marqueta, Inc.

All currency listed in thousands of US dollars.

Selected highlights from their fourth quarter 2022 financial results on February 28, 2023

  • Revenue of $203,805 for the three months ended December 31, compared to $155,414 for the same period in 2021. An increase of over 31%.
  • Net loss of $26,326 for the three months ended December 31, compared to net loss of $36,807 in the same period in 2021.
  • Diluted loss per ordinary share of $0.05 for the three months ended December 31, compared to loss per share of $0.07 for the same period in 2021.


  • Revenue of $7748,206 for the year ended December 31, compared to $517,175 for the same period in 2021. An increase of over 44%.
  • Net loss of $184,780 for the year ended December 31, compared to net loss of $163,929 in the same period in 2021.
  • Diluted loss per ordinary share of $0.34 for the year ended December 31, compared to loss per share of $0.45 for the same period in 2021.

Scotiabank

All currency listed in millions of Canadian dollars.

Selected highlights from their first quarter 2021 financial results on February 27, 2023

  • Revenue of $7,980 for the three months ended January 31, compared to $8,049 for the same period in 2022. A decrease of less than 1%.
  • Net income of $1,172 for the three months ended January 31, compared to net income of $2,740 in the same period in 2021.
  • Diluted earnings per ordinary share of $1.36 for the three months ended December 31, compared to earnings per share of $2.14 for the same period in 2021.

Rivian Automotive Inc.

All currency listed in millions of US dollars.

Selected highlights from their fourth quarter 2022 financial results on February 28, 2023

  • Revenue of $663 for the three months ended December 31, compared to $54 for the same period in 2021. An increase of over 1,227%.
  • Net loss of $1,795 for the three months ended December 31, compared to net loss of $2,461 in the same period in 2021.
  • Diluted loss per ordinary share of $1.87 for the three months ended December 31, compared to a loss per share of $4.83 for the same period in 2021.


  • Revenue of $1,658 for the year ended December 31, compared to $55 for the same period in 2021. An increase of over 3,014%.
  • Net loss of $6,752 for the year ended December 31, compared to net loss of $4,688 in the same period in 2021.
  • Diluted loss per ordinary share of $7.40 for the year ended December 31, compared to a loss per share of $22.98 for the same period in 2021.

Trisura Group Ltd.

All currency listed in thousands of Canadian dollars.

Selected highlights from their fourth quarter 2022 financial results on February 28, 2023

  • Revenue of $149,320 for the three months ended December 31, compared to $106,549 for the same period in 2021. An increase of over 40%.
  • Net loss of $40,340 for the three months ended December 31, compared to net income of $10,295 in the same period in 2021.
  • Diluted loss per ordinary share of $0.86 for the three months ended December 31, compared to earnings per share of $0.24 for the same period in 2021.


  • Revenue of $526,102 for the year ended December 31, compared to $349,877 for the same period in 2021. An increase of over 98%.
  • Net earnings of $24,651 for the year ended December 31, compared to net earnings of $62,559 in the same period in 2021.
  • Diluted earnings per ordinary share of $1.87 for the year ended December 31, compared to earnings per share of $1.47 for the same period in 2021.

Celsius Holdings, Inc.

All currency listed in thousands of US dollars.

Selected highlights from their fourth quarter 2022 financial results on March 1, 2023

  • Revenue of $177,964 for the three months ended December 31, compared to $104,254 for the same period in 2021. An increase of almost 71%.
  • Net loss of $21,223 for the three months ended December 31, compared to net income of $11,942 in the same period in 2021.
  • Diluted loss per ordinary share of $0.37 for the three months ended December 31, compared to earnings per share of $0.15 for the same period in 2021.


  • Revenue of $653,604 for the year ended December 31, compared to $314,272 for the same period in 2021. An increase of over 73%.
  • Net loss of $187,282 for the year ended December 31, compared to net earnings of $3,937 in the same period in 2021.
  • Diluted loss per ordinary share of $2.63 for the year ended December 31, compared to earnings per share of $0.05 for the same period in 2021.

GDI Integrated Facility Services Inc.

All currency listed in millions of Canadian dollars.

Selected highlights from their fourth quarter 2022 financial results on March 1, 2023

  • Revenue of $588 for the three months ended December 31, compared to $433 for the same period in 2021. An increase of almost 37%.
  • Net income of $10 for the three months ended December 31, compared to net income of $7 in the same period in 2021.
  • Diluted earnings per ordinary share of $0.40 for the three months ended December 31, compared to earnings per share of $0.29 for the same period in 2021.


  • Revenue of $2,172 for the year ended December 31, compared to $1,597 for the same period in 2021. An increase of over 36%.
  • Net earnings of $36 for the year ended December 31, compared to net earnings of $43 in the same period in 2021.
  • Diluted earnings per ordinary share of $1.53 for the year ended December 31, compared to earnings per share of $1.84 for the same period in 2021.

Viemed Healthcare, Inc.

All currency listed in thousands of US dollars.

Selected highlights from their fourth quarter 2022 financial results on March 3, 2023

  • Revenue of $37,508 for the three months ended December 31, compared to $31,962 for the same period in 2021. An increase of over 17%.
  • Net income of $2,438 for the three months ended December 31, compared to net income of $4,087 in the same period in 2021.
  • Diluted earnings per ordinary share of $0.06 for the three months ended December 31, compared to earnings per share of $0.10 for the same period in 2021.


  • Revenue of $138,832 for the year ended December 31, compared to $117,062 for the same period in 2021. An increase of almost 19%.
  • Net earnings of $6,222 for the year ended December 31, compared to net earnings of $9,126 in the same period in 2021.
  • Diluted earnings per ordinary share of $0.16 for the year ended December 31, compared to earnings per share of $0.22 for the same period in 2021.

TD Bank Group

All currency listed in millions of Canadian dollars.

Selected highlights from their first quarter 2023 financial results on March 2, 2023

  • Revenue of $12,226 for the three months ended December 31, compared to $11,281 for the same period in 2021. An increase of over 8%.
  • Net income of $1,582 for the three months ended December 31, compared to net income of $3,733 in the same period in 2021.
  • Diluted earnings per ordinary share of $0.82 for the three months ended December 31, compared to earnings per share of $2.02 for the same period in 2021.

Andlaeur Healthcare Group Inc.

All currency listed in thousands of Canadian dollars.

Selected highlights from their fourth quarter 2022 financial results on March 2, 2023

  • Revenue of $165,772 for the three months ended December 31, compared to $133,025 for the same period in 2021. An increase of almost 25%.
  • Net income of $19,824 for the three months ended December 31, compared to net income of $53,104 in the same period in 2021.
  • Diluted earnings per ordinary share of $0.46 for the three months ended December 31, compared to earnings per share of $1.26 for the same period in 2021.


  • Revenue of $648,423 for the year ended December 31, compared to $440,115 for the same period in 2021. An increase of over 47%.
  • Net earnings of $76,275 for the year ended December 31, compared to net earnings of $89,954 in the same period in 2021.
  • Diluted earnings per ordinary share of $1.79 for the year ended December 31, compared to earnings per share of $2.25 for the same period in 2021.

Portfolio 2

Portfolio 2 for the week ended March 3, 2023: UP Green Up Arrow, signifying a positive week

  • Microsoft (NASD:MSFT) started rolling out an AI enhanced Bing to its Windows 11 operating system. After you install the latest updates from Microsoft, a Bing logo appears on the Taskbar. When you click the logo, it launches an updated Bing search page in Microsoft’s Edge browser. When you ask a question the response comes back with a typical list of websites, plus a new chat window on the right side with an answer.
    It seems the ten year licensing deals Microsoft is signing with video game rivals will be enough for the European Commission to approve Microsoft’s acquisition of Blizzard Activision (NASD:ATVI). This is a big win for Microsoft since they will not have to divest any assets to gain the European Commission’s approval.
  • Walt Disney’s (NYSE:DIS) almost 50 years of self rule in Florida is coming to an end. Next week the new oversight board will meet for the first time. Among other tings the board will consider is Disney’s plans for an additional three theme parks over the next five years.

Activity

No significant activity to report this week.

Dividends

Dividends Received this week for the following companies:

Companies followed by DRIP (Dividend Re-Investment Plan) indicate additional shares were purchased with the dividend. Any cash leftover was added to the cash balance.

Canadian $

Dream Industrial Real Estate Investment Trust (TSX:DIR.UN) DRIP

US $

No US$ dividends this past week.

Quarterly Reports

Scotiabank

All currency listed in millions of Canadian dollars

Selected highlights from their first quarter 2021 financial results on February 27, 2023

  • Revenue of $7,980 for the three months ended January 31, compared to $8,049 for the same period in 2022. A decrease of less than 1%.
  • Net income of $1,172 for the three months ended January 31, compared to net income of $2,740 in the same period in 2021.
  • Diluted earnings per ordinary share of $1.36 for the three months ended December 31, compared to earnings per share of $2.14 for the same period in 2021.

Canadian Natural Resources Ltd.

All currency listed in millions of Canadian dollars.

Selected highlights from their fourth quarter 2022 financial results on March 2, 2023

  • Revenue of $9,689 for the three months ended December 31, compared to $9,213 for the same period in 2021. An increase of over 5%.
  • Net income of $1,520 for the three months ended December 31, compared to net income of $2,534 in the same period in 2021.
  • Diluted earnings per ordinary share of $1.36 for the three months ended December 31, compared to $2.14 for the same period in 2021.


  • Revenue of $42,298 for the year ended December 31, compared to $30,057 for the same period in 2021. An increase of over 40%.
  • Net earnings of $10,937 for the year ended December 31, compared to net earnings of $7,664 in the same period in 2021.
  • Diluted earnings per ordinary share of $9.52 for the year ended December 31, compared to $6.46 for the same period in 2021.

Portfolio 3

Portfolio 3 for the week ended March 3, 2023, 2023: UP Green Up Arrow, signifying a positive week

  • TD Bank (TSX:TD) has agreed to pay US$ 1.2 billion for its alleged part in a US$ 7 billion Ponzi scheme run by Allen Stanford of Stanford International Bank Ltd. The money will be used to pay people who had unknowingly participated in the program.

Activity

No significant activity to report this week.

Dividends

Dividends Received this week for the following companies:

Companies followed by DRIP (Dividend Re-Investment Plan) indicate additional shares were purchased with the dividend. Any cash leftover was added to the cash balance.

Canadian $

Enghouse Systems Ltd (TSX:ENGH)

US $

No US$ dividends this past week.

Quarterly Reports

Royal Bank of Canada

All currency listed in millions of Canadian dollars.

Selected highlights from their first quarter 2023 financial results on March 1, 2023

  • Revenue of $15,094 for the three months ended December 31, compared to $13,066 for the same period in 2021. An increase of over 15%.
  • Net income of $3,214 for the three months ended December 31, compared to net income of $4,095 in the same period in 2021.
  • Diluted earnings per ordinary share of $2.29 for the three months ended December 31, compared to earnings per share of $2.84 for the same period in 2021.

GDI Integrated Facility Services Inc.

All currency listed in millions of Canadian dollars.

Selected highlights from their fourth quarter 2022 financial results on March 1, 2023

  • Revenue of $588 for the three months ended December 31, compared to $433 for the same period in 2021. An increase of almost 37%.
  • Net income of $10 for the three months ended December 31, compared to net income of $7 in the same period in 2021.
  • Diluted earnings per ordinary share of $0.40 for the three months ended December 31, compared to earnings per share of $0.29 for the same period in 2021.


  • Revenue of $2,172 for the year ended December 31, compared to $1,597 for the same period in 2021. An increase of over 36%.
  • Net earnings of $36 for the year ended December 31, compared to net earnings of $43 in the same period in 2021.
  • Diluted earnings per ordinary share of $1.53 for the year ended December 31, compared to earnings per share of $1.84 for the same period in 2021.

TD Bank Group

All currency listed in millions of Canadian dollars.

Selected highlights from their first quarter 2023 financial results on March 2, 2023

  • Revenue of $12,226 for the three months ended December 31, compared to $11,281 for the same period in 2021. An increase of over 8%.
  • Net income of $1,582 for the three months ended December 31, compared to net income of $3,733 in the same period in 2021.
  • Diluted earnings per ordinary share of $0.82 for the three months ended December 31, compared to earnings per share of $2.02 for the same period in 2021.

Viemed Healthcare, Inc.

All currency listed in thousands of US dollars.

Selected highlights from their fourth quarter 2022 financial results on March 3, 2023

  • Revenue of $37,508 for the three months ended December 31, compared to $31,962 for the same period in 2021. An increase of over 17%.
  • Net income of $2,438 for the three months ended December 31, compared to net income of $4,087 in the same period in 2021.
  • Diluted earnings per ordinary share of $0.06 for the three months ended December 31, compared to earnings per share of $0.10 for the same period in 2021.


  • Revenue of $138,832 for the year ended December 31, compared to $117,062 for the same period in 2021. An increase of almost 19%.
  • Net earnings of $6,222 for the year ended December 31, compared to net earnings of $9,126 in the same period in 2021.
  • Diluted earnings per ordinary share of $0.16 for the year ended December 31, compared to earnings per share of $0.22 for the same period in 2021.


Weekly Update for the week ending February 24, 2023

Items that may only interest or educate me ….

Canadian CPI, landings, Canadian deficit, a bunch of US data …


The Canadian Consumer Price Index (CPI) dropped to 5.9% on a year over year basis but rose by 0.5% compared to December. Economists had anticipated 6.2% and 0.7%, respectively. The main driver of inflation was higher grocery and restaurant prices, which were up 10.4% on a yearly basis. Core CPI (CPI less energy and food) rose 4.9% on a yearly basis, down from December’s 5.3% increase.

The latest CPI rate was a pleasant surprise as it was the first time since February 2022 that inflation was below 6%, when it was 5.7%. The lower-than-expected rise in inflation is a good counter to the higher-than-expected jobs report. It should allow the Bank of Canada (BoC) to stay the course on its plan to pause hikes to Canada’s benchmark interest rate. It’s still early but the BoC decision to conditionally pause interest rate hikes looks like it will last at least through their next session on March 8.


‘Hard landing’, ‘soft landing’, now ‘no landing’. No, I’m not talking about a plane. Rather, a landing is how an economy transitions from a period of growth to a period of stability (soft) or contraction (hard). A ‘no landing’ is when global economic growth is robust, and inflation remains higher for longer. For months, analysts and investors have been talking about whether the BoC and the US Federal Reserve (Fed) can avoid a ‘hard landing’ or thread the needle with a ‘soft landing’.

Recent Canadian data showing surprisingly strong employment numbers with cooling year over year inflation numbers suggests the BoC may pull off a soft landing. However, in the US of A, strong employment with inflation remaining high is causing investors to consider the ‘no landing’ scenario. At the start of the year, analysts were suggesting the Fed would pause interest rate hikes but the recent minutes from the Fed’s last meeting indicate there are more hikes ahead. Analysts are now almost certain the benchmark interest rate will rise above 5% and are unlikely to decline until 2024. Concern now is unless the economy cools and inflation starts to fall, the interest rate could reach 6%. The higher the interest rates, the more expensive it is to borrow money. Companies must funnel more cash to pay down debt rather than invest it in themselves, thus slowing down their growth.

Let’s hope both the Canadian and American economic planes are able to pull off soft landings because the other two options are not good. A recession or higher interest rates we can all do without.


The Canadian deficit for the period April 1, 2022, through December 31, 2022 came in at C$ 5.54 billion. Not a small number by any measure but much better than the C$ 70.11 billion recorded the previous year. On a monthly basis, Canada had a C$ 1.98 billon deficit in December 2022 compared to a deficit of C$ 3.58 billion the previous December.

Thanks to higher interest rates and surging oil prices, government revenues were up 11.4%. Expenses dropped 12.3% as Covid-19 programs came to an end. Let’s hope the government keeps reeling in expenses. It would be even better if they could focus on paying down Canada’s debt to free up money for other needs.


An array of US economic data this past week revealed weekly jobless claims fell; Gross Domestic Product grew 2.7% in the fourth quarter; consumer spending had its biggest jump in two years, rising 1.8% in January; and wages rose by 0.9%. Topping it off was data from one of the Fed’s most watched inflation gauges, the US Personal Consumption Expenditures (PCE) index, jumped 0.6% in January after gaining only 0.2% in December. On a yearly basis, the PCE was up 5.4% in January, barely higher than December’s 5.3%. The core PCE (PCE less food and energy components) gained 0.6%, up from December’s 0.4%. On a yearly basis, core PCE increased 4.7% for January, higher than December’s 4.6%.

What does all this data mean? Besides causing eyes to glaze over, all the numbers suggest the Fed will boost the US benchmark interest rate by at least 0.25% in March, followed by another 0.25% or more increase in May. In other words, the US interest rate is going up and will stay up longer.

It seems counterintuitive but in inflationary times, such as the one we are currently in, good employment news is bad for the markets. More people working, making more money, means more demand for goods. More demand leads to higher prices and a hot economy. Unfortunately, it often requires higher interest rate to cool off the economy.


If you managed to wade through all those numbers, let’s see what happened in the markets this past week….

Weekly Market Review

Monday: the Toronto Stock Exchange Composite Index (TSX), the S&P 500 Index (S&P), the Dow Jones Industrial Average (DJIA), and the Nasdaq Composite Index (Nasdaq) – were closed for Family Day in Canada and Presidents Day in the US.

Tuesday: The short week got off to a rough start as all four major North American indexes ended down sharply. Investors were concerned about ongoing inflation and starting to believe the Fed when they say interest rates could be higher for longer.

In Canada, the TSX closed at a six-week low despite the January Consumer Price Index (CPI) data showing inflation in Canada fell to 5.9%. This lower than expected inflation rate should help the Bank of Canada hold the line on the benchmark Canadian interest rate at the next session. It was a full on retreat in the Canadian sectors with the Telecommunications Services and Industrials down the least, while the interest sensitive Technology and Consumer Cyclicals fell the farthest.

In the US, it was the biggest drop in the US markets since mid December. By the end of the day, the DJIA had given back all its gains in 2023. As well as fears of higher, longer US interest rates, big box retailers Home Depot (NYSE:HD) and Walmart (NYSE:WMT) both had unimpressive earnings reports and disappointing forecasts for 2023. In trading, it was a broad-based collapse in the US sectors with Consumer Cyclicals and Energy down the least and Consumer Cyclicals and Technology down the most.

Wednesday: Another yoyo day in the markets, ending in mixed results. Only the Nasdaq was able to end the day higher than it started, breaking its three-day losing streak. Investors waited for the minutes from the last Fed meeting which revealed the Fed felt further interest rate hikes would be necessary, however, at a slower pace. Oil prices continue to fall as investors are becoming concerned higher interest rates will slow economic growth which in turn will slow fuel demand.

In Canada, the TSX experienced its fourth straight day of declines, largely on falling energy prices. On the Toronto Stock Exchange (TSE), Consumer Cyclicals and Technology were the biggest gainers of the Canadian sectors, while Basic Materials (miners and fertilizer manufacturers) dropped the most.

In the US, the S&P and DJIA dropped into the red at the end of the trading day, extending their losing streaks to four days. On Wall Street, it was another day of across the board declines for the three American indexes. Consumer Staples and Technology sectors did the best of the American S&P sectors, falling the least, while Industrials and Financials fell the most.

Thursday: Fears of future increases to the US interest rate sent the four indexes on quite the ride. The three American indexes were able to climb into the green at the end of the day, while the TSX tipped into the red at the last minute. The price of oil rebounded in anticipation of Russia drastically cutting oil production in March, and increased demand from China.

In Canada, the TSX ran its losing streak to five on concerns Canadian banks will report lower than expected earnings. In the market, the Canadian sectors Healthcare and Energy advanced the most while the Basic Materials and Financials dropped the most.

In the US, the S&P and DJIA joined the Nasdaq on the winning side for the first time this week. The latest economic data showed new unemployment claims fell last week indicating the jobs market is still strong. Another report showed the US Gross Domestic Product grew 2.7%, indicating the US economy continues to grow. While this is good news for American workers, its likely to cause the Fed to once again raise the US interest rate. In trading today, the American Energy and Technology sectors posted the largest advances, while Telecommunications Services and Utilities had the biggest declines.

Friday: It was a tale of two countries as the TSX nudged above the line at the end of the day while the three American indexes dropped sharply and stayed there for the rest of the day. Ongoing concerns about a cutback in Russian oil exports tightening global oil supplies caused oil prices to rise for the second straight day.

In Canada, higher energy prices and a strong earnings report from one of Canada’s big six banks were enough to overcome the drag of strong US economic, pulling the TSX into the green. In the Canadian market, only the Energy, Consumer Staples and Financials ended the day higher. Of the remaining Canadian sectors, Technology and healthcare dropped the most.

South of the 49th, the latest US economic data showed US inflation was falling slower than the Fed had hoped, causing the three American indexes to post their biggest weekly drop of 2023. Investors are worried about the Fed will raise the interest rate aggressively at their next meeting, and rates will stay higher, longer. In the US markets, Energy was the only American sector to advance, while Technology and Consumer Cyclicals fell the farthest.


For the week, the TSX dropped 1.4%, the S&P 500 fell 2.7%, the Dow posted its fourth straight weekly decline, dropping 3.0% and the Nasdaq tumbled 3.3%.

Weekly Portfolio Review

Bearish market

For the second time this month, all four major North American indexes lost ground, as you can see above. If it wasn’t for the Nasdaq advancing last week, all three American indexes wouldn’t have a positive week since the end of January. Unlike last week, all four indexes dropped sharply on the first day of a short week, drifted upward and dropped sharply to close out the week. Once again, the main driver of the markets was fear of how the Fed would interpret strong US economic data. Where investors once felt the end of interest rate hikes was near, they now feel not only will rates go higher, but they will stick around longer.

The TSX was not immune to negative investor sentiment as it was caught by the undertow caused by the Fed on the US markets.

As for the three Portfolios, it was no surprise they all fell lower, as shown in the chart below. With not one index ending the week in positive territory, I had little hope they could repeat last week’s performance and end in the green when three of four indexes were in the red. There was no single company responsible for the downfall of a portfolio. Investor fear of rate hikes sent the markets lower, and the portfolios dropped with the outgoing tide.

Weekly Portfolio & Index performance
Weekly Portfolio & Index performance for the week ended February 24, 2023.

Companies on the Radar

Stocks on my RadarA few small cap companies came onto the radar this past week. The first is Kits Eyecare (TSX:KITS), a Canadian company operating an online eyeglass platform. The other company is Hammond Power Solutions (TSX:HPS.A), another Canadian company manufacturing transformers used in a wide variety of industries worldwide. Given the increase of electrification, this could be an interesting opportunity. I know nothing about either company, so I need to dig deeper to understand their respective industries, how they fit into the industry, their potential and their risks.

Goodbye to International Petroleum (TSX:IPCO). The Energy sector in general continues to drift lower on fears higher interest rates will lead to lower demand. I think there are better opportunities outside the Energy sector, such as the four below, and perhaps the two mentioned above.

  • Intact Financial (TSX:IFC): a mid size insurance company supplying home, car and business insurance in Canada, the US, and the UK.
  • Supremex: (TSX:SXP) a small cap company selling packing solutions throughout Canada and the USA.
  • ON Semiconductor (NASD:ON) an American company that makes intelligent sensor and power solutions that enable the electrification of the automotive industry.
  • Jabil Inc. (NYSE:JBL), an American company with global operations that specializes in providing manufacturing services and solutions.

The Radar Check was last updated February 24, 2022.

Graphical user interface, application Description automatically generated with medium confidence

A picture containing application Description automatically generated


Portfolio Update

Portfolio 1

Portfolio 1 for the week ended February 24, 2023: DOWN Red Down Arrow

  • After surging demand for Home Depot products during the pandemic years, the company is reporting slowing demand for home improvement supplies as inflation has made home projects more expensive. As well as higher cost for products, Home Depot is increasing wages across the board to retain staff. Slowing revenue growth and growing expenses is not a good combination.
  • Amazon’s (NASD:AMZN) Amazon Web Services (AWS) is developing their own artificial intelligence (AI) chatbot to help AWS developers integrate AI into their own products.
  • Apple (NASD:AAPL) is working on way to measure a person’s glucose level without the need to draw blood. It would be great if Apple could develop a non-invasive and continuous glucose monitoring device for diabetics everywhere. It would also open new opportunities in a new sector (healthcare) that many investors never considered when they invested in Apple.
  • Alphabet (NASD:GOOGL) has partnered with Mercedes Benz (OTCM:MBGYY) to provide super computer like performance in every Mercedes outfitted with automated driving sensors. The partnership will offer real time traffic information and rerouting, the ability to stream YouTube on a vehicle’s entertainment system, along with other Google apps such as Google Maps and Google Assistant.
    To ensure a supply of advanced semiconductors for Mercedes’s new smart cars, Mercedes struck a revenue sharing agreement with Nvidia (NASD:NVDA).
  • Nvidia posted higher than expected earnings on the strength of demand for its advanced chips that are used in AI systems. Nvidia has become the de facto chipmaker for data centres, the metaverse and now AI. I don’t know who will win the AI arms race – Microsoft, Google, or someone else – but Nvidia is most likely to be the chips powering the AI engines.
  • General Motors (NYSE:GM) plans to suspend production at one of its truck plants due to slowing demand. The last time production was suspended at the manufacturing facility was due to supply chain issues brought on by the pandemic. Now, the higher cost of borrowing money is making it more expensive to buy a new vehicle and lowering demand.

Activity

Sold: Trisura Group Ltd. (TSX:TSU) has done very well for me but they rescheduled their fourth quarter earnings report to as yet unnamed date. I can’t think of any positive reason to pushback an earnings announcement. Its likely they are negotiating with auditors over how to present some bad news and put a positive spin on it. When the earnings come out, I suspect the share price will take a hit. I’ve done well with Trisura and barring a major problem, I plan to buy back the shares once the bad news is baked into the price. Hopefully make a few bucks. 😊

Dividends

Dividends Received this week for the following companies:

Companies followed by DRIP (Dividend Re-Investment Plan) indicate additional shares were purchased with the dividend. Any cash leftover was added to the cash balance.

Canadian $

Quinsam Capital Corp (TSX:QCA)

US $

No US$ dividends this past week.

Quarterly Reports

Home Depot Inc.

All currency listed in millions of US dollars, except per share data.

Selected highlights from their fourth quarter 2022 financial results on February 21, 2023

  • Revenue of $35,831 for the three months ended December 31, compared to $35,719 for the same period in 2021. An increase of 0.3%.
  • Net income of $3,362 for the three months ended December 31, compared to net income of $3,352 in the same period in 2021.
  • Diluted earnings per ordinary share of $3.30 for the three months ended December 31, compared to $3.23 for the same period in 2021.


  • Revenue of $157,403 for the year ended December 31, compared to $4151,157 for the same period in 2021. An increase of over 4%.
  • Net earnings of $17,105 for the year ended December 31, compared to net earnings of $16,433 in the same period in 2021.
  • Diluted earnings per ordinary share of $16.69 for the year ended December 31, compared to $15.53 for the same period in 2021.

Kneat.com Inc.

All currency listed in Canadian dollars, except per share data.

Selected highlights from their fourth quarter 2022 financial results on February 22, 2023

  • Revenue of $7,250,039 for the three months ended December 31, compared to $6,263,039 for the same period in 2021. An increase of almost 18%.
  • Net income of $458,919 for the three months ended December 31, compared to net loss of $1,549,736 in the same period in 2021.
  • Diluted earnings per ordinary share of $0.01 for the three months ended December 31, compared to a loss per share of $0.02 for the same period in 2021.


  • Revenue of $23,749,201 for the year ended December 31, compared to $15,501,350 for the same period in 2021. An increase of over 73%.
  • Net loss of $9,148,188 for the year ended December 31, compared to net loss of $9,858,528 in the same period in 2021.
  • Diluted loss per ordinary share of $0.12 for the year ended December 31, compared to a loss per share of $0.13 for the same period in 2021.

Teledoc Health, Inc.

All currency listed in thousands of US dollars, except per share data.

Selected highlights from their fourth quarter 2022 financial results on February 22, 2023

  • Revenue of $637,709 for the three months ended December 31, compared to $554,235 for the same period in 2021. An increase of over 15%.
  • Net loss of $3,180,071 for the three months ended December 31, compared to net loss of $10,985 in the same period in 2021.
  • Diluted loss per ordinary share of $23.49 for the three months ended December 31, compared to a loss per share of to $0.07 for the same period in 2021.


  • Revenue of $2,406,840 for the year ended December 31, compared to $2,032,707 for the same period in 2021. An increase of over 18%.
  • Net loss of $13,659,531 the year ended December 31, compared to net loss of $428,793 in the same period in 2021.
  • Diluted earnings per ordinary share of $84.60 for the year ended December 31, compared to a loss per share of $2.73 for the same period in 2021.

Magnite, Inc.

All currency listed in thousands of US dollars, except per share data

Selected highlights from their fourth quarter 2022 financial results on February 22, 2023

  • Revenue of $175,399 for the three months ended December 31, compared to $161,286 for the same period in 2021. An increase of over 8%.
  • Net loss of $36,385 for the three months ended December 31, compared to net income of $453 in the same period in 2021.
  • Diluted loss per ordinary share of $0.27 for the three months ended December 31, compared to $0 for the same period in 2021.


  • Revenue of $577,069 for the year ended December 31, compared to $468,413 for the same period in 2021. An increase of over 23%.
  • Net loss of $130,323 for the year ended December 31, compared to net earnings of $65 in the same period in 2021.
  • Diluted loss per ordinary share of $0.98 for the year ended December 31, compared to $0 for the same period in 2021.

Global-e Online Ltd.

All currency listed in thousands of US dollars, except per share data.

Selected highlights from their fourth quarter 2022 financial results on February 22, 2023

  • Revenue of $82,717 for the three months ended December 31, compared to $139,865 for the same period in 2021. A decrease of over 40%.
  • Net loss of $22,491 for the three months ended December 31, compared to net loss of $28,471 in the same period in 2021.
  • Diluted loss per ordinary share of $0.15 for the three months ended December 31, compared to a loss of $0.18 for the same period in 2021.


  • Revenue of $7245,274 for the year ended December 31, compared to $409,049 for the same period in 2021. A decrease of over 40%.
  • Net loss of $74,933 for the year ended December 31, compared to net loss of $195,405 in the same period in 2021.
  • Diluted loss per ordinary share of $0.74 for the year ended December 31, compared to a loss per share of $1.24 for the same period in 2021.

Nvidia Corp.

All currency listed in millions of US dollars, except per share data.

Selected highlights from their fourth quarter 2022 financial results on February 22, 2023

  • Revenue of $6,051 for the three months ended December 31, compared to $7,643 for the same period in 2021. A decrease of almost 21%.
  • Net income of $1,414 for the three months ended December 31, compared to net income of $3,003 in the same period in 2021.
  • Diluted earnings per ordinary share of $0.57 for the three months ended December 31, compared to $1.18 for the same period in 2021.


  • Revenue of $26,974 for the year ended December 31, compared to $26,914 for the same period in 2021. An increase of less than 1%.
  • Net earnings of $4,368 for the year ended December 31, compared to net earnings of $9,752 in the same period in 2021.
  • Diluted earnings per ordinary share of $1.74 for the year ended December 31, compared to $3.85 for the same period in 2021.

Unity Software Inc.

All currency listed in thousands of US dollars, except per share data

Selected highlights from their fourth quarter 2022 financial results on February 22, 2023

  • Revenue of $450,974 for the three months ended December 31, compared to $315,864 for the same period in 2021. An increase of almost 43%.
  • Net loss of $287,754 for the three months ended December 31, compared to net loss of $161,653 in the same period in 2021.
  • Diluted loss per ordinary share of $0.82 for the three months ended December 31, compared to a loss per share of $0.56 for the same period in 2021.


  • Revenue of $1,391,024 for the year ended December 31, compared to $1,110,526 for the same period in 2021. An increase of over 25%.
  • Net loss of $919,488 for the year ended December 31, compared to net loss of $533,047 in the same period in 2021.
  • Diluted loss per ordinary share of $2.96 for the year ended December 31, compared to a loss per share of $1.89 for the same period in 2021.

Portfolio 2

Portfolio 2 for the week ended February 24, 2023: DOWN Red Down Arrow

  • Walt Disney’s (NYSE:DIS) ‘Avatar: The Way of Water’ became the third highest-grossing film of all time worldwide over the weekend, with revenues of US$ 2.24 billion.
  • Kneat.com (TSX:KSI) signed a three-year deal with a global healthcare company. The company will initially deploy Kneat’s Kneat Gx solution to replace a paper intensive process for one business unit, and upgrade two other units from a hybrid (manual/digital) process to a full digital process.
  • Telus (TSX:T) has teamed up with Amazon’s AWS to develop Telus’s smart living solution. The service will make it easier for Telus customers to install and manage the growing number of ‘smart’ home devices and services.

Activity

Singapore’s GIC (managers of Singapore’s foreign reserves) and Dream Industrial Real Estate Income Trust (REIT) (TSX:DIR.UN) closed their acquisition of Summit Industrial Income REIT. Summit unitholders received C$ 23.50 per unit. I made an initial investment in 2018, with a second investment in 2020. Not a bad return on an investment that cost an average C$ 11.30. Fortunately, this investment is in a Tax-Free Savings Account so there is no tax on the capital gains. 😊

Dividends

Dividends Received this week for the following companies:

Companies followed by DRIP (Dividend Re-Investment Plan) indicate additional shares were purchased with the dividend. Any cash leftover was added to the cash balance.

No dividends this past week.

Quarterly Reports

Kneat.com Inc.

All currency listed in Canadian dollars, except per share data.

Selected highlights from their fourth quarter 2022 financial results on February 22, 2023

  • Revenue of $7,250,039 for the three months ended December 31, compared to $6,263,039 for the same period in 2021. An increase of almost 18%.
  • Net income of $458,919 for the three months ended December 31, compared to net loss of $1,549,736 in the same period in 2021.
  • Diluted earnings per ordinary share of $0.01 for the three months ended December 31, compared to a loss per share of $0.02 for the same period in 2021.


  • Revenue of $23,749,201 for the year ended December 31, compared to $15,501,350 for the same period in 2021. An increase of over 73%.
  • Net loss of $9,148,188 for the year ended December 31, compared to net loss of $9,858,528 in the same period in 2021.
  • Diluted loss per ordinary share of $0.12 for the year ended December 31, compared to a loss per share of $0.13 for the same period in 2021.

Guardant Health, Inc.

All currency listed in thousands of US dollars, except per share data.

Selected highlights from their fourth quarter 2022 financial results on February 23, 2023

  • Revenue of $126,891 for the three months ended December 31, compared to $108,108 for the same period in 2021. An increase of over 17%.
  • Net loss of $139,934 for the three months ended December 31, compared to net loss of $90,911 in the same period in 2021.
  • Diluted loss per ordinary share of $1.36 for the three months ended December 31, compared to a loss of $0.89 for the same period in 2021.


  • Revenue of $449,538 for the year ended December 31, compared to $373,653 for the same period in 2021. An increase of over 20%.
  • Net loss of $654,588 for the year ended December 31, compared to net loss of $384,770 in the same period in 2021.
  • Diluted loss per ordinary share of $6.41 for the year ended December 31, compared to a loss of $4.00 for the same period in 2021.

Portfolio 3

Portfolio 3 for the week ended February 24, 2023: DOWN Red Down Arrow

  • Microsoft (NASD:MSFT) signed a 10 year deal with Nvidia to ensure Activision Blizzard (NASD:ATVI) games will be available on Nvidia’s gaming platform. This is an attempt to show regulators that if Microsoft’s acquisition of Activision is successful, the games will be available on platforms other than Microsoft’s Xbox. This deal is similar to the 10-year deal struck previously with Nintendo. Sony is the last major gaming platform against the acquisition.
  • Brookfield Corporation (TSX:BN) lowered its bid to acquire Australian energy company Origin Energy after the Australian government capped gas prices. The latest offer is for A$ 15.33 billion, not far from the original offer of A$ 15.5 billion.
  • Shopify (TSX:SHOP) is rolling out recent improvements to their partner program. These changes include: Shopify Partners can earn more from referring other merchants to Shopify’s platform; improved resources to grow their businesses; and more opportunities to interact and engage with Shopify.

Activity

No significant activity to report this week.

Dividends

Dividends Received this week for the following companies:

Companies followed by DRIP (Dividend Re-Investment Plan) indicate additional shares were purchased with the dividend. Any cash leftover was added to the cash balance.

No dividends this past week.

Quarterly Reports

Magnite, Inc.

All currency listed in thousands of US dollars, except per share data.

Selected highlights from their fourth quarter 2022 financial results on February 22, 2023

  • Revenue of $175,399 for the three months ended December 31, compared to $161,286 for the same period in 2021. An increase of over 8%.
  • Net loss of $36,385 for the three months ended December 31, compared to net income of $453 in the same period in 2021.
  • Diluted loss per ordinary share of $0.27 for the three months ended December 31, compared to $0 for the same period in 2021.


  • Revenue of $577,069 for the year ended December 31, compared to $468,413 for the same period in 2021. An increase of over 23%.
  • Net loss of $130,323 for the year ended December 31, compared to net earnings of $65 in the same period in 2021.
  • Diluted loss per ordinary share of $0.98 for the year ended December 31, compared to $0 for the same period in 2021.

Kneat.com Inc.

All currency listed in Canadian dollars, except per share data.

Selected highlights from their fourth quarter 2022 financial results on February 22, 2023

  • Revenue of $7,250,039 for the three months ended December 31, compared to $6,263,039 for the same period in 2021. An increase of almost 18%.
  • Net income of $458,919 for the three months ended December 31, compared to net loss of $1,549,736 in the same period in 2021.
  • Diluted earnings per ordinary share of $0.01 for the three months ended December 31, compared to a loss per share of $0.02 for the same period in 2021.


  • Revenue of $23,749,201 for the year ended December 31, compared to $15,501,350 for the same period in 2021. An increase of over 73%.
  • Net loss of $9,148,188 for the year ended December 31, compared to net loss of $9,858,528 in the same period in 2021.
  • Diluted loss per ordinary share of $0.12 for the year ended December 31, compared to a loss per share of $0.13 for the same period in 2021.

Unity Software Inc.

All currency listed in thousands of US dollars, except per share data

Selected highlights from their fourth quarter 2022 financial results on February 22, 2023

  • Revenue of $450,974 for the three months ended December 31, compared to $315,864 for the same period in 2021. An increase of almost 43%.
  • Net loss of $287,754 for the three months ended December 31, compared to net loss of $161,653 in the same period in 2021.
  • Diluted loss per ordinary share of $0.82 for the three months ended December 31, compared to a loss per share of $0.56 for the same period in 2021.


  • Revenue of $1,391,024 for the year ended December 31, compared to $1,110,526 for the same period in 2021. An increase of over 25%.
  • Net loss of $919,488 for the year ended December 31, compared to net loss of $533,047 in the same period in 2021.
  • Diluted loss per ordinary share of $2.96 for the year ended December 31, compared to a loss per share of $1.89 for the same period in 2021.


Weekly Update for the week ending February 17, 2023

Items that may only interest or educate me ….

Canadian inflation data, US inflation data, …


Statistics Canada’s latest Canadian Industrial Product Price Index (IPPI), prices that producers in Canada receive as goods leave the plant, reported an increase of 0.4% in January over December, while on a year over year basis, producer prices went up 5.4%. Analysts had expected a decline of 0.1% and an increase of 7.6%, respectively. On a monthly basis, prices rose but on a yearly basis they continue to decline.

Despite the year over decline, the Bank of Canada (BoC) maintains the Canadian economy is still running too hot and the job market too strong, refencing last weeks Canadian jobs report that was ten times higher than expected. The BoC reiterated their plan to conditionally pause increases to the Canadian benchmark interest rate to see how the economy and inflation respond to the highest rate (4.5%) since 2007. However, they indicated they were prepared to raise the interest rate if the economy and labour market remain too strong.


In the US, it was a busy week for economic data.

Leading off, the US Bureau of Labor Statistics released the January Consumer Price Index (CPI) report which showed no major surprises. Inflation was up 0.5% since December and 6.4% on a yearly basis. Analysts were expecting 0.5% and 6.2%, respectively. Core CPI (CPI less food and energy components) gained 0.4% since December, and 5.6% on a yearly basis. Analysts had been expecting 0.4% and 5.5%, respectively. Overall, inflation was slightly higher.

Next up, retail sales. After a slow December for retail sales, Americans rebounded with a vengeance, increasing their buying by the fastest pace in almost two years. The US Commerce Department’s latest retail sales report showed sales increased 3% since December, compared to a decline of 1.1% from November to December. Analysts had expected an increase of 1.8% for January. Among the items in demand were cars, furniture, electronics, appliances, and going out to restaurants and pubs. With Americans buying more products and services, the American economy remains strong. Unfortunately, the strong demand is keeping inflation high.

Finally, the Producer Price Index (PPI), what suppliers charge businesses, gained 0.7% in January and 6.0% on an annual basis. Analysts were expecting 0.4% and 5.4% respectively. Core PPI (PPI less food, energy, and trade services) rose 0.5% in January, and grew 5.4% for the year, down slightly from December’s 5.5%. Analysts had been expecting 0.3 and 5.5%, respectively. While the PPI showed inflation going up monthly, it was falling on an annual basis. The primary driver of the higher PPI numbers was increased fuel prices. The PPI numbers suggest higher inflation in the US is sticking around, echoing the CPI data.

Inflation in the US is down from last summer’s high of 9.1% but there is still a long way to go to get back to the US Federal Reserve’s (Fed) target of 2%. A strong jobs report to start February, followed by lingering high inflation, a surge in consumer, topped off with comments from the Fed stating beating down inflation was their top priority, and you have the recipe for another increase to the US benchmark interest rate. It is almost a certainty the Fed will raise the rate by 0.25%, if not more, at their next meeting in March. Depending on the data, it is looking more likely there will another increase at their May session. It seems a foregone conclusion the Fed will push the benchmark rate above 5% and keep it there longer, but is 6% possible? Hopefully not but it will take months to find out.

If you’re looking for the silver lining in stronger-than-expected data on jobs, retail sales and inflation, fears of a recession in the US have faded. 😊


Talking about inflation and economic data can cause one’s eyes to glaze over so I kept it short this week. However it was that data and the corresponding words from the central banks that largely moved the stock markets this past week. Now that you know what drove the market, let’s see what happened in the markets this past week….

Weekly Market Review

Monday: The North American markets rebounded from their worst week of 2023 so far, with all four major North American indexes ending higher. Upcoming inflation reports for the USA had investors concerned about potential increases to interest rates. The upcoming data will provide clues into whether, or by how much, the Fed will raise the American benchmark interest rate.

In Canada, the Toronto Stock Exchange Composite Index (TSX) ended higher as investors await the latest economic data from south of the border. In trading on the Toronto Stock Exchange (TSE), the interest rate sensitive Consumer Cyclicals and Technology sectors led a broad rally that saw only the Utilities sector fail to advance.

In America, the S&P 500 Index (S&P), the Dow Jones Industrial Average (DJIA), and the Nasdaq Composite Index (Nasdaq) had a strong start to the week, each rising more than 1%. In trading on the New York Stock Exchange and the Nasdaq Exchange, ten of the eleven S&P sectors advanced, led by the Technology and Consumer Staples sectors. The Energy sector was the only sector to end lower.

Tuesday: A mixed day for the indexes, with the TSX and the Nasdaq ending higher while the S&P and DJIA both ended lower. The big news was the US CPI data showed prices rose 0.5% since December, and were 6.4% higher, year over year. The slow pace of disinflation has investors concerned the Fed will increase the US interest rate at their March session. The price of oil dropped after the US announced it would release more oil from its Strategic Petroleum Reserve.

In Canada, the TSX got off to a quick start before falling sharply, then slowly climbing, to end the day in the green by the narrowest margin (.01%). On the Canadian exchanges, the Technology and Healthcare had the biggest gains of the Canadian sectors, while Consumer Staples and Utilities were a drag on the TSX.

In the US, no major surprises from today’s CPI report caused the indexes to drift as investors considered how the data would impact the Fed’s next rate announcement. Investors now turn to Wednesday’s retail sales data to see if consumer spending increased in January. In trading on the American exchanges, the Consumer Cyclicals and Technology sectors climbed the most, while Consumer Staples and Utilities led the decliners.

Wednesday: The indexes spent most of the day lower before a rally in the last 10 minutes nudged all four indexes into the green. January’s retail sales in the US rose by 3% over December, indicating the US economy remains strong. Recent US data (higher jobs, higher CPI, and now higher retail sales) has investors concerned about the Fed’s next move.

In Canada, the TSX overcame falling energy and resource stocks to make it over the wire at the last minute. On the TSE, big winners were the Technology and Healthcare sectors, while the Basic Materials (miners and fertilizer manufacturers), Energy and Telecommunications Services sectors were the only Canadian sectors to end lower.

In the US, strong retail sales data helped push all three American indexes higher, overcoming investor’s concerns of higher interest rates. Of the eleven S&P sectors, Consumer Cyclicals and Technology climbed the most, while Energy and Healthcare were the only two sectors to decline.

Thursday: All four indexes sank on news that the US January Producer Price Index (PPI) came in almost twice as high (0.7%) as expected (0.4%). As well, two members of the Fed suggested the US could be in for a drawn out battle with inflation, sending the markets tumbling.

In Canada, the TSX didn’t sink as much as its American cousins, but it still fell with the ebbing American tide. Not helping matters was Shopify (TSX:SHOP) forecasting slower revenue growth during the first quarter, causing the share price to fall 15%. Elsewhere on the TSE, the Basic Materials and Consumer Cyclicals sectors gained the most, while the Technology (thanks to Shopify) and Energy dropped the most, dragging the TSX down with them.

In the US, as well as the higher than expected PPI, weekly jobless claims unexpectedly fell confirming a strong labour market in the US. In trading, it was a broad based retreat across all S&P sectors with Telecommunications Services and Basic Materials sectors sinking the least and Technology and Consumer Cyclical dropping the most.

Friday: more tough talk from the Fed caused all four indexes to fall. Investors are anticipating the Fed will raise the US interest rate by at least 0.25%, at their next meeting. Oil prices continue to fall as higher inventory levels and fears of higher interest rates outweigh increased demand from China.

In Canada, a higher-than-expected Industrial Product Price Index (IPPI), fueled largely by higher fuel prices (pun intended), increased investors concerns that the BoC may raise the interest rate again to cool off the economy. In the Canadian sectors, Telecommunications Services and Healthcare had the biggest gains, while Energy and Basic Materials sank the most.

In the US, lingering high inflation and a strong economy has investors concerned the data will prompt the Fed to raise interest rates a few more times in 2023, sending the benchmark rate to at least 5.25%. In the American sectors, Telecommunications Services and Consumer Staples rose the most, with Energy and Technology had the biggest drop.


Weekly Portfolio Review

For the week, the TSX fell 0.5%, the S&P 500 declined 0.3%, the Dow sank 0.1% and the Nasdaq gained 2.15%.

Bearish market

A relatively flat week in the market saw gains early in the week, only to give them back at the end of the week, as shown in the chart above. The combination of a strong US economy and resurgent inflation caught the eye of the Fed. Various Fed members spoke about the need to ratchet up interest rates to slow down inflation. The data and words were enough to send the markets lower. Despite the threat of higher interest rates, the Nasdaq was able to post another winning week, with the DJIA essentially flat and the S&P barely in the red. In Canada, although the BoC said it would maintain the course and pause interest rate hikes, the TSX was still dragged down by the threat of higher US interest rates that would negatively impact many of the energy and mining companies listed on the TSX. With three of the four indexes lower for the week, I am marking it as a bear week.

Bull market. A good week for the North American stock markets.

Despite three of the four indexes ending the week lower, two of the portfolios still managed to post weekly gains, as shown below. The success of the portfolios is likely due to the success of the Technology sector in Canada and the USA. As shown below, the technology heavy Nasdaq was the only index to gain ground this past week. If Shopify’s share price hadn’t dropped 20% during the week, Portfolio 3 might have joined the other two portfolios in the win column. With two of the three portfolios higher for the week, I am marking it as a bull week.

Weekly Portfolio & Index performance
Weekly Portfolio & Index performance for the week ended February 17, 2023.

Companies on the Radar

Stocks on my Radar

No new companies came across my radar this past week. However, two have gone off the radar, but for different reasons. Crew Energy (TSX:CR) had been on my radar for a while. This past week I finally purchased shares for Portfolio 2. The other company to fall off the radar was Alphabet (NASD:GOOGL). The company is currently facing a few regulatory headwinds and the recent underwhelming performance of its artificial intelligence chatbot Bard caused me to wonder if it was losing ground to Microsoft (NASD:MSFT). For now, the five companies remaining on my radar are:

  • Intact Financial (TSX:IFC): a mid size insurance company supplying home, car and business insurance in Canada, the US, and the UK.
  • International Petroleum (TSX:IPCO): A Canadian company with oil and gas assets in Canada, Malaysia, and France.
  • Supremex: (TSX:SXP) a small cap company selling packing solutions throughout Canada and the USA.
  • ON Semiconductor (NASD:ON) an American company that makes intelligent sensor and power solutions that enable the electrification of the automotive industry.
  • Jabil Inc. (NYSE:JBL), an American company with global operations that specializes in providing manufacturing services and solutions.

The Radar Check was last updated February 17, 2022.

Graphical user interface, application Description automatically generated

A picture containing chart Description automatically generated


Portfolio Update

Portfolio 1

Portfolio 1 for the week ended February 17, 2023: UP Green Up Arrow, signifying a positive week

  • Zoox Taxi Of The Future Amazon (NASD:AMZN) successfully tested a robotaxi on a public road, ferrying Amazon employees between two Amazon buildings. With the successful completion of the test, Amazon’s Zoox self driving vehicle unit moved closer to obtaining regulatory approval. Zoox’s all electric robotaxi was designed from scratch and does not include a steering wheel, gas, or brake pedals. It has room for four passengers, with two facing each other.
  • According to Bank of America (NYSE:BAC), Nvidia (NASD:NVDA) is well positioned for the upcoming artificial intelligence (AI) race. BAC suggested the growth of AI could lead to a tremendous growth in data centres in the next five years. As the leading semiconductor manufacturer for AI and data centres with 75% of the market, BAC suggests Nvidia should be able to maintain at least 65% of the market.
  • One day after workers at a Tesla facility in Buffalo, NY, attempted to join a union, Tesla (NASD:TSLA) let go over 30 employees at that location. All employees were part of Tesla’s Autopilot automated driving team.
    Tesla recalled over 362,000 US vehicles to update their Full Self Driving software. US officials said their driver assistance software didn’t adhere to speed limits, traffic laws and has been known to cause crashes.
  • Trisura (TSX:TSU) rescheduled the release of the fourth quarter earnings report from February 9 to sometime in February to review information from its US subsidiary. I’ve never heard of a company rescheduling an earnings release for good news so I imagine they are having a difference of opinion with their auditor or they are trying to figure a way to spin bad news.
  • Susan Wojcicki, the CEO of Alphabet’s YouTube, is leaving the company and will be replaced by YouTube’s #2, her deputy Neal Mohan. Ms. Wojcicki was one of Google’s earliest employees (employee #16), back when the search giant originally started in her garage almost 25 years ago. Since she took the helm 9 years ago, ad revenue has taken off. Last year, YouTube brought in nearly 10% of Alphabet’s total revenues.
  • The Rogers Communications (TSX:RCI.B) acquisition of Shaw Communications (TSX:SJR.B) deadline to close has been extended until March 31. The deal awaits the formal approval of the Canadian Industry Minister.

Activity

Sold Brookfield Select Opportunities Fund (TSX:BSO.UN). This was originally bought as a relatively low risk way of generating income thanks to a generous 10% dividend. It was managed by Brookfield Corporation (TSX:BN), so I felt confident in management. Over the last two months the share price of BSO fell from over C$ 5.00 per share to less than C$ 2.00. An article suggested its current sub C$ 2 share price was more reflective of its underlying assets. At C$2 per share, its dividend jumped to 33%. If the 10% dividend was unsustainable, a 33% dividend is untenable. As a result, management was evaluating their options which include reducing the dividend and liquidating the fund. Either way, my reason for investing is gone so I cut my losses. I have sold all BSO shares across all three portfolios.

Dividends

Dividends Received this week for the following companies:

Companies followed by DRIP (Dividend Re-Investment Plan) indicate additional shares were purchased with the dividend. Any cash leftover was added to the cash balance.

Canadian $

Dream Industrial Real Estate Investment Trust (TSX:DIR.UN)

BSR Real Estate Investment Trust (TSX:HOM.U)

US $

Apple Inc. (NASD:AAPL)

Quarterly Reports

Lattice Semiconductor Corporation

All currency listed in thousands of US dollars, except per share data.

Selected highlights from their fourth quarter 2022 financial results on February 13, 2023

  • Revenue of $175,960 for the three months ended December 31, compared to $141,795 for the same period in 2021. An increase of over 21%.
  • Net income of $51,913 for the three months ended December 31, compared to net income of $28,532 in the same period in 2021.
  • Diluted earnings per ordinary share of $0.37 for the three months ended December 31, compared to $0.20 for the same period in 2021.


  • Revenue of $660,356 for the year ended December 31, compared to $515,327 for the same period in 2021. An increase of over 28%.
  • Net earnings of $178,882 for the year ended December 31, compared to net earnings of $95,922 in the same period in 2021.
  • Diluted earnings per ordinary share of $1.27 for the year ended December 31, compared to $0.60 for the same period in 2021.

The Trade Desk, Inc.

All currency listed in thousands of US dollars, except per share data.

Selected highlights from their fourth quarter 2022 financial results on February 15, 2023

  • Revenue of $490,737 for the three months ended December 31, compared to $395,598 for the same period in 2021. An increase of over 24%.
  • Net income of $71,187 for the three months ended December 31, compared to net income of $8,039 in the same period in 2021.
  • Diluted earnings per ordinary share of $0.14 for the three months ended December 31, compared to $0.2 for the same period in 2021.


  • Revenue of $1,577,795 for the year ended December 31, compared to $1,196,467 for the same period in 2021. An increase of over 31%.
  • Net earnings of $53,385 for the year ended December 31, compared to net earnings of $137,762 in the same period in 2021.
  • Diluted earnings per ordinary share of $0.11 for the year ended December 31, compared to $0.28 for the same period in 2021.

Roku, Inc.

All currency listed in thousands of US dollars, except per share data.

Selected highlights from their fourth quarter 2022 financial results on February 15, 2023

  • Revenue of $867,056 for the three months ended December 31, compared to $865,329 for the same period in 2021. An increase of almost 1%.
  • Net loss of $237,197 for the three months ended December 31, compared to net income of $23,687 in the same period in 2021.
  • Diluted loss per ordinary share of $1.70 for the three months ended December 31, compared to earnings per ordinary share of $0.17 for the same period in 2021.


  • Revenue of $3,126,534 for the year ended December 31, compared to $2,764,584 for the same period in 2021. An increase of over 13%.
  • Net loss of $498,005 for the year ended December 31, compared to net earnings of $242,385 in the same period in 2021.
  • Diluted loss per ordinary share of $3.62 for the year ended December 31, compared to earnings per ordinary share of $1.71 for the same period in 2021.

Upwork Inc.

All currency listed in thousands of US dollars, except per share data.

Selected highlights from their fourth quarter 2022 financial results on February 15, 2023

  • Revenue of $161,442 for the three months ended December 31, compared to $136,856 for the same period in 2021. An increase of almost 18%.
  • Net loss of $16,500 for the three months ended December 31, compared to net loss of $22,556 in the same period in 2021.
  • Diluted earnings per ordinary share of $0.13 for the three months ended December 31, compared to $0.18 for the same period in 2021.


  • Revenue of $457,916 for the year ended December 31, compared to $367,289 for the same period in 2021. An increase of almost 25%.
  • Net loss of $89,885 for the year ended December 31, compared to net loss of $56,240 in the same period in 2021.
  • Diluted earnings per ordinary share of $0.69 for the year ended December 31, compared to $0.44 for the same period in 2021.

Datadog, Inc.

All currency listed in thousands of US dollars, except earnings per share.

Selected highlights from their fourth quarter 2022 financial results on February 16, 2023

  • Revenue of $469,399 for the three months ended December 31, compared to $326,198 for the same period in 2021. An increase of almost 44%.
  • Net loss of 29,034 for the three months ended December 31, compared to net income of $7,169 in the same period in 2021.
  • Diluted loss per ordinary share of $0.09 for the three months ended December 31, compared to earnings per share of $0.02 for the same period in 2021.


  • Revenue of $1,675,100 for the year ended December 31, compared to $1,028,784 for the same period in 2021. An increase of almost 63%.
  • Net loss of $50,160 for the year ended December 31, compared to net loss of $20,745 in the same period in 2021.
  • Diluted loss per ordinary share of $0.16 for the year ended December 31, compared to a loss per share of $0.07 for the same period in 2021.

Portfolio 2

Portfolio 2 for the week ended February 17, 2023: UP Green Up Arrow, signifying a positive week

  • Guardant Health (NASD:GH) was back in the news with the announcement of a new study to evaluate the impact of Shield, Guardant’s blood test to screen for colorectal cancer. It is hoped that the Shield test will help patients follow screening recommendations. It is hoped that the Shield blood test will increase the number of patients who test for colorectal cancer.

Activity

Bought Crew Energy. This is the second purchase of Crew Energy, however it is the first for Portfolio 2. As with the first purchase, I hope to capitalize on the growing global demand for oil and natural gas. The company has grown it’s top and bottom line (revenues and net income), and share price has appreciated 50% since the original purchase 16 months ago. My only concern is the current Canadian governments ‘End of Energy’ transition.

Sold Brookfield Select Opportunities Fund. See Portfolio 1 for explanation.

Dividends

Dividends Received this week for the following companies:

Companies followed by DRIP (Dividend Re-Investment Plan) indicate additional shares were purchased with the dividend. Any cash leftover was added to the cash balance.

No dividends this past week.

Quarterly Reports

TC Energy Corporation

All currency listed in millions of Canadian dollars, except per share data.

Selected highlights from their fourth quarter 2022 financial results on February 14, 2023

  • Revenue of $4,041 for the three months ended December 31, compared to $3,584 for the same period in 2021. An increase of almost 13%.
  • Net loss of $1,447 the three months ended December 31, compared to net income of $1,118 in the same period in 2021.
  • Diluted earnings per ordinary share of $1.11 for the three months ended December 31, compared to $1.05 for the same period in 2021.


  • Revenue of $14,977 for the year ended December 31, compared to $13,387 for the same period in 2021. An increase of almost 12%.
  • Net earnings of $641 for the year ended December 31, compared to net earnings of $1,815 in the same period in 2021.
  • Diluted earnings per ordinary share of $0.64 for the year ended December 31, compared to $1.87 for the same period in 2021.

iAG Financial Group

All currency listed in millions of Canadian dollars, except per share data.

Selected highlights from their fourth quarter 2022 financial results on February 14, 2023

  • Revenue of $3,492 for the three months ended December 31, compared to $3,353 for the same period in 2021. An increase of over 4%.
  • Net earnings of $229 the three months ended December 31, compared to net income of $209 in the same period in 2021.
  • Diluted earnings per ordinary share of $2.17 for the three months ended December 31, compared to $1.94 for the same period in 2021.


  • Revenue of $13,109 for the year ended December 31, compared to $13,164 for the same period in 2021. A decrease of almost 1%.
  • Net earnings of $817 for the year ended December 31, compared to net earnings of $830 in the same period in 2021.
  • Diluted earnings per ordinary share of $7.65 for the year ended December 31, compared to $7.70 for the same period in 2021.

Dream Industrial Real Estate Investment Trust

All currency listed in thousands of Canadian dollars, except per share data.

Selected highlights from their fourth quarter 2022 financial results on February 14, 2023

  • Revenue of $75,458 for the three months ended December 31, compared to $60,432 for the same period in 2021. An increase of almost 25%.
  • Net loss of $34,147 the three months ended December 31, compared to net income of $189,971 in the same period in 2021.
  • Diluted earnings per ordinary share of $0.23 for the three months ended December 31, compared to $0.21 for the same period in 2021.


  • Revenue of $281,587 for the year ended December 31, compared to $217,899 for the same period in 2021. An increase of over 16%.
  • Net earnings of $705,885for the year ended December 31, compared to net earnings of $608,345 in the same period in 2021.
  • Diluted earnings per ordinary share of $0.89 for the year ended December 31, compared to $0.81 for the same period in 2021.

Chorus Aviation Inc.

All currency listed in thousands of Canadian dollars, except per share data.

Selected highlights from their fourth quarter 2022 financial results on February 15, 2023

  • Revenue of $439,755 for the three months ended December 31, compared to $346,516 for the same period in 2021. An increase of almost 27%.
  • Net income of $45,852 for the three months ended December 31, compared to net income of $10,159 in the same period in 2021.
  • Diluted earnings per ordinary share of $0.11 for the three months ended December 31, compared to $0 for the same period in 2021.


  • Revenue of $1,595,804 for the year ended December 31, compared to $1,023,275 for the same period in 2021. An increase of almost 56%.
  • Net earnings of $51,917 for the year ended December 31, compared to net loss of $20,485 in the same period in 2021.
  • Diluted earnings per ordinary share of $0.13 for the year ended December 31, compared to a loos per share of $0.12 for the same period in 2021.

Portfolio 3

Portfolio 3 for the week ended February 17, 2023: DOWN Red Down Arrow

  • Microsoft is set to defend its acquisition of Activision Blizzard (NASD:ATVI) in front of the European Commission (EC). Microsoft claims the acquisition will enable it to better compete with its rivals while the EC is concerned the deal is anti-competitive. Microsoft is expected to offer remedies that will allow the EC to give its blessing to the deal.
    Microsoft funded OpenAI, the developer of ChatGPT that will be used by Microsoft’s search engine Bing and other Microsoft applications, announced they are upgrading ChatGPT so it can be customized. OpenAI hopes this will address and mitigate concerns about various political and social biases.
    Microsoft is considering allowing advertisers to insert links within Bing’s artificial intelligence powered answers. Integrating ads into Bing’s chatbot would ensure the ads are not pushed down the page, below the chatbot. I’m sure Microsoft will charge a premium for this ad space.
  • Brookfield Asset Management (TSX:BAM) plans to buy the remaining 50% stake in Spain’s X-elio, a renewable power company. Brookfield already owns 50% and has the right of first refusal on the 50% it does not own.

Activity

Sold Brookfield Select Opportunities Fund. See Portfolio 1 for explanation.

Dividends

Dividends Received this week for the following companies:

Companies followed by DRIP (Dividend Re-Investment Plan) indicate additional shares were purchased with the dividend. Any cash leftover was added to the cash balance.

No dividends this past week.

Quarterly Reports

Shopify Inc.

All currency listed in thousands of US dollars, except per share data.

Selected highlights from their fourth quarter 2022 financial results on February 15, 2023

  • Revenue of $1,734,978 for the three months ended December 31, compared to $1,380,024 for the same period in 2021. An increase of almost 26%.
  • Net loss of $602,155 for the three months ended December 31, compared to net loss of $371,395 in the same period in 2021.
  • Diluted loss per ordinary share of $0.49 for the three months ended December 31, compared to a loss per share of $0.30 for the same period in 2021.


  • Revenue of $5,599,864 for the year ended December 31, compared to $4,611,856 for the same period in 2021. An increase of over 21%.
  • Net loss of $3,470,917 for the year ended December 31, compared to net earnings of $2,899,915 in the same period in 2021.
  • Diluted loss per ordinary share of $2.73 for the year ended December 31, compared to earnings of $2.29 for the same period in 2021.

goeasy Ltd.

All currency listed in thousands of Canadian dollars, except per share data.

Selected highlights from their fourth quarter 2022 financial results on February 15, 2023

  • Revenue of $273,326 for the three months ended December 31, compared to $234,430 for the same period in 2021. An increase of almost 17%.
  • Net income of $28,576 for the three months ended December 31, compared to net income of $49,961 in the same period in 2021.
  • Diluted earnings per ordinary share of $1.71 for the three months ended December 31, compared to $2.90 for the same period in 2021.


  • Revenue of $1,019,336 for the year ended December 31, compared to $826,722 for the same period in 2021. An increase of over 23%.
  • Net earnings of $140,161 for the year ended December 31, compared to net earnings of $244,943 in the same period in 2021.
  • Diluted earnings per ordinary share of $8.42 for the year ended December 31, compared to $14.62 for the same period in 2021.


Weekly Update for the week ending February 10, 2023

Items that may only interest or educate me ….

Central banks, Bank of Canada minutes, Canadian interest rate predictions, ignore the noise, Canadian jobs, Bing challenging Google? …


If it seems like the Bank of Canada (BoC) and the US Federal Reserve (Fed) are common topics in this section of the Weekly Updates, you would be correct. This was not by design. Rather, the two were noteworthy because the markets responded to their actions and words, especially the Federal Reserve’s policies. To get a better understanding of them, I did a little research on the two organizations. If you would like a high-level overview of these two government organizations, check out the article on Central Banks.


The BoC made public the minutes from their January 25 rate decision. The BoC was one of the few central banks that did not provide notes from their meetings. However, following a recommendation from the International Monetary Fund (IMF), the BoC will publish the discussions amongst the BoC members that went into their interest rate decision.

The minutes showed that the central bank was inclined to pause interest rate hikes, but the strong Canadian labour market and stronger than expected economic growth caused them to increase the rates by 0.25%. Other factors the BoC took into consideration include declining energy prices, global supply chains improving, and that China ended their Covid-19 lockdowns. At the end of the day, the BoC members concluded global inflation was drifting downward and “the perceived risk of a deep recession had decreased” but a 0.25% increase was required to ensure inflation kept heading downward.


During a speech to analysts, Bank of Canada (BoC) Governor Mr. Tiff Macklem said no additional interest rate hikes will be required if inflation continues to fall. If the data continues to confirm the BoC’s inflation forecast, Canadians can expect the benchmark interest rate to have peaked at 4.5%. However, he did not say when Canadians can expect to see interest rates to decline, saying it was too early to think about lowering the interest rate.

The day prior to Mr. Macklem’s speech, a BoC survey of the 28 major Canadian market participants revealed they believe:

  • The Canadian benchmark interest rate will drop to 4%, if not lower, by the end of 2023.
  • The rate will continue to fall into 2024.
  • None of the participants believe the rate will go higher.
  • Inflation will drop to 2.9% by the end of the 2023. This would put inflation within the BoC’s target range of 1% – 3%.

Let us hope they are clairvoyant.


The BoC made its latest adjustment to Canada’s benchmark interest rate on January 5, raising the rate to 4.5% and saying they would pause interest rate increases unless the data dictated otherwise. Their next meeting is March 8. The US Federal Reserve (Fed) announced a 0.25% increasing bring the US interest rate to 4.75%, however, they indicated there would be future increases rather than a pause. Their next meeting is March 21 -22.

Between now and the next announcements from the two central banks a lot may happen. One thing you can count on is there will be no shortage of ‘experts’ telling us what the two central banks will do. Many will say the BoC will pause, many will say they will raise the rate. The same goes for the ‘experts’ following the Fed. They will probably change their positions based on data as it becomes available. Take their predictions with a grain of salt, its mostly noise. No one knows what is going to happen (see the next section item the Canadian jobs report). If you are investing for the long term (5+ years), don’t worry about these short term events.

If you want to get an idea of which way the BoC or the Fed is leaning, follow the data. The Canadian Consumer Price Index (CPI) and Producer Price Index (PPI) are published by Statistics Canada. In the US, the CPI and PPI reports are published by the Bureau of Labor Statistics. There are other reports published monthly but the CPI and PPI are good places to start if you want to know if inflation is going up or down.


Statistics Canada’s latest jobs report showed the Canadian economy added 150,000 jobs in January, well above analysts’ prediction of 15,000 new jobs, while the unemployment rate remained at 5.0%, barely above the record low. The data suggests the labour market remains strong, leading to concerns the BoC may reconsider pausing interest rate hikes.

This follows the stronger than expected jobs report out of the US last. Investors in Canada and the USA are now waiting for next week’s January CPI data for clues on the next moves from the BoC and the Fed. If the February data is similar to the January data, both central banks may be inclined to raise the interest rate another 0.25%.


Could Microsoft (NASD:MSFT) be disrupting Google’s dominance of online search? Alphabet’s (NASD:GOOGL) Google has been the dominant search engine for years, with over 90% of the market. However, Microsoft has recently upped its search engine game with the addition of OpenAI’s ChatGPT artificial intelligence (AI) chatbot (a computer program designed to simulate conversation with human users.)

It’s estimated that for every percentage point in market share that Microsoft can gain from Google in the battle for search supremacy, they will bring in US$2 billion in search advertising revenues. As well as incorporating ChatGPT into their Bing search engine and Edge browser, Microsoft plans to integrate it into many of their productivity applications. They’ve already launched a premium version of Teams featuring ChatGPT.

Google has announced their own chatbot – Bard – which will provide similar services for Google’s Search and Maps applications. Unfortunately for Google, Bard did a face plant in a promotional video at a company event when it responded to a query with inaccurate information. Thanks to this misfire, Alphabet lost US$ 100 billion in market value over concerns the company was falling behind Microsoft.

As well as being used in their respective search engines and productivity tools, similar AI tools could be used in numerous industries for tasks such as for online content creation, answering customer queries and other applications. The possibilities are endless and there is a lot at stake as Microsoft, Google and other AI developers rush to stake their claims in this emerging market.

For now, Microsoft and ChatGPT are winning the race, but this is marathon, not a sprint. Google has the resources and deep pockets to get back in the race. Perhaps there is another company no one has heard of that will dominate the AI market.

With the recent drop in Alphabet’s share price thanks to Bard’s pratfall, if you believe in the long-term success of the company now could be a good time to invest in Alphabet. 😊


With the interesting items out of the way, let’s see what happened this past week….

Weekly Market Review

Monday: It seems the part where the Federal Reserve’s (Fed) chairperson said there would be ongoing hikes to the US interest rate has made investors skittish as all four major North American indexes ended lower. Last week’s strong US jobs report caused investors to worry the US interest rate could go higher and last longer.

In Canada, the Toronto Stock Exchange Composite Index (TSX) fell on lower commodity prices and concerns of higher US interest rates. In trading, the defensive sectors Consumer Staples, Utilities, and Telecommunications Services were the only Canadian sectors to end higher. Falling the farthest were Consumer Cyclical and Basic Materials (miners and fertilizer manufacturers).

In the US, it was a tough day for the S&P 500 Index (S&P), the Dow Jones Industrial Average (DJIA), and the Nasdaq Composite Index (Nasdaq) as they gave back some of last week’s gains. The only US Sector to advance was the Utilities sector, while the Technology and Basic Materials sank the farthest.

Tuesday: The markets rebounded from Monday’s setback, with all four indexes solidly higher. The main catalyst was comments from both the BoC and Fed that eased concerns about higher interest rates. Oil prices rebounded on increasing demand from China.

In Canada, a statement from the BoC Governor stating no further interest rate hikes would be required if the data continues to show inflation is falling, good news out of the US and higher oil prices propelled the TSX higher. That is almost the perfect storm for the TSX. 😊 On the Toronto Stock Exchange (TSE), the Energy and Basic Materials gained the most of the Canadian sectors, with the defensive sectors Consumer Staples and Utilities had the biggest drop.

In the US, the markets were up and down like a yo-yo for most of the day before a strong surge pushed all three indexes solidly into the green for the day. The Fed chair said there should be “significant declines in inflation” during the year, easing investor worries. In trading, the American Energy and Technology sectors advanced the most, while Telecommunications Services, Consumer Staples and Utilities were the only sectors to end lower.

Wednesday: Tuesday’s late afternoon rally failed to stick as all four indexes gave back yesterday’s gains as investors considered recent data and comments from the BoC and the Fed. Oil prices rose for third consecutive day on increased demand from US refineries.

In Canada, the BoC released the minutes from their January session, showing what went into their decision to raise the rate by 0.25% and pause future increases. The defensive sectors Consumer Staples and Telecommunications Services ended higher and were the best of the Canadian sectors, while the Basic Materials and Technology sectors weighed down the TSX with their declines.

In the US, the Telecommunications Services sector was the only American sector to advance, while Technology and Utilities fell the farthest.

Thursday: Despite a strong start to the day, all four indexes posted their second day of losses as investors worried about recent comments from the Fed that interest rate hikes would continue and remain elevated longer. As well, US Treasury yields rose, becoming a viable and safer alternative to stocks. Share prices fell as investors moved away from volatile stocks into safer US Treasury bonds.

In Canada, lower commodity prices and the falling tide of the American markets dragged the TSX lower. In the Canadian sectors, only the Consumer Staples and Financials sector ended the day in the green, while the Healthcare and Telecommunications Services sectors were the deepest in the red.

South of the border, it was a broad-based retreat in the American S&P sectors with all sectors ending lower. Consumer Staples and Consumer Cyclicals dropped the least while Utilities and Telecommunications Services fell the most.

Friday: A late afternoon rally pushed three of the four indexes into the green, with the Nasdaq the lone index to end the day in the red. The price of oil got a boost when Russia announced plans to reduce their production of oil next month by 5%, sending the share prices of energy companies higher.

In Canada, a strong Canadian jobs report gave investors concerns the BoC would reconsider its decision to pause interest rate hikes. However, investors overcame their fears to nudge the TSX into the green. On the TSE, it was the Canadian Energy and Utilities sectors that posted the biggest gains, while Consumer Cyclicals and Technology sectors fell the most.

In the US, the Nasdaq suffered its first weekly decline of the year as the yield on 10-year US Treasury notes rose, approaching 4%. Higher yields have a more adverse effect on the riskier, high growth technology companies. A risk-free investment paying 4% annually is a good place to park money. In trading, the Energy and Utilities climbed the most while the interest sensitive Consumer Cyclicals and Technology sectors had the biggest drops.


Weekly Portfolio Review

For the week, the TSX dropped 0.7%, the S&P 500 fell 1.1%, the Dow sank 0.2% and the Nasdaq declined 2.4%.

Bearish market

For the first time in 2023 all four indexes ended the week lower. It had to happen sooner or latter but with the TSX and the Nasdaq posting their first weekly losses, all four major North American indexes have now had at least one week where they lost ground. This was also the first time all indexes ended the week lower. The main driver of the markets was concerns the US benchmark interest rate increases would continue and remain longer than investors originally thought.

With the four indexes all lower for the week, it was no surprise the three portfolios were also down, as you can see blow. I’ve said previously that the portfolios roughly align with an index and that appears to have happened again. Portfolio 1, with the most companies compared to the other two seems to mirror the S&P. Portfolio 2 with its less risky approach and preponderance of larger Canadian companies aligns with the TSX. Finally, Portfolio 3 with its growth-oriented approach tends to follow the Nasdaq. This week the losses in the indexes were reflected in the losses in the portfolios. I much prefer it when the indexes rise and floats all the portfolios. 😊

Weekly Portfolio & Index performance
Weekly Portfolio & Index performance for the week ended February 10, 2023.

Companies on the Radar

Stocks on my Radar

Two new technology companies crossed my radar this past week. The first is ON Semiconductor (NASD:ON) an American company that makes intelligent sensing and power solutions that enable the electrification of the automotive industry. The other is Jabil Inc. (NYSE:JBL), an American global company that specializes in providing manufacturing services and solutions. They make products for other companies, including “300 of the biggest brands in the world in every market from healthcare, packaging, smartphones and cloud equipment to automotive and home appliances.”

I had never heard of either company but from a quick check on Yahoo Finance they appear to provide semiconductors for a wide variety of companies and uses. With the growth of electronic and ‘smart’ products, I think the semiconductor industry has a long runway. I need to dig deeper on both companies but for now I’ll add them to the existing five companies on my Radar List, below.

  • Crew Energy (TSX:CR): A Canadian oil and gas company with interests in British Columbia.
  • Intact Financial (TSX:IFC): a mid size insurance company supplying home, car and business insurance in Canada, the US, and the UK.
  • International Petroleum (TSX:IPCO): A Canadian company with oil and gas assets in Canada, Malaysia, and France.
  • Supremex: (TSX:SXP) a small cap company selling packing solutions throughout Canada and the USA.
  • Alphabet: The leading online search engine and advertising company, dominant mobile operating system.

The Radar Check was last updated February 10, 2022.

Graphical user interface, table Description automatically generated

Graphical user interface, table Description automatically generated


Portfolio Update

Portfolio 1

Portfolio 1 for the week ended February 10, 2023: DOWN Red Down Arrow

  • Alphabet’s share price took a dive after their artificial intelligence chatbot Bard failed a test in its first public appearance. During the presentation Google did not provide a timeline for when Bard would be integrated into its search engine.
  • Magnite (NASD:MGNI) announced their new Magnite Streaming service. Magnite Streaming will allow media owners to maximize the value of their assets holistically across live and Video On Demand inventory, CTV (Connected TV) and OTT (Over The Top) environments, while gaining insights to how their ads are working.
  • Docebo (TSX:DCBO) was named a Core leader for Learning Systems by the Fosway Group, Europe’s top HR Industry analyst. It was the sixth straight year for Docebo to win this title. Fosway’s Core Leaders are companies with excellent record of enterprise win rates, customer delivery and support.
  • General Motors (NYSE:GM) announced a deal with semiconductor manufacturer Globalfoundries (NASD:GFS) to secure chip production to avoid shortages which have plagued the automotive industries for the last few years.
  • Ford (NYSE:F) has lowered its stake in Rivian (NASD:RIVN) to a minimal 1%. When Rivian went public in late 2021, Ford had a 11% stake in the new electric vehicle company.

Activity

No significant activity to report this week.

Dividends

Dividends Received this week for the following companies:

Companies followed by DRIP (Dividend Re-Investment Plan) indicate additional shares were purchased with the dividend. Any cash leftover was added to the cash balance.

Canadian $

Bank of Nova Scotia (TSX:BNS) DRIP

US $

No US$ dividends this past week.

Quarterly Reports

TMX Group Limited

All currency listed in millions of Canadian dollars, except earnings per share.

Selected highlights from their fourth quarter 2022 financial results on February 6, 2023

  • Revenue of $274.1 for the three months ended December 31, compared to $252.4 for the same period in 2021. An increase of almost 22%.
  • Net income of $102.2 for the three months ended December 31, compared to net income of $87.9 in the same period in 2021.
  • Diluted earnings per ordinary share of $1.83 for the three months ended December 31, compared to $1.56 for the same period in 2021.


  • Revenue of $1,116.6 for the year ended December 31, compared to $980.7 for the same period in 2021. An increase of over 14%.
  • Net earnings of $542.7 for the year ended December 31, compared to net earnings of $338.5 in the same period in 2021.
  • Diluted earnings per ordinary share of $9.69 for the year ended December 31, compared to $5.99 for the same period in 2021.

Pinterest, Inc.

All currency listed in thousands of US dollars, except earnings per share.

Selected highlights from their fourth quarter 2022 financial results on February 6, 2023

  • Revenue of $877,209 for the three months ended December 31, compared to $846,655 for the same period in 2021. An increase of 4%.
  • Net income of $17,491 for the three months ended December 31, compared to net income of $174,699 in the same period in 2021.
  • Diluted earnings per ordinary share of $0.03 for the three months ended December 31, compared to $0.25 for the same period in 2021.


  • Revenue of $2,802,574 for the year ended December 31, compared to $2,578,027 the same period in 2021. An increase of 9%.
  • Net loss of $96,047 for the year ended December 31, compared to net earnings of $316,438 in the same period in 2021.
  • Diluted loss per ordinary share of $0.14 for the year ended December 31, compared to earnings of $0.46 for the same period in 2021.

Skyworks Solutions, Inc.

All currency listed in millions of US dollars, except earnings per share.

Selected highlights from their first quarter 2023 financial results on February 6, 2023

  • Revenue of $1,329.3 for the three months ended December 31, compared to $1,510.4 for the same period in 2021. A decrease of almost 12%.
  • Net income of $309.4 for the three months ended December 31, compared to net income of $399.9 in the same period in 2021.
  • Diluted earnings per ordinary share of $1.93 for the three months ended December 31, compared to $2.40 for the same period in 2021.


PayPal Holdings, Inc.

All currency listed in millions of US dollars, except earnings per share.

Selected highlights from their fourth quarter 2022 financial results on February 9, 2023

  • Revenue of $7,383 for the three months ended December 31, compared to $6,918 for the same period in 2021. An increase of almost 7%.
  • Net income of $921 for the three months ended December 31, compared to net income of $801 in the same period in 2021.
  • Diluted earnings per ordinary share of $0.81 for the three months ended December 31, compared to $0.68 for the same period in 2021.


  • Revenue of $27,518 for the year ended December 31, compared to $25,371 for the same period in 2021. An increase of over 8%.
  • Net earnings of $2,419 for the year ended December 31, compared to net earnings of $4,169 in the same period in 2021.
  • Diluted earnings per ordinary share of $2.09 for the year ended December 31, compared to $3.52 for the same period in 2021.

Telus Corporation

All currency listed in millions of Canadian dollars, except earnings per share.

Selected highlights from their fourth quarter 2022 financial results on February 9, 2023

  • Revenue of $5,023 for the three months ended December 31, compared to $4,872 for the same period in 2021. An increase of over 3%.
  • Net income of $265 for the three months ended December 31, compared to net income of $663 in the same period in 2021.
  • Basics earnings per ordinary share of $0.17 for the three months ended December 31, compared to $0.47 for the same period in 2021.

Cloudflare, Inc.

All currency listed in thousands of US dollars, except earnings per share.

Selected highlights from their fourth quarter 2022 financial results on February 9, 2023

  • Revenue of $274,700 for the three months ended December 31, compared to $193,596 for the same period in 2021. An increase of almost 42%.
  • Net loss of $45,917 for the three months ended December 31, compared to a net loss of $77,501 in the same period in 2021.
  • Diluted loss per ordinary share of $0.14 for the three months ended December 31, compared to a loss per share of $0.24 for the same period in 2021.


  • Revenue of $975,241 for the year ended December 31, compared to $656,426 for the same period in 2021. An increase of over 48%.
  • Net loss of $193,381 for the year ended December 31, compared to a net loss of $260,309 in the same period in 2021.
  • Diluted loss per ordinary share of $0.59 for the year ended December 31, compared to loss per share of $0.83 for the same period in 2021.

Portfolio 2

Portfolio 2 for the week ended February 10, 2023: DOWN Red Down Arrow

  • Telus (TSX:T) partnered with virtual reality (VR) developer Paperplane Therapeutics to deliver VR headsets to the Fondation de l’Hotel-Dieu d’Alma (the Alma Hospital Foundation) to lower the anxiety level of patients in the Hospital’s psychiatry ward. A study has shown that 80% of patients that used the VR headsets felt less stress while undergoing treatment.
  • Guardant Health’s (NASD:GH) Guardant360 CDx liquid biopsy test will now be covered by UnitedHealthcare as a companion diagnostic in advanced lung and breast cancer tests.
  • MongoDB (NASD:MDB) received the US government’s Federal Risk and Authorization Management Program (FEDRAMP) Moderate Authorization security clearance. FedRAMP is a standardized approach to security authorization to provide cloud services to US government agencies. The Moderate level is when a loss of confidentiality would seriously impact an agency’s operations, such as damage to assets, financial loss or individual harm (but not death).
  • In an attempt to save $5.5 billion in expenses, Disney (NYSE:DIS) announced they would let go 7,000 people from its global workforce. They have also restructured into three divisions: Disney Entertainment (all of their TV, film and streaming units); ESPN; and Disney Parks, Experiences and Products.
    The state of Florida passed a bill authorizing the governor to appoint five supervisors to run what is now known as the Reedy Creek Improvement District. This effectively gives the state control of the board that oversees development in and around Disney’s Florida parks. The board will not be involved in day to day operations of the numerous Disney theme parks but it will have the authority to collect revenue, pay off debt and provide a range of government services.
  • TC Energy (TSX:TRP) reported a combination of things led to the failure of their Keystone pipeline back in December. The report identified a welding flaw and bending stress as possible causes.

Activity

No significant activity to report this week.

Dividends

Dividends Received this week for the following companies:

Companies followed by DRIP (Dividend Re-Investment Plan) indicate additional shares were purchased with the dividend. Any cash leftover was added to the cash balance.

Canadian $

Bank of Nova Scotia (TSX:BNS) DRIP

US $

No US$ dividends this past week.

Quarterly Reports

Take-Two Interactive Software, Inc.

All currency listed in millions of US dollars, except earnings per share.

Selected highlights from their third quarter 2022 financial results on February 6, 2023

  • Revenue of $1,407.8 for the three months ended December 31, compared to $903.3 for the same period in 2021. An increase of almost 56%.
  • Net loss of $153.4 for the three months ended December 31, compared to net income of $144.6 in the same period in 2021.
  • Diluted loss per ordinary share of $0.91 for the three months ended December 31, compared to earnings of $1.24 for the same period in 2021.


  • Revenue of $3,903.7 for the nine months ended December 31, compared to $2,574.8 the same period in 2021. An increase of almost 52%.
  • Net loss of $514.4 for the nine months ended December 31, compared to net earnings of $307.1 in the same period in 2021.
  • Diluted loss per ordinary share of $3.27 for the nine months ended December 31, compared to earnings of $2.63 for the same period in 2021.

The Walt Disney Company

All currency listed in millions of US dollars, except earnings per share.

Selected highlights from their first quarter 2023 financial results on February 8, 2023

  • Revenue of $23,512 for the three months ended December 31, compared to $21,819 for the same period in 2021. An increase of almost 8%.
  • Net income of $1,361 for the three months ended December 31, compared to net income of $1,200 in the same period in 2021.
  • Diluted earnings per ordinary share of $0.70 for the three months ended December 31, compared to earnings of $0.60 for the same period in 2021.

Telus Corporation

All currency listed in millions of Canadian dollars, except earnings per share.

Selected highlights from their fourth quarter 2022 financial results on February 9, 2023

  • Revenue of $5,023 for the three months ended December 31, compared to $4,872 for the same period in 2021. An increase of over 3%.
  • Net income of $265 for the three months ended December 31, compared to net income of $663 in the same period in 2021.
  • Basics earnings per ordinary share of $0.17 for the three months ended December 31, compared to $0.47 for the same period in 2021.

Fortis Inc.

All currency listed in millions of Canadian dollars.

Selected highlights from their fourth quarter 2022 financial results on February 10, 2023

  • Revenue of $3,168 for the three months ended December 31, compared to $2,583 for the same period in 2021. An increase of over 22%.
  • Net income of $370 for the three months ended December 31, compared to net income of $328 in the same period in 2021.
  • Diluted earnings per ordinary share of $0.77 for the three months ended December 31, compared to $0.69 for the same period in 2021.


  • Revenue of $11,043 for the year ended December 31, compared to $9,448 for the same period in 2021. An increase of almost 17%.
  • Net earnings of $1,514 for the year ended December 31, compared to net earnings of $1,405 in the same period in 2021.
  • Diluted earnings per ordinary share of $2.78 for the year ended December 31, compared to $2.61 for the same period in 2021.

Portfolio 3

Portfolio 3 for the week ended February 10, 2023: DOWN Red Down Arrow

  • Microsoft (NASD:MSFT) is incorporating artificial intelligence into its Bing search engine and Edge browser. Using a chatbot based on ChatGPT, it will be able to summarize web pages and integrate different sources, among other capabilities.
  • Brookfield Asset Management (TSX:BAM) increased its property and casualty insurance footprint in the US with the acquisition of Argo Group International (NYSE:ARGO). The deal is worth $1.1 billon and is expected to close later in 2023.
  • Enghouse Systems (TSX:ENGH) announced they acquired Mobi All Tecnologia S.A. (Navita), a Brazilian Software as a Service provider of Enterprise Mobility Management Solutions. Navita specializes in mobility and telecom expense management. Through this acquisition Enghouse hopes to expand their business in Brazil and upsell Navita’s solutions to their other clients.
  • Shopify (TSX:SHOP) is launching a shopping channel. Actually, it is a live video shopping feature, one of many new innovative products Shopify plans to roll out to attract new audiences for their merchants.

Activity

No significant activity to report this week.

Dividends

Dividends Received this week for the following companies:

Companies followed by DRIP (Dividend Re-Investment Plan) indicate additional shares were purchased with the dividend. Any cash leftover was added to the cash balance.

No dividends this past week.

Quarterly Reports

Telus International Inc.

All currency listed in millions of US dollars, except earnings per share.

Selected highlights from their fourth quarter 2022 financial results on February 9, 2023

  • Revenue of $630 for the three months ended December 31, compared to $600 for the same period in 2021. An increase of almost 5%.
  • Net income of $34 for the three months ended December 31, compared to net income of $36 in the same period in 2021.
  • Diluted earnings per ordinary share of $0.13 for the three months ended December 31, compared to $0.13 for the same period in 2021.


  • Revenue of $2,468 for the year ended December 31, compared to $2,194 for the same period in 2021. An increase of over 12%.
  • Net earnings of $183 for the year ended December 31, compared to net earnings of $78 in the same period in 2021.
  • Diluted earnings per ordinary share of $0.68 for the year ended December 31, compared to $0.29 for the same period in 2021.

Cloudflare, Inc.

All currency listed in thousands of US dollars, except earnings per share.

Selected highlights from their fourth quarter 2022 financial results on February 9, 2023

  • Revenue of $274,700 for the three months ended December 31, compared to $193,596 for the same period in 2021. An increase of almost 42%.
  • Net loss of $45,917 for the three months ended December 31, compared to a net loss of $77,501 in the same period in 2021.
  • Diluted loss per ordinary share of $0.14 for the three months ended December 31, compared to a loss per share of $0.24 for the same period in 2021.


  • Revenue of $975,241 for the year ended December 31, compared to $656,426 for the same period in 2021. An increase of over 48%.
  • Net loss of $193,381 for the year ended December 31, compared to a net loss of $260,309 in the same period in 2021.
  • Diluted loss per ordinary share of $0.59 for the year ended December 31, compared to loss per share of $0.83 for the same period in 2021.

Brookfield Corporation

All currency listed in millions of US dollars, except earnings per share.

Selected highlights from their fourth quarter 2022 financial results on February 6, 2023

  • Revenue of $24,213 for the three months ended December 31, compared to $21,787 for the same period in 2021. An increase of over 11%.
  • Net income of $44 for the three months ended December 31, compared to net income of $3,461 in the same period in 2021.
  • Diluted earnings per ordinary share of $0.23 for the three months ended December 31, compared to $0.66 for the same period in 2021.


  • Revenue of $92,769 for the year ended December 31, compared to $75,731 for the same period in 2021. An increase of over 22%.
  • Net earnings of $5,195 for the year ended December 31, compared to net earnings of $12,388 in the same period in 2021.
  • Diluted earnings per ordinary share of $1.19 for the year ended December 31, compared to $2.39 for the same period in 2021.

Central Banks

While preparing the Weekly Updates, I was increasingly writing about the Bank of Canada and the US Federal Reserve, the central banks for Canada and the USA, respectively. I knew they were central banks and they set the interest rates for their respective nations but that was about it. I soon discovered their actions had a significant impact on my investments, especially the Federal Reserve’s policies, so I decided I would like to know more about these two organizations.

Before looking at these two entities, its good to be clear on what is a central bank.

What is a central bank?

Throughout the world, each country has its own central bank. Most of the central banks are separate from their national governments, however, they are overseen by their respective national governments. For this article, let us focus on Canada’s Bank of Canada (BoC), and the USA’s Federal Reserve System (Fed).

Unlike the banks that individuals and businesses deal with in Canada and the US, the BoC and the Fed are not commercial banks that offers services to the public. Their role is to set and maintain the monetary policies of their respective countries, as well as ensure their respective financial system remains safe and secure. These two central banks are independent of each other and do not work together or coordinate their activities. However, I suspect they are aware of what each other is doing.

In 2022, the BoC found itself in the news more than it would like thanks to inflation hitting heights not seen for 40 years. To try and control inflation, the BoC raised the overnight interest rates to cool the Canadian economy and slow inflation. The overnight rate is the interest rate that the BoC expects to be used in Canadian financial markets for one-day (or “overnight”) loans between Canadian financial institutions (banks, credit unions, etc.). This rate becomes the prime rate which establishes how much it will cost to borrow money from the banks, whether it is a mortgage, a line of credit, personal or business loan or any other type of loan or debt. When the BoC raises its rate, it will cost more for commercial banks to borrow. These higher costs are in turn passed on to consumers and businesses. On the other hand, if the BoC lowers the benchmark rate, the lower rates will trickle down to borrowers.

The same applies to the Fed in the US. The Fed will set the benchmark rate for American financial institutions who in turn base their lending rates on this benchmark.

One other concept to be aware of is monetary policy. Monetary policy is a set of measures used by central banks to encourage or discourage the growth of demand for goods and services. These measures include adjusting the interest rate of overnight borrowing by commercials banks and increasing or decreasing the amount of cash available in the economy. Through these tools, monetary policy can be used to attempt to control inflation, unemployment, price and wages stability, and confidence in a nation’s currency. If you’d like a more detailed explanation, do an online search for ‘Canadian monetary policy’ or ‘US monetary policy

With that out of the way, let us look at the BoC and the Fed.

Bank of Canada

Bank of Canada Reduces Overnight Rate to 0.5% | First Foundation The BOC is located in Ottawa, Ontario. It came into existence in 1935 with the mission to “regulate credit and currency in the best interests of the economic life of the nation.”

The BoC is independent from the federal government to ensure the power to spend money remains separate from the power to create money. This independence allows the BoC to focus on medium- and long-term perspectives for the good of Canada rather than what is good for the governing party. One can only imagine the mess Canadian monetary policy would be in if politicians had direct input into the decisions. The BoC’s main duty is to promote financial stability by focusing on the following areas:

  • Monetary Policy: Establishes policies (interest rates and cash supply) that are designed to preserve the value and stability of the Canadian dollar by keeping inflation in the target range of 1% – 3%. One way it does this is by raising or lowering Canada’s overnight, or benchmark, interest rate.
  • Financial systems: Encourages a secure financial system for all members of the Canadian banking community. One of the ways it accomplishes this by being the lender of last resort for the Canadian banking industry.
  • Currency: The sole authority for issuing and managing Canada’s national currency. The BoC is responsible for the design, distribution, security, and supply of new Canadian currency.
  • Funds Management: Manages Canada’s public debt programs and foreign exchange reserves. They also provide Canadian denominated operating accounts for holding securities and gold for other foreign countries’ central banks.

How is the Bank of Canada structured?

At the end of 2021, the BoC employed over 2,000 people. It is overseen by a Board of Directors, led by the Governing Council, and managed by the Executive Council, as outlined below:

  • Board of Directors: Provides general oversight of the management and administration of the Bank with respect to strategic planning, financial and accounting matters, risk management, human resources, and other internal policies.
    The Board is composed of the BoC Governor and Senior Deputy Governor, plus 12 independent directors appointed to three-year, renewable terms by the federal Cabinet. The Deputy Minister of Finance is a non-voting Board member.
  • Governing Council: Responsible for the day-to-day conduct of Canada’s monetary policy and maintaining a dependable and efficient financial system. It includes the Governor, Senior Deputy Governor and the three Deputy Governors (4 Deputy Governors as of March 2023).
  • Executive Council: Responsible for the strategic direction of the BoC. It includes all the members of the Governing Council, plus the Chief Operating Officer and the Executive Director – Retail Payments Supervision.

The key positions at the BoC are:

  • Governor: The Governor is appointed by Canada’s Minister of Finance for a 7-year term, with approval of the federal Cabinet. The Governor is also Chair of the Board of Directors and leads the Governing Council. The Governor has full control over the business of the BoC.
  • Senior Deputy Governor: This position is appointed by the independent members of the Board, with approval of the federal Cabinet, for a 7-year term. It is a member of the Board of Directors and the Governing Council and oversees the BoC’s strategic planning and operations.
  • Deputy Governors: There are currently three Deputies who are responsible for:
    • Supervising the BoC’s financial system activities.
    • The BoC’s analysis of international economic developments in support of monetary policy decisions. They consult with the central banks of the Group of 7 countries and the Group of 20 countries.
    • Overseeing the Financial Markets Department.
    • Monitoring the Canadian economy and monetary policy.

The BoC meets eight times a year to make any announcements about changes to interest rates. At these meetings, the members decide whether to raise, lower or maintain Canada’s benchmark interest rate which is then used by banks and other financial institutions to establish their respective prime lending rate. Decisions are made by a consensus vote by the Governing Council.

Each quarter the bank provides an updated monetary policy report and its outlook for the Canadian economy. In the past, minutes from their meetings and discussions were not made public, however that changed following their January 25, 2023, meeting.

Finally, the BoC typically earns income from its assets (primarily Government of Canada bonds but includes provincial and corporate bonds, as well as other types of assets). Once all its expenses are paid, the net income is then transferred to the federal government. In 2021, it remitted C$2.7 billion.

Now that I have covered Canada’s central bank, lets look at America’s central bank, commonly referred to as the Fed.

US Federal Reserve System

Logo Description automatically generated The Fed was created in 1913 as an independent agency of the federal government, reporting to Congress twice a year. Located in Washington, D.C., the Fed is a not-for-profit agency and, after paying all expenses and setting aside a limited amount in a surplus fund, must transfer all earnings to the US Treasury.

The purpose of the Fed is to act in the best interest of the American public by supporting the health of the US economy while maintaining a stable financial system. It is also the most influential central bank in the world because the vast majority of currency transactions involve the US dollar. Changes implemented by the Fed can impact the currency and economies of many other countries. For example, Canada cannot let US benchmark interest rate get too much higher than the Canadian benchmark interest rate to avoid weakening the Canadian dollar which in turn makes all products from the US more expensive for Canadians.

How is the Fed structured?

The Federal Reserve Act purposely designed a decentralized system of a central bank rather than a single central bank. As the second tier in the graphic above illustrates, the central banking “system” has three main entities:

Figure uses a pyramid of graphics to describe the Federal Reserve System. Top level: There is 1 U.S. Central Bank: the Federal Reserve System. Second level: The 3 Key Entities of the Federal Reserve System: Federal Reserve Board of Governors, 12 Federal Reserve Banks, and the Federal Open Market Committee. Third level: The 5 Key Functions of the Federal Reserve System: conducting the nation's monetary policy, helping maintain the stability of the financial system, supervising and regulating financial institutions, fostering payment and settlement system safety and efficiency, and promoting consumer protection and community development.

  1. The Federal Reserve Board of Governors (BoG): Located in Washington, D.C, the BoG is the central governing body of the Fed. It is comprised of seven members (Governors), each nominated by the President and approved by the Senate. Each Governor serves a single 14-year term. The Chair and Vice Chair are selected from among the seven Governors by the President and approved by the Senate. The Chair and Vice Chair positions are 4-year terms and may be re-appointed to additional four-year terms until their 14-year term expires.
    The BoG manages the operations of the Fed by providing guidance, and oversight to the 12 regional Reserve Banks. They make public the minutes from the Federal Open Market Committee meetings, as well as the Fed’s independently audited financial statements.
  2. The Federal Reserve Banks (Reserve Banks): Located throughout the continental 48 states, the Reserve Banks are a decentralized operating structure of 12 geographic Reserve Banks. Each of the Reserve Banks collects economic information from their region and relay it to the Federal Open Market Committee, where monetary policy is decided. Essentially, the Reserve Banks are the banks used by commercial financial institutions (banks, credit unions, etc.) in their region. Each Reserve Bank has its own Chair, Deputy Chair (both appointed by the Fed’s BoG) and a Board of Directors, consisting of 5 – 7 members. These Boards are primarily appointed by the Reserve Bank itself, with the remaining positions appointed by the Fed’s BoG. Each Reserve Bank has a president.
  3. Federal Open Market Committee (FOMC): The FOMC is the committee within the Fed that establishes and manages the American monetary policy. They adjust the benchmark interest rate to keep the economy on the path to fulfill the Fed’s twin goals of maximum employment and price stability. When you hear the US benchmark interest rate has moved up, down or remained unchanged, this committee made the decision. As well as establishing the interest rate, they can purchase and sell securities on the open market to manage the monetary policy.

The FOMC is comprised of 12 voting members which includes all 7 members of the Fed’s BoG; the president of the Federal Reserve Bank of New York; and 4 of the remaining 11 Reserve Bank presidents, who serve one-year terms on a rotating basis. The remaining 7 Reserve Bank presidents not on the FOMC attend and participate in the meetings but do not vote on policy decisions. The Chair of the FOMC is the Chair of the Fed’s BoG, while the Vice Chair is the president of the Federal Reserve Bank of New York. All 12 members of the FOMC meet eight times per year in Washington DC, with additional meetings if necessary. After each meeting, they provide forward guidance for the interest rate that is consistent with their economic outlook, and they must explain any deviations from their projected path.

As the bottom tier in the graphic above illustrates, the Fed performs the five following functions to promote the American economy:

  1. Implements the monetary policy to maximize and stabilize the US economy.
  2. Ensures the stability of the American financial system by minimizing risk.
  3. Ensures the safety and soundness of individual financial systems.
  4. Strengthens the safety of payment and settlement systems that involve US dollar transactions.
  5. Promotes consumer protection by analysing emerging consumer issues and trends, administers consumer laws and regulations, among other responsibilities.

Key Differences

The BoC and the Fed have plenty in common. Both are responsible for implementing their respective monetary policy through interest rate decisions, issuing currency, regulating banks, and as the lender of last resort to commercial banks to ensure the stability of their respective financial systems. However, there are some significant differences, including:

  • The BoC focuses primarily on achieving price stability, while the Fed has a dual mandate of promoting both price stability and maximum employment.
  • The BoC operates as a crown corporation owned by the Canadian government, while the Fed is an independent entity within the US government.
  • The BoC’s Governor is appointed by Canada’s Minister of Finance with Cabinet approval, while each member of the Fed’s Board of Governors is appointed by the US President with Senate approval. The Chair and Vice Chair are chosen from the seven governors and appointed by the President and confirmed by the Senate. Being approved to the Fed appears to be much more difficult because a majority of Senators from across both political parties is required. In Canada, Cabinet members, which includes the Minister of Finance, are all from the same party.
  • According to the Bank of Canada Act, the BoC Governor makes Canada’s monetary policy. As shown in the recently published minutes from their January 25, 2023 meeting, the Governor heavily consults with the deputy governors and others to come to a consensus. In the US, decision making is shared across members of the FOMC.
  • The BoC is responsible for managing the Canadian dollar exchange rate against other major currencies. The Fed does not directly manage the exchange rates, relying on supply and demand to set the rate.
  • The BoC is responsible for the design of all Canadian currency, in conjunctions with the Royal Canadian Mint and major Canadian law enforcement agencies to prevent counterfeiting. The US Department of the Treasury’s Bureau of Engraving and Printing is responsible for the design of US currency. They work with the Fed, the US Secret Service and major American law enforcement agencies to protect the currency from counterfeiting.

Central Banks’ Influence on Investing

The most obvious influence on investors is through raising and lowering the interest rate. With the rise of inflation in Canada to a 40 year high in 2022, the BoC has fought to get inflation down to their 2% target, each increase of the interest rate was felt by every Canadian. When the BoC raises its lending rate to Canadian commercial banks, the banks immediately pass it on to consumers and businesses in the form of higher interest rates.

For investors, the higher interest rate means companies must spend more of their revenues servicing their debt rather than growing the business. Slower growth generally means slower share price appreciation, or in the case of high growth companies (like technology companies), share prices can plummet. Lower share prices can make them vulnerable to being bought by larger, financially healthier companies. If their debt payments become too large it can threaten their survival, pushing the company into bankruptcy. It is not fun watching your investments decline drastically. I realize its more than higher interest rates that make share prices drop significantly but they do not help.

It may be obvious that the biggest influence on Canadians is the BoC, but the Fed also has an impact on Canadians. One area that affects all Canadians is the gap between the Canadian and American benchmark rates. Generally, the difference is small. However, there are consequences when the gap gets too narrow or to far apart. Since the US economy is significantly larger than the Canadian economy (according to the World Bank, US$ 22.99 trillion compared to US$ 2 trillion), it is BoC that must adjust its interest rate, giving rise to the adage “when the U.S. sneezes Canada catches a cold.” If the Canadian interest rate gets too high (or too close to the US rate) it will push up the currency exchange rate, making Canadian exports more expensive. If the Canadian interest rate gets too low compared to the US rate, the Canadian currency exchange rate will drop, making US imports more expensive, which can lead to inflation.

Many Canadian investors are invested in American companies that trade on one of the American stock exchanges. Not only do we have to keep in mind currency exchange rates that can be impacted by interest rates, as outlined above, but the share prices of the American companies can rise and fall on changes to the US lending rate, just as Canadian companies on the Canadian exchanges respond to changes in the Canadian borrowing rate.

As well as interest rates, there are other ways the BoC and the Fed impact investing, including:

  • Economic Growth: Their actions to stimulate their respective economies through monetary policy (interest rates) can influence the overall level of the nation’s economic growth. A strong economy usually leads to growing markets (rising share prices), while a slowing economy is usually accompanied by falling markets (sinking share prices).
  • Inflation: Their ability to manage inflation expectations can affect the purchasing power of investments and their long-term value. As we saw in 2022, when inflation gets too high, the markets fall as interest rates rise to bring down inflation.
  • Market Sentiment: Their policy decisions can influence investor sentiment, which can affect the performance of different sectors and types of investments. Their announcements are dissected by analysts to get a sense of what moves they may make at upcoming meetings.

As you can see, the BoC and the Fed can have a significant impact on the stock markets, but there are other factors outside their control that can influence the performance of investments. Global economic conditions like those brought on by the Covid-19 pandemic, or geopolitical events such as Russia’s invasion of Ukraine will also impact investments (increase the price of oil and natural gas, for example). And do not forget company-specific actions are the biggest mover of share prices.

Summary

Although they are structured differently, both central banks are similar in that they are responsible for their respective nation’s monetary policy (setting the benchmark borrowing rate). Ideally, they would be happy if inflation stayed at 2% and they never had to move the interest rate one way or the other. However, stuff happens, causing economies to overheat or shrink. When it does, central banks will react accordingly, either adjusting the interest rate as necessary, or in the case of inflation, threatening to increase the rate to cool investor sentiment.

To wrap up, lets end with a good example of the impact the BoC and the Fed can exert is the last few years. The start of the Covid-19 pandemic threatened to shut down economies. In response, the BoC and the Fed lowered their respective benchmark interest rates to 0.25%. With the ‘cheap’ supply of money the economies quickly rebounded and ran too hot through 2021, as pent-up demand sent prices soaring as suppliers were unable to match demand. Inflation started creeping higher until finally both central banks hit the brakes on the economy. Both quickly increased the lending rate, making money borrowing money more expensive. Companies had to put more money towards servicing their debt at the expense of growing their business. Corporate earnings slowed or even declined, leading to a drop in share prices.

After researching and writing this article I had a much better understanding of these two central banks. I hope this piece provided you with a high-level view of the BoC and the Fed – their structure, their similarities and differences, and how they impact the companies we invest in. There is plenty more about the BoC and the Fed, but this site is about investing, not central banks. 😊. If you wish to know more, check out the Bank of Canada site and the Federal Reserve System, otherwise, thank you for reading.

Weekly Update for the week ending February 3, 2023

Items that may only interest or educate me ….

US interest rates, European interest rates, Huge job growth int the US, Slowing Canadian GDP, Big tech earnings’ misses …


As expected, in a unanimous decision by members of the US Federal Reserve System’s (Fed) Federal Open Market Committee (FOMC), they increased the US benchmark interest rate of 0.25%, bringing it to 4.75%. The FOMC started slowing the pace of increases beginning with a 0.5% increase in December following four consecutive increases of 0.75% from June through November.

In its statement announcing the latest hike, the Fed acknowledged for first time disinflation had started. Recent data has shown inflation in the America is dropping while the US economy is still growing with a strong labour market and slowing wage growth. It is this same data that caused the Fed to say there would likely be “ongoing increases” in to get inflation back to their target 2%. Future increases would likely be more traditional 0.25% increases. The number of those increases would depend on economic data and the cumulative effect of the fastest pace of interest rate growth in forty years.

The markets responded to the less aggressive sounding Fed with a rally. In a sense, investors said we don’t believe you won’t pause or start lowering rates soon. However, in a touch of irony, investor belief that inflation is beaten could lead to a rally that may actually drive inflation higher by increasing asset prices. Apparently too much of a good thing isn’t good for the markets. 😊


On the other side of the Atlantic, the Bank of England (BoE) raised the interest rate 0.5% bringing the British benchmark interest rate to 4.0%, the highest since 2008. That was the tenth consecutive increase since the BoE started hiking the rate in December 2021. The good news was the BoE suggested British inflation had probably peaked, and dropped their commitment to ‘forcefully’ continue increasing the interest rate.

Across the English Channel, after inflation in the 20 member European Union (EU) had fallen for the third straight month, the European Central Bank (ECB) raised its interest rate by 0.5%, bringing the EU benchmark rate to 2.5%. They also indicated an additional increase of a similar amount next month was likely. Once again investors interpreted the latest moves as a sign an end to the increases was near. However, the ECB threw cold water on those thoughts, stating they knew more work had to be done and they would ‘stay the course’ to get inflation back to their 2% target.

After the recent hikes from the US, the EU and the United Kingdom, the respective central banks all suggested there would be future increases to their respective benchmark interest rates. The Bank of Canada (BoC) was the first and only major central bank to signal it would pause interest rate hikes. Only time will tell if the BoC got it right.


The January US jobs report showed a remarkable growth in jobs, up 517,000, the most in six months, exceeding analysts’ expectations of 185,000 new jobs. Unemployment also fell to 3.4%, the lowest since 1969. That news will strengthen the case for the Fed to bump the US interest rate another notch or two down the road, lifting it above 5%, where it will probably have to remain longer than anticipated. One bit of good news for the Fed was wage growth continued to slow. Average hourly wages grew by 0.3%, down from December’s 0.4% growth.

While this latest data means its likely the Fed will increase the US borrowing rate, a lot can happen between now and their next meeting in late March. A continuing robust jobs market will only make it harder for the Fed to pause increases.


Statistics Canada reported the Canadian economy, or Gross Domestic Product (GDP), grew 0.1% in November, matching the BoC expectations. Data also indicated the economy was likely to be flat for December and is expected to remain flat, or stall, for the first half of 2023. The BoC had predicted the this and this latest data confirms the economy is slowing. Statistics Canada estimated GDP grew 1.6% for the fourth quarter, and 3.8% for 2022. If correct, both exceed BoC’s forecast of 1.6% and 3.6%, respectively.

If the Canadian economy does tread water for the next few months, let’s hope it can keep its head above water and if it does dip below the surface, its not for long.


Many of the A list mega cap technology companies reported this week, and none posted an ‘A’ on their earnings reports. Alphabet (NASD:GOOGL), Amazon (NASD:AMZN) and Apple (NASD:AAPL), three of the market’s largest companies all posted unimpressive quarterly results.

Alphabet missed analysts’ estimates for fourth quarter revenue and net income. Alphabet said revenues from advertising and YouTube declined year-over-year, as well as a deceleration in cloud business led to lower revenues while over hiring the last few years increased expenses. Recent staffing cuts should help reduce expenses.

Apple also missed revenue and earnings estimates thanks to Covid-19 lockdowns in China and worker protests at the Foxconn’s facility, Apple’s main manufacturer. Supply chain issues plagued the latest, greatest iPhone and led to problems getting phones into the hands of eager consumers. The company said the production problems have been resolved and are back to normal volumes. They are also seeking to improve gross margins.

Amazon reported better-than-expected sales growth estimates but missed earnings estimates. Revenues through their Prime program, third-party marketplace, logistics network, and Amazon Web Services (though growth was slowing) all increased. Much of the earnings problems can be attributed to losses on paper from its investment in electric vehicle maker Rivian Automotive (NASD:RIVN). Amazon is in the process of letting go 18,000 employees, closing a number of its physical storefronts and slowing the expansion of their fulfillment operations to reduce costs and expenses.

Definitely not the upbeat earnings reports these companies regularly produced the last few years.


It was a week driven by investor optimism and earnings announcement. Let’s see how they affected the markets this past week ….

Weekly Market Review

Monday: All four major North American indexes fell as investors awaited the US Federal Reserve’s (Fed) latest change to the US benchmark interest rate. After last week’s runup in the markets, investors are probably taking some money off the table to hedge against adverse announcements from the Fed and other major central banks.

In Canada, the Toronto Stock Exchange Composite Index (TSX) fell as oil prices dropped and interest sensitive technology companies saw their share prices sink ahead of expected interest rate hikes by the Fed.

In the US, it was similar story as the S&P 500 Index (S&P), the Dow Jones Industrial Average (DJIA), and the Nasdaq Composite Index (Nasdaq) all slumped ahead of the upcoming interest rate announcement and a big week for earnings announcements from many of the mega cap technology companies.

Tuesday: January ended with a bang as all indexes surged upwards to close out a strong January, getting 2023 off to a good start. Economic data out of the US showed fourth quarter labour cost growth slowed to its lowest level in a year, another sign inflation was falling. This news opened the door wider for the Fed to deliver a smaller increase tomorrow.

In Canada, the TSX closed out its strongest month in two years. Investors counting on the Fed raising the US interest rate by 0.25% moved back into the growth-oriented technology companies. Leading the Canadian sectors were the Technology and Basic Materials (miners and fertilizer manufacturers). The only sector not to end higher was the Utilities sector.

In the US, as well as the good economic news, many of the big, well-known companies released better than expected fourth quarter earnings. In trading, it was another broad-based advance for the American S&P sectors, with all sectors ending higher. The best sectors were Consumer Cyclicals and Industrials, while Telecommunications Services brought up the rear (but higher).

Wednesday: All four major North American indexes dropped during morning trading before reversing course upon the Fed’s interest rate announcement. As expected, the US interest rate increased by 0.25%, sending the three American indexes into the green. Oil prices fell as data showed US inventories had grown much higher than forecast.

In Canada, the TSX was lifted by the news out of the US but fell short of ending the green as a decline in global oil prices was too much to overcome. Responding to the news from the Fed, investors dove into the interest sensitive Consumer Cyclical and Technology sectors making them the top performers amongst the Canadian sectors. Weighing on the TSX were the Energy and Consumer Staples sectors which fell the most.

In the US, it wasn’t so much the amount of the interest rate hike but rather the acknowledgement inflation had started to fall that caused the three indexes to rally. In trading, the American S&P Technology and Consumer Cyclical sectors the best of the eleven sectors, while Energy was the only sector to end lower.

Thursday: It was a mixed day for the indexes as investors digested yesterday’s announcement from the Fed. The technology biased Nasdaq and S&P surged higher while the resource heavy TSX and blue chip DJIA ended lower. The Technology sector was powered by three surging heavyweight technology companies – Amazon, Apple and Alphabet – ahead of their earnings reports due once the market closed. Technology companies have started to reclaim the attention of investors after being shunned most of 2022.

In Canada, falling commodity prices dragged the TSX lower despite a surge in technology companies. On the TSX, the technology tailwind helped Technology sector gain the most with the Industrials sector a distant second. On the losing side, the Basic Materials and Energy sectors declined the most.

In the US, investors were willing to take on a bit more risk and moved backed into the higher risk Technology and Consumer Cyclical sectors. Accordingly, they were the two best performers of the eleven S&P sectors, while falling gold and oil prices knocked the Basic Materials and Energy sectors down the farthest.

Friday: The markets were bouncing up and down today with the TSX the only index to end the day in the green. Investors hopes of the Fed pausing the next interest rate hike suffered a major blow when the latest US jobs report came in three times higher than expected.

In Canada, the TSX ended higher on gains in Energy companies (despite oil prices dropping) but the jobs news out of the US limited the TSX’s advance. It was generally a good day on the TSX with the majority of sectors advancing, led by the Energy and Consumer Cyclical sectors. The Basic Materials, Utilities and Healthcare sectors were the only ones to end lower.

In the US, the jobs data and uninspiring earnings reports and forecasts from some of the larger American companies combined to drag all three American indexes lower today. All of the American S&P sectors ended the day lower. The Energy and Healthcare sectors dropped the least, while the Consumer Cyclical and Utilities sectors had the biggest drops.


Weekly Portfolio Review

For the week, the TSX gained ground for the fifth straight week, advancing 0.2%, the S&P 500 increased 1.6%, the Dow fell 0.2% and the Nasdaq also had a fifth consecutive weekly increase, this time growing 3.3%.

Bull market. A good week for the North American stock markets.

A good week once again in the North American stocks markets with three of the four major indexes advancing. Investors betting that the Fed will follow Canada’s lead and pause interest rates moved back into interest sensitive sectors like Technology and Consumer Cyclicals. As a result, the Nasdaq and S&P were the best performing sectors. The TSX also benefitted from a rise in Canadian technology companies but was constrained by falls in the natural resources sectors, Energy and Basic Materials. Bringing up the rear was the DJIA which lost ground thanks to mixed earning from some of the biggest American companies that are part of the DJIA.

Another good week for the portfolios. I’ve said it before, when the Nasdaq rises, it lifts all Portfolios. Portfolios 2 and 3 extended their respective winning streaks to five.

Weekly Portfolio & Index performance
Weekly Portfolio & Index performance for the week ended February 3, 2023.

Monthly Portfolio Review

For January, the TSX grew 7.1%, the S&P had its best January in four years gaining 6.2%, the Dow rose 2.8% and the Nasdaq had its best month since July, jumping 10.7%.

Bull market. A good week for the North American stock markets.Thankfully, January started 2023 off with a bang! After watching the markets get beaten down throughout 2022, January feels good.

A strong performance from all four indexes as investor optimism rose on economic data showing inflation was slowing without sending either country’s economy into a recession. Mind you, its too early to state a recession has been avoided, especially in Canada where growth is expected to be flat at best for much of 2023.

Investors were confident both central banks would increase lending rates by ‘only’ 0.25% and started getting back into the growthier oriented companies, especially the technology companies. The Nasdaq benefitted greatly from the rise in technology companies, while the S&P rode the coattails of the big technology companies that trade on the Nasdaq exchange and are part of both the Nasdaq and S&P indexes. The DJIA was lifted by overall market optimism, while the TSX was lifted by investors moving back into the market and rising oil and commodity prices.

The portfolios had a great month! All three portfolios are technology oriented, to one degree or another, and they benefited from a surging Nasdaq and a strong TSX. A very loose guideline is to match or beat the S&P, this month all three portfolios easily surpassed the S&P.

Portfolio 3 is the most technology heavy so I wasn’t surprised it was the best performer. Portfolio 1 has many of the big technology companies but also has a number swing for the fences companies that seem to be missing rather than hitting and are holding back the portfolio. Portfolio 2 continues to surprise me as it is more ‘balanced’ so I do not expect to see double digit gains, but I’m happy to get them. 😊 Hopefully 2023 will have more months like this!

A quick note. I’m sure if a licensed financial advisor looked at Portfolio 2 they would not consider it ‘balanced’ as it is 100% invested in stocks. I am OK with that. By balanced, I mean less high growth, riskier companies (technology and consumer cyclicals) and more diversified with dividend baying companies across a number of sectors.

Monthly Portfolio & Index performance
Monthly Portfolio & Index performance for January 2023.

Companies on the Radar

Stocks on my Radar

No new companies to run through the Radar Check this past week. That is probably a good thing since there are currently six companies already on the radar, listed below. I need to take a closer look at Supremex (TSX:SXP), Intact Financial (TSX:IFC), and DoubleVerify (NYSE:DV) to see if an initial position is warranted or if I should add to existing winners.

  • Crew Energy (TSX:CR): A Canadian oil and gas company with interests in British Columbia.
  • Supremex: a small cap company selling packing solutions throughout Canada and the USA.
  • International Petroleum (TSX:IPCO): A Canadian company with oil and gas assets in Canada, Malaysia, and France.
  • Alphabet (NASD:GOOGL): The leading online search engine and advertising company, dominant mobile operating system.
  • Intact Financial: a mid size insurance company supplying home, car and business insurance in Canada, the US, and the UK.
  • DoubleVerify: part of the digital advertising industry. Helps the world’s largest brands maximize and optimize the effectiveness of their online advertising.

The Radar Check was last updated February 3, 2022.

Graphical user interface, application, table Description automatically generated

Calendar Description automatically generated with medium confidence


Portfolio Update

Portfolio 1

Portfolio 1 for the week ended February 3, 2023: UP Green Up Arrow, signifying a positive week

  • Rogers Communications (TSX:RCI.B) and Shaw Communications (TSX:SJR.B) extended their merger closing date deadline to February 17 as they wait for the Canadian Industry Minister to sign off on the deal. Upon signoff, the deal will see Shaw’s Freedom Mobile spectrum licenses transferred to Quebecor’s (TSX:QBR.B) Videotron unit. The transfer of the licenses was one of the conditions to allow the merger to proceed.
  • General Motors (NYSE:GM) posted higher than expected net income for the fourth quarter, providing the share price with a nice boost. GM said it plans to trim US$ 2 billion from its automotive operations over the next two years, without any layoffs. They indicated they will be dependent on the sales of combustion engine trucks and SUVs, while they ramp up electric vehicle sales. Despite price cuts by Tesla (NASD:TSLA), GM is confident in their pricing strategy and do not plan to lower prices.
    In other GM news, the company plans to invest US$ 650 million in Canada’s lithium miner Lithium Americas (TSX:LAC) to secure a reliable source of lithium. The money will go towards developing Lithium America’s Nevada mine which would provide enough lithium to build 1 million electric vehicles annually. The deal is dependent on Lithium Americas winning a court case to keep its Nevada mining permits to obtain the first half of the investment. The second half of the investment is contingent on the company splitting its North and South American operations.
  • Tesla and Tesla’s CEO, Elon Musk, was found not liable for a misleading tweet that caused investors to claim they lost billions. This saves Tesla billions of dollars that can be used to grow the business.
  • Roku (NASD:ROKU) signed a deal with Warner Bros Discovery (NASD:WBD) to stream 2,000 hours of WBD content on a soon to be launched Warner Bros’s Free, Ad-Supported TV (FAST) channels. More content for Roku can’t hurt, as long as it is popular programs and not fodder.
  • Rivian (NASD:RIVN) announced they would reduce their workforce by 6% to slow the bleeding of cash. Rivian will focus its resources on increasing production and becoming profitable. The price cuts by Tesla and a potential price war did not do them any favours.
  • Ferrari (NYSE:RACE) announced four new models for 2023, including its first ever 4 door, 4 wheel drive Purosangue SUV. Ferrari plans to release its first fully electric vehicle (EV) in 2025, complete with an acoustic system that will make the EVs sound like Ferrari’s conventional powered cars.
  • The US Treasury Department announced an update to its vehicle classification definitions, allowing more Tesla and GM vehicles, among others, to be eligible for US tax credits. This should boost sales for both companies.

Activity

No significant activity to report this week.

Dividends

Dividends Received this week for the following companies:

Companies followed by DRIP (Dividend Re-Investment Plan) indicate additional shares were purchased with the dividend. Any cash leftover was added to the cash balance.

Canadian $

Toronto-Dominion Bank (TSX:TD) DRIP

Shaw Communications Inc (TSX:SJR.B)

US $

No US$ dividends this past week.

Quarterly Reports

General Motors Co.

All currency listed in millions of US dollars, except earnings per share.

Selected highlights from their fourth quarter 2022 financial results on January 31, 2023

  • Revenue of $43,108 for the three months ended December 31, compared to $33,584 for the same period in 2021. An increase of over 28%.
  • Net income of $1,999 for the three months ended December 31, compared to net income of $1,741 in the same period in 2021.
  • Diluted earnings per ordinary share of $1.39 for the three months ended December 31, compared to $1.16 for the same period in 2021.


  • Revenue of $156,735 for the year ended December 31, compared to $127,004 for the same period in 2021. An increase of over 23%.
  • Net earnings of $9,934 for the year ended December 31, compared to net earnings of $10,019 in the same period in 2021.
  • Diluted earnings per ordinary share of $6.13 for the year ended December 31, compared to $6.70 for the same period in 2021.

Apple Inc.

All currency listed in millions of US dollars, except earnings per share.

Selected highlights from their first quarter 2023 financial results on February 2, 2023

  • Revenue of $117,154 for the three months ended December 31, compared to $123,945 for the same period in 2021. A decrease of over 5%.
  • Net income of $29,998 for the three months ended December 31, compared to net income of $34,630 in the same period in 2021.
  • Diluted earnings per ordinary share of $1.88 for the three months ended December 31, compared to $2.10 for the same period in 2021.

BCE Inc.

All currency listed in millions of Canadian dollars, except earnings per share.

Selected highlights from their fourth quarter 2022 financial results on February 2, 2023

  • Revenue of $6,439 for the three months ended December 31, compared to $6,209 for the same period in 2021. An increase of almost 4%.
  • Net income of $567 for the three months ended December 31, compared to net income of $658 in the same period in 2021.
  • Diluted earnings per ordinary share of $0.58 for the three months ended December 31, compared to $0.69 for the same period in 2021.


  • Revenue of $24,174 for the year ended December 31, compared to $23,449 for the same period in 2021. An increase of over 3%.
  • Net earnings of $2,926 for the year ended December 31, compared to net earnings of $2,892 in the same period in 2021.
  • Diluted earnings per ordinary share of $2.98 for the year ended December 31, compared to $2.99 for the same period in 2021.

Lightspeed Commerce Inc.

All currency listed in thousands of US dollars, except earnings per share.

Selected highlights from their third quarter 2022 financial results on February 2, 2023

  • Revenue of $188,697 for the three months ended December 31, compared to $152,676 for the same period in 2021. An increase of almost 24%.
  • Net loss of $814,802 for the three months ended December 31, compared to a net loss of $65,492 in the same period in 2021.
  • Diluted loss per ordinary share of $5.39 for the three months ended December 31, compared to a loss per share of $0.44 for the same period in 2021.


  • Revenue of $24,174 for the year ended December 31, compared to $23,449 for the same period in 2021. An increase of over 3%.
  • Net loss of $995,541 for the year ended December 31, compared to a net loss of $173,916 in the same period in 2021.
  • Diluted loss per ordinary share of $6.64 for the year ended December 31, compared to a loos per share of $1.25 for the same period in 2021.

Amazon.com, Inc.

All currency listed in millions of US dollars, except earnings per share.

Selected highlights from their fourth quarter 2022 financial results on February 2, 2023

  • Revenue of $149,204 for the three months ended December 31, compared to $137,412 for the same period in 2021. An increase of almost 9%.
  • Net income of $278 for the three months ended December 31, compared to net income of $14,323 in the same period in 2021.
  • Diluted earnings per ordinary share of $0.03 for the three months ended December 31, compared to $1.39 for the same period in 2021.


  • Revenue of $513,983 for the year ended December 31, compared to $469,822 for the same period in 2021. An increase of over 9%.
  • Net loss of $2,722 for the year ended December 31, compared to net earnings of $33,364 in the same period in 2021.
  • Diluted loss per ordinary share of $0.27 for the year ended December 31, compared to earnings of $3.24 for the same period in 2021.

Alphabet Inc.

All currency listed in millions of US dollars, except earnings per share.

Selected highlights from their fourth quarter 2022 financial results on February 2, 2023

  • Revenue of $76,048 for the three months ended December 31, compared to $75,325 for the same period in 2021. An increase of almost 1%.
  • Net income of $13,624 for the three months ended December 31, compared to net income of $20,642 in the same period in 2021.
  • Diluted earnings per ordinary share of $1.05 for the three months ended December 31, compared to $1.53 for the same period in 2021.


  • Revenue of $282,836 for the year ended December 31, compared to $257,637 for the same period in 2021. An increase of almost 10%.
  • Net earnings of $59,972 for the year ended December 31, compared to net earnings of $73,033 in the same period in 2021.
  • Diluted earnings per ordinary share of $4.56 for the year ended December 31, compared to $5.61 for the same period in 2021.

Portfolio 2

Portfolio 2 for the week ended February 3, 2023: UP Green Up Arrow, signifying a positive week

  • A busy week of announcements for Guardant Health. First, the US Food and Drug Administration approved Guardant Health’s (NASD:GH) liquid biopsy test as a companion diagnostic for Menarini Group’s Orserdu drug for treatment of patients with certain advanced variations of breast cancer.
    They also announced their latest product, Guardant Galaxy, a set of analytical tools to increase the performance of their cancer tests. Guardant has incorporated artificial intelligence capabilities to better interpret biomarkers, and better predict patient response to immunotherapy.
    Finally, Guardant announced a partnership with AnHeart Therapeutics to use Guardant products as companion diagnostic tools for AnHeart’s non-small cell lung cancer drug. The Guardant products will be used to identify patients who may benefit from using AnHeart’s medications.
  • Walt Disney’s (NYSE:DIS) ‘Avatar: The Way of Water’ became the highest grossing film globally at the box office. It currently sits eleventh all time in the US market.
    In an effort to reduce losses, Disney is considering selling more of its media properties to other media outlets. That would be quite a change from their practice of keeping Disney content on Disney+ streaming services only. Both moves should improve the top line revenue numbers.
  • Telus (TSX:T) was ranked the top North American telecommunications company, 37th globally, by Corporate Knights in their Global 100 Most Sustainable Corporations. The award is for leadership and commitment to creating a better, more sustainable future. Corporate Knights evaluated nearly 7,000 companies with over US$ 1 billion in revenues so that is an impressive result.

Activity

No significant activity to report this week.

Dividends

Dividends Received this week for the following companies:

Companies followed by DRIP (Dividend Re-Investment Plan) indicate additional shares were purchased with the dividend. Any cash leftover was added to the cash balance.

Canadian $

TC Energy (TSX:TRP)

US $

No US$ dividends this past week.

Quarterly Reports

Brookfield Renewable Partners L.P.

All currency listed in millions of US dollars, except earnings per share.

Selected highlights from their fourth quarter 2022 financial results on February 3, 2023

  • Revenue of $1,196 for the three months ended December 31, compared to $1,091 for the same period in 2021. An increase of over 9%.
  • Net income of $60 for the three months ended December 31, compared to net income of $33 in the same period in 2021.
  • Diluted loss per ordinary share of $0.16 for the three months ended December 31, compared to a loss per share of $0.12 for the same period in 2021.


  • Revenue of $4,711 for the year ended December 31, compared to $4,096 for the same period in 2021. An increase of over 15%.
  • Net earnings of $138 for the year ended December 31, compared to net loss of $66 in the same period in 2021.
  • Diluted loss per ordinary share of $0.60 for the year ended December 31, compared to a loss per share of $0.69 for the same period in 2021.

Portfolio 3

Portfolio 3 for the week ended February 3, 2023: UP Green Up Arrow, signifying a positive week

  • Microsoft (NASD:MSFT) introduced a version of Teams that incorporated OpenAI’s artificial intelligence ChatGPT. The premium service will see ChatGPT create meeting notes, suggest tasks, and assist in the creation of meeting templates for Teams users. Teams is the first of many Microsoft applications to feature ChatGPT.

Activity

No significant activity to report this week.

Dividends

Dividends Received this week for the following companies:

Companies followed by DRIP (Dividend Re-Investment Plan) indicate additional shares were purchased with the dividend. Any cash leftover was added to the cash balance.

Canadian $

Toronto-Dominion Bank (TSX:TD)

US $

No US$ dividends this past week.

Quarterly Reports

Brookfield Renewable Partners L.P.

All currency listed in millions of US dollars, except earnings per share.

Selected highlights from their fourth quarter 2022 financial results on February 3, 2023

  • Revenue of $1,196 for the three months ended December 31, compared to $1,091 for the same period in 2021. An increase of over 9%.
  • Net income of $60 for the three months ended December 31, compared to net income of $33 in the same period in 2021.
  • Diluted loss per ordinary share of $0.16 for the three months ended December 31, compared to a loss per share of $0.12 for the same period in 2021.


  • Revenue of $4,711 for the year ended December 31, compared to $4,096 for the same period in 2021. An increase of over 15%.
  • Net earnings of $138 for the year ended December 31, compared to net loss of $66 in the same period in 2021.
  • Diluted loss per ordinary share of $0.60 for the year ended December 31, compared to a loss per share of $0.69 for the same period in 2021.