Items that may only interest or educate me ….
Canadian inflation data, US inflation data, …
Statistics Canada’s latest Canadian Industrial Product Price Index (IPPI), prices that producers in Canada receive as goods leave the plant, reported an increase of 0.4% in January over December, while on a year over year basis, producer prices went up 5.4%. Analysts had expected a decline of 0.1% and an increase of 7.6%, respectively. On a monthly basis, prices rose but on a yearly basis they continue to decline.
Despite the year over decline, the Bank of Canada (BoC) maintains the Canadian economy is still running too hot and the job market too strong, refencing last weeks Canadian jobs report that was ten times higher than expected. The BoC reiterated their plan to conditionally pause increases to the Canadian benchmark interest rate to see how the economy and inflation respond to the highest rate (4.5%) since 2007. However, they indicated they were prepared to raise the interest rate if the economy and labour market remain too strong.
In the US, it was a busy week for economic data.
Leading off, the US Bureau of Labor Statistics released the January Consumer Price Index (CPI) report which showed no major surprises. Inflation was up 0.5% since December and 6.4% on a yearly basis. Analysts were expecting 0.5% and 6.2%, respectively. Core CPI (CPI less food and energy components) gained 0.4% since December, and 5.6% on a yearly basis. Analysts had been expecting 0.4% and 5.5%, respectively. Overall, inflation was slightly higher.
Next up, retail sales. After a slow December for retail sales, Americans rebounded with a vengeance, increasing their buying by the fastest pace in almost two years. The US Commerce Department’s latest retail sales report showed sales increased 3% since December, compared to a decline of 1.1% from November to December. Analysts had expected an increase of 1.8% for January. Among the items in demand were cars, furniture, electronics, appliances, and going out to restaurants and pubs. With Americans buying more products and services, the American economy remains strong. Unfortunately, the strong demand is keeping inflation high.
Finally, the Producer Price Index (PPI), what suppliers charge businesses, gained 0.7% in January and 6.0% on an annual basis. Analysts were expecting 0.4% and 5.4% respectively. Core PPI (PPI less food, energy, and trade services) rose 0.5% in January, and grew 5.4% for the year, down slightly from December’s 5.5%. Analysts had been expecting 0.3 and 5.5%, respectively. While the PPI showed inflation going up monthly, it was falling on an annual basis. The primary driver of the higher PPI numbers was increased fuel prices. The PPI numbers suggest higher inflation in the US is sticking around, echoing the CPI data.
Inflation in the US is down from last summer’s high of 9.1% but there is still a long way to go to get back to the US Federal Reserve’s (Fed) target of 2%. A strong jobs report to start February, followed by lingering high inflation, a surge in consumer, topped off with comments from the Fed stating beating down inflation was their top priority, and you have the recipe for another increase to the US benchmark interest rate. It is almost a certainty the Fed will raise the rate by 0.25%, if not more, at their next meeting in March. Depending on the data, it is looking more likely there will another increase at their May session. It seems a foregone conclusion the Fed will push the benchmark rate above 5% and keep it there longer, but is 6% possible? Hopefully not but it will take months to find out.
If you’re looking for the silver lining in stronger-than-expected data on jobs, retail sales and inflation, fears of a recession in the US have faded. 😊
Talking about inflation and economic data can cause one’s eyes to glaze over so I kept it short this week. However it was that data and the corresponding words from the central banks that largely moved the stock markets this past week. Now that you know what drove the market, let’s see what happened in the markets this past week….
Weekly Market Review
Monday: The North American markets rebounded from their worst week of 2023 so far, with all four major North American indexes ending higher. Upcoming inflation reports for the USA had investors concerned about potential increases to interest rates. The upcoming data will provide clues into whether, or by how much, the Fed will raise the American benchmark interest rate.
In Canada, the Toronto Stock Exchange Composite Index (TSX) ended higher as investors await the latest economic data from south of the border. In trading on the Toronto Stock Exchange (TSE), the interest rate sensitive Consumer Cyclicals and Technology sectors led a broad rally that saw only the Utilities sector fail to advance.
In America, the S&P 500 Index (S&P), the Dow Jones Industrial Average (DJIA), and the Nasdaq Composite Index (Nasdaq) had a strong start to the week, each rising more than 1%. In trading on the New York Stock Exchange and the Nasdaq Exchange, ten of the eleven S&P sectors advanced, led by the Technology and Consumer Staples sectors. The Energy sector was the only sector to end lower.
Tuesday: A mixed day for the indexes, with the TSX and the Nasdaq ending higher while the S&P and DJIA both ended lower. The big news was the US CPI data showed prices rose 0.5% since December, and were 6.4% higher, year over year. The slow pace of disinflation has investors concerned the Fed will increase the US interest rate at their March session. The price of oil dropped after the US announced it would release more oil from its Strategic Petroleum Reserve.
In Canada, the TSX got off to a quick start before falling sharply, then slowly climbing, to end the day in the green by the narrowest margin (.01%). On the Canadian exchanges, the Technology and Healthcare had the biggest gains of the Canadian sectors, while Consumer Staples and Utilities were a drag on the TSX.
In the US, no major surprises from today’s CPI report caused the indexes to drift as investors considered how the data would impact the Fed’s next rate announcement. Investors now turn to Wednesday’s retail sales data to see if consumer spending increased in January. In trading on the American exchanges, the Consumer Cyclicals and Technology sectors climbed the most, while Consumer Staples and Utilities led the decliners.
Wednesday: The indexes spent most of the day lower before a rally in the last 10 minutes nudged all four indexes into the green. January’s retail sales in the US rose by 3% over December, indicating the US economy remains strong. Recent US data (higher jobs, higher CPI, and now higher retail sales) has investors concerned about the Fed’s next move.
In Canada, the TSX overcame falling energy and resource stocks to make it over the wire at the last minute. On the TSE, big winners were the Technology and Healthcare sectors, while the Basic Materials (miners and fertilizer manufacturers), Energy and Telecommunications Services sectors were the only Canadian sectors to end lower.
In the US, strong retail sales data helped push all three American indexes higher, overcoming investor’s concerns of higher interest rates. Of the eleven S&P sectors, Consumer Cyclicals and Technology climbed the most, while Energy and Healthcare were the only two sectors to decline.
Thursday: All four indexes sank on news that the US January Producer Price Index (PPI) came in almost twice as high (0.7%) as expected (0.4%). As well, two members of the Fed suggested the US could be in for a drawn out battle with inflation, sending the markets tumbling.
In Canada, the TSX didn’t sink as much as its American cousins, but it still fell with the ebbing American tide. Not helping matters was Shopify (TSX:SHOP) forecasting slower revenue growth during the first quarter, causing the share price to fall 15%. Elsewhere on the TSE, the Basic Materials and Consumer Cyclicals sectors gained the most, while the Technology (thanks to Shopify) and Energy dropped the most, dragging the TSX down with them.
In the US, as well as the higher than expected PPI, weekly jobless claims unexpectedly fell confirming a strong labour market in the US. In trading, it was a broad based retreat across all S&P sectors with Telecommunications Services and Basic Materials sectors sinking the least and Technology and Consumer Cyclical dropping the most.
Friday: more tough talk from the Fed caused all four indexes to fall. Investors are anticipating the Fed will raise the US interest rate by at least 0.25%, at their next meeting. Oil prices continue to fall as higher inventory levels and fears of higher interest rates outweigh increased demand from China.
In Canada, a higher-than-expected Industrial Product Price Index (IPPI), fueled largely by higher fuel prices (pun intended), increased investors concerns that the BoC may raise the interest rate again to cool off the economy. In the Canadian sectors, Telecommunications Services and Healthcare had the biggest gains, while Energy and Basic Materials sank the most.
In the US, lingering high inflation and a strong economy has investors concerned the data will prompt the Fed to raise interest rates a few more times in 2023, sending the benchmark rate to at least 5.25%. In the American sectors, Telecommunications Services and Consumer Staples rose the most, with Energy and Technology had the biggest drop.
Weekly Portfolio Review
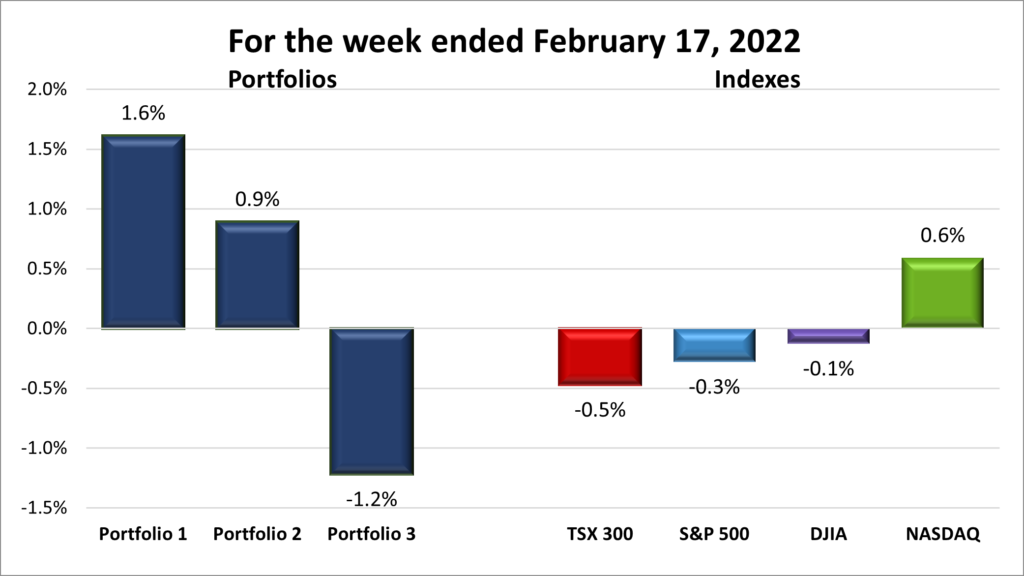
For the week, the TSX fell 0.5%, the S&P 500 declined 0.3%, the Dow sank 0.1% and the Nasdaq gained 2.15%.
![]()
A relatively flat week in the market saw gains early in the week, only to give them back at the end of the week, as shown in the chart above. The combination of a strong US economy and resurgent inflation caught the eye of the Fed. Various Fed members spoke about the need to ratchet up interest rates to slow down inflation. The data and words were enough to send the markets lower. Despite the threat of higher interest rates, the Nasdaq was able to post another winning week, with the DJIA essentially flat and the S&P barely in the red. In Canada, although the BoC said it would maintain the course and pause interest rate hikes, the TSX was still dragged down by the threat of higher US interest rates that would negatively impact many of the energy and mining companies listed on the TSX. With three of the four indexes lower for the week, I am marking it as a bear week.
![]()
Despite three of the four indexes ending the week lower, two of the portfolios still managed to post weekly gains, as shown below. The success of the portfolios is likely due to the success of the Technology sector in Canada and the USA. As shown below, the technology heavy Nasdaq was the only index to gain ground this past week. If Shopify’s share price hadn’t dropped 20% during the week, Portfolio 3 might have joined the other two portfolios in the win column. With two of the three portfolios higher for the week, I am marking it as a bull week.
Companies on the Radar

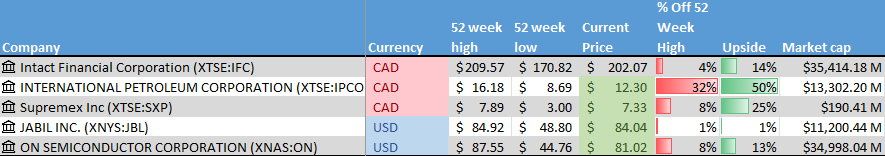
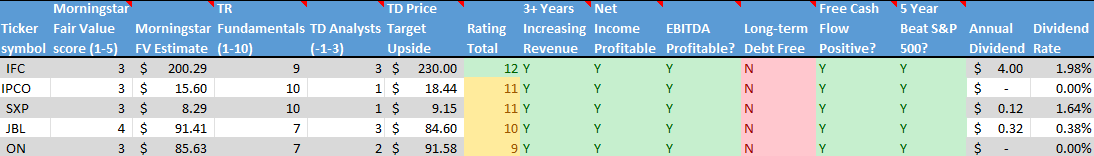
No new companies came across my radar this past week. However, two have gone off the radar, but for different reasons. Crew Energy (TSX:CR) had been on my radar for a while. This past week I finally purchased shares for Portfolio 2. The other company to fall off the radar was Alphabet (NASD:GOOGL). The company is currently facing a few regulatory headwinds and the recent underwhelming performance of its artificial intelligence chatbot Bard caused me to wonder if it was losing ground to Microsoft (NASD:MSFT). For now, the five companies remaining on my radar are:
- Intact Financial (TSX:IFC): a mid size insurance company supplying home, car and business insurance in Canada, the US, and the UK.
- International Petroleum (TSX:IPCO): A Canadian company with oil and gas assets in Canada, Malaysia, and France.
- Supremex: (TSX:SXP) a small cap company selling packing solutions throughout Canada and the USA.
- ON Semiconductor (NASD:ON) an American company that makes intelligent sensor and power solutions that enable the electrification of the automotive industry.
- Jabil Inc. (NYSE:JBL), an American company with global operations that specializes in providing manufacturing services and solutions.
The Radar Check was last updated February 17, 2022.
Portfolio Update
Portfolio 1
Portfolio 1 for the week ended February 17, 2023: UP ![]()
 Amazon (NASD:AMZN) successfully tested a robotaxi on a public road, ferrying Amazon employees between two Amazon buildings. With the successful completion of the test, Amazon’s Zoox self driving vehicle unit moved closer to obtaining regulatory approval. Zoox’s all electric robotaxi was designed from scratch and does not include a steering wheel, gas, or brake pedals. It has room for four passengers, with two facing each other.
- According to Bank of America (NYSE:BAC), Nvidia (NASD:NVDA) is well positioned for the upcoming artificial intelligence (AI) race. BAC suggested the growth of AI could lead to a tremendous growth in data centres in the next five years. As the leading semiconductor manufacturer for AI and data centres with 75% of the market, BAC suggests Nvidia should be able to maintain at least 65% of the market.
- One day after workers at a Tesla facility in Buffalo, NY, attempted to join a union, Tesla (NASD:TSLA) let go over 30 employees at that location. All employees were part of Tesla’s Autopilot automated driving team.
Tesla recalled over 362,000 US vehicles to update their Full Self Driving software. US officials said their driver assistance software didn’t adhere to speed limits, traffic laws and has been known to cause crashes. - Trisura (TSX:TSU) rescheduled the release of the fourth quarter earnings report from February 9 to sometime in February to review information from its US subsidiary. I’ve never heard of a company rescheduling an earnings release for good news so I imagine they are having a difference of opinion with their auditor or they are trying to figure a way to spin bad news.
- Susan Wojcicki, the CEO of Alphabet’s YouTube, is leaving the company and will be replaced by YouTube’s #2, her deputy Neal Mohan. Ms. Wojcicki was one of Google’s earliest employees (employee #16), back when the search giant originally started in her garage almost 25 years ago. Since she took the helm 9 years ago, ad revenue has taken off. Last year, YouTube brought in nearly 10% of Alphabet’s total revenues.
- The Rogers Communications (TSX:RCI.B) acquisition of Shaw Communications (TSX:SJR.B) deadline to close has been extended until March 31. The deal awaits the formal approval of the Canadian Industry Minister.
Activity
Sold Brookfield Select Opportunities Fund (TSX:BSO.UN). This was originally bought as a relatively low risk way of generating income thanks to a generous 10% dividend. It was managed by Brookfield Corporation (TSX:BN), so I felt confident in management. Over the last two months the share price of BSO fell from over C$ 5.00 per share to less than C$ 2.00. An article suggested its current sub C$ 2 share price was more reflective of its underlying assets. At C$2 per share, its dividend jumped to 33%. If the 10% dividend was unsustainable, a 33% dividend is untenable. As a result, management was evaluating their options which include reducing the dividend and liquidating the fund. Either way, my reason for investing is gone so I cut my losses. I have sold all BSO shares across all three portfolios.
Dividends
Dividends Received this week for the following companies:
Companies followed by DRIP (Dividend Re-Investment Plan) indicate additional shares were purchased with the dividend. Any cash leftover was added to the cash balance.
Canadian $
Dream Industrial Real Estate Investment Trust (TSX:DIR.UN)
BSR Real Estate Investment Trust (TSX:HOM.U)
US $
Apple Inc. (NASD:AAPL)
Quarterly Reports
Lattice Semiconductor Corporation
All currency listed in thousands of US dollars, except per share data.
Selected highlights from their fourth quarter 2022 financial results on February 13, 2023
- Revenue of $175,960 for the three months ended December 31, compared to $141,795 for the same period in 2021. An increase of over 21%.
- Net income of $51,913 for the three months ended December 31, compared to net income of $28,532 in the same period in 2021.
- Diluted earnings per ordinary share of $0.37 for the three months ended December 31, compared to $0.20 for the same period in 2021.
- Revenue of $660,356 for the year ended December 31, compared to $515,327 for the same period in 2021. An increase of over 28%.
- Net earnings of $178,882 for the year ended December 31, compared to net earnings of $95,922 in the same period in 2021.
- Diluted earnings per ordinary share of $1.27 for the year ended December 31, compared to $0.60 for the same period in 2021.
The Trade Desk, Inc.
All currency listed in thousands of US dollars, except per share data.
Selected highlights from their fourth quarter 2022 financial results on February 15, 2023
- Revenue of $490,737 for the three months ended December 31, compared to $395,598 for the same period in 2021. An increase of over 24%.
- Net income of $71,187 for the three months ended December 31, compared to net income of $8,039 in the same period in 2021.
- Diluted earnings per ordinary share of $0.14 for the three months ended December 31, compared to $0.2 for the same period in 2021.
- Revenue of $1,577,795 for the year ended December 31, compared to $1,196,467 for the same period in 2021. An increase of over 31%.
- Net earnings of $53,385 for the year ended December 31, compared to net earnings of $137,762 in the same period in 2021.
- Diluted earnings per ordinary share of $0.11 for the year ended December 31, compared to $0.28 for the same period in 2021.
Roku, Inc.
All currency listed in thousands of US dollars, except per share data.
Selected highlights from their fourth quarter 2022 financial results on February 15, 2023
- Revenue of $867,056 for the three months ended December 31, compared to $865,329 for the same period in 2021. An increase of almost 1%.
- Net loss of $237,197 for the three months ended December 31, compared to net income of $23,687 in the same period in 2021.
- Diluted loss per ordinary share of $1.70 for the three months ended December 31, compared to earnings per ordinary share of $0.17 for the same period in 2021.
- Revenue of $3,126,534 for the year ended December 31, compared to $2,764,584 for the same period in 2021. An increase of over 13%.
- Net loss of $498,005 for the year ended December 31, compared to net earnings of $242,385 in the same period in 2021.
- Diluted loss per ordinary share of $3.62 for the year ended December 31, compared to earnings per ordinary share of $1.71 for the same period in 2021.
Upwork Inc.
All currency listed in thousands of US dollars, except per share data.
Selected highlights from their fourth quarter 2022 financial results on February 15, 2023
- Revenue of $161,442 for the three months ended December 31, compared to $136,856 for the same period in 2021. An increase of almost 18%.
- Net loss of $16,500 for the three months ended December 31, compared to net loss of $22,556 in the same period in 2021.
- Diluted earnings per ordinary share of $0.13 for the three months ended December 31, compared to $0.18 for the same period in 2021.
- Revenue of $457,916 for the year ended December 31, compared to $367,289 for the same period in 2021. An increase of almost 25%.
- Net loss of $89,885 for the year ended December 31, compared to net loss of $56,240 in the same period in 2021.
- Diluted earnings per ordinary share of $0.69 for the year ended December 31, compared to $0.44 for the same period in 2021.
Datadog, Inc.
All currency listed in thousands of US dollars, except earnings per share.
Selected highlights from their fourth quarter 2022 financial results on February 16, 2023
- Revenue of $469,399 for the three months ended December 31, compared to $326,198 for the same period in 2021. An increase of almost 44%.
- Net loss of 29,034 for the three months ended December 31, compared to net income of $7,169 in the same period in 2021.
- Diluted loss per ordinary share of $0.09 for the three months ended December 31, compared to earnings per share of $0.02 for the same period in 2021.
- Revenue of $1,675,100 for the year ended December 31, compared to $1,028,784 for the same period in 2021. An increase of almost 63%.
- Net loss of $50,160 for the year ended December 31, compared to net loss of $20,745 in the same period in 2021.
- Diluted loss per ordinary share of $0.16 for the year ended December 31, compared to a loss per share of $0.07 for the same period in 2021.
Portfolio 2
Portfolio 2 for the week ended February 17, 2023: UP ![]()
- Guardant Health (NASD:GH) was back in the news with the announcement of a new study to evaluate the impact of Shield, Guardant’s blood test to screen for colorectal cancer. It is hoped that the Shield test will help patients follow screening recommendations. It is hoped that the Shield blood test will increase the number of patients who test for colorectal cancer.
Activity
Bought Crew Energy. This is the second purchase of Crew Energy, however it is the first for Portfolio 2. As with the first purchase, I hope to capitalize on the growing global demand for oil and natural gas. The company has grown it’s top and bottom line (revenues and net income), and share price has appreciated 50% since the original purchase 16 months ago. My only concern is the current Canadian governments ‘End of Energy’ transition.
Sold Brookfield Select Opportunities Fund. See Portfolio 1 for explanation.
Dividends
Dividends Received this week for the following companies:
Companies followed by DRIP (Dividend Re-Investment Plan) indicate additional shares were purchased with the dividend. Any cash leftover was added to the cash balance.
No dividends this past week.
Quarterly Reports
TC Energy Corporation
All currency listed in millions of Canadian dollars, except per share data.
Selected highlights from their fourth quarter 2022 financial results on February 14, 2023
- Revenue of $4,041 for the three months ended December 31, compared to $3,584 for the same period in 2021. An increase of almost 13%.
- Net loss of $1,447 the three months ended December 31, compared to net income of $1,118 in the same period in 2021.
- Diluted earnings per ordinary share of $1.11 for the three months ended December 31, compared to $1.05 for the same period in 2021.
- Revenue of $14,977 for the year ended December 31, compared to $13,387 for the same period in 2021. An increase of almost 12%.
- Net earnings of $641 for the year ended December 31, compared to net earnings of $1,815 in the same period in 2021.
- Diluted earnings per ordinary share of $0.64 for the year ended December 31, compared to $1.87 for the same period in 2021.
iAG Financial Group
All currency listed in millions of Canadian dollars, except per share data.
Selected highlights from their fourth quarter 2022 financial results on February 14, 2023
- Revenue of $3,492 for the three months ended December 31, compared to $3,353 for the same period in 2021. An increase of over 4%.
- Net earnings of $229 the three months ended December 31, compared to net income of $209 in the same period in 2021.
- Diluted earnings per ordinary share of $2.17 for the three months ended December 31, compared to $1.94 for the same period in 2021.
- Revenue of $13,109 for the year ended December 31, compared to $13,164 for the same period in 2021. A decrease of almost 1%.
- Net earnings of $817 for the year ended December 31, compared to net earnings of $830 in the same period in 2021.
- Diluted earnings per ordinary share of $7.65 for the year ended December 31, compared to $7.70 for the same period in 2021.
Dream Industrial Real Estate Investment Trust
All currency listed in thousands of Canadian dollars, except per share data.
Selected highlights from their fourth quarter 2022 financial results on February 14, 2023
- Revenue of $75,458 for the three months ended December 31, compared to $60,432 for the same period in 2021. An increase of almost 25%.
- Net loss of $34,147 the three months ended December 31, compared to net income of $189,971 in the same period in 2021.
- Diluted earnings per ordinary share of $0.23 for the three months ended December 31, compared to $0.21 for the same period in 2021.
- Revenue of $281,587 for the year ended December 31, compared to $217,899 for the same period in 2021. An increase of over 16%.
- Net earnings of $705,885for the year ended December 31, compared to net earnings of $608,345 in the same period in 2021.
- Diluted earnings per ordinary share of $0.89 for the year ended December 31, compared to $0.81 for the same period in 2021.
Chorus Aviation Inc.
All currency listed in thousands of Canadian dollars, except per share data.
Selected highlights from their fourth quarter 2022 financial results on February 15, 2023
- Revenue of $439,755 for the three months ended December 31, compared to $346,516 for the same period in 2021. An increase of almost 27%.
- Net income of $45,852 for the three months ended December 31, compared to net income of $10,159 in the same period in 2021.
- Diluted earnings per ordinary share of $0.11 for the three months ended December 31, compared to $0 for the same period in 2021.
- Revenue of $1,595,804 for the year ended December 31, compared to $1,023,275 for the same period in 2021. An increase of almost 56%.
- Net earnings of $51,917 for the year ended December 31, compared to net loss of $20,485 in the same period in 2021.
- Diluted earnings per ordinary share of $0.13 for the year ended December 31, compared to a loos per share of $0.12 for the same period in 2021.
Portfolio 3
Portfolio 3 for the week ended February 17, 2023: DOWN ![]()
- Microsoft is set to defend its acquisition of Activision Blizzard (NASD:ATVI) in front of the European Commission (EC). Microsoft claims the acquisition will enable it to better compete with its rivals while the EC is concerned the deal is anti-competitive. Microsoft is expected to offer remedies that will allow the EC to give its blessing to the deal.
Microsoft funded OpenAI, the developer of ChatGPT that will be used by Microsoft’s search engine Bing and other Microsoft applications, announced they are upgrading ChatGPT so it can be customized. OpenAI hopes this will address and mitigate concerns about various political and social biases.
Microsoft is considering allowing advertisers to insert links within Bing’s artificial intelligence powered answers. Integrating ads into Bing’s chatbot would ensure the ads are not pushed down the page, below the chatbot. I’m sure Microsoft will charge a premium for this ad space. - Brookfield Asset Management (TSX:BAM) plans to buy the remaining 50% stake in Spain’s X-elio, a renewable power company. Brookfield already owns 50% and has the right of first refusal on the 50% it does not own.
Activity
Sold Brookfield Select Opportunities Fund. See Portfolio 1 for explanation.
Dividends
Dividends Received this week for the following companies:
Companies followed by DRIP (Dividend Re-Investment Plan) indicate additional shares were purchased with the dividend. Any cash leftover was added to the cash balance.
No dividends this past week.
Quarterly Reports
Shopify Inc.
All currency listed in thousands of US dollars, except per share data.
Selected highlights from their fourth quarter 2022 financial results on February 15, 2023
- Revenue of $1,734,978 for the three months ended December 31, compared to $1,380,024 for the same period in 2021. An increase of almost 26%.
- Net loss of $602,155 for the three months ended December 31, compared to net loss of $371,395 in the same period in 2021.
- Diluted loss per ordinary share of $0.49 for the three months ended December 31, compared to a loss per share of $0.30 for the same period in 2021.
- Revenue of $5,599,864 for the year ended December 31, compared to $4,611,856 for the same period in 2021. An increase of over 21%.
- Net loss of $3,470,917 for the year ended December 31, compared to net earnings of $2,899,915 in the same period in 2021.
- Diluted loss per ordinary share of $2.73 for the year ended December 31, compared to earnings of $2.29 for the same period in 2021.
goeasy Ltd.
All currency listed in thousands of Canadian dollars, except per share data.
Selected highlights from their fourth quarter 2022 financial results on February 15, 2023
- Revenue of $273,326 for the three months ended December 31, compared to $234,430 for the same period in 2021. An increase of almost 17%.
- Net income of $28,576 for the three months ended December 31, compared to net income of $49,961 in the same period in 2021.
- Diluted earnings per ordinary share of $1.71 for the three months ended December 31, compared to $2.90 for the same period in 2021.
- Revenue of $1,019,336 for the year ended December 31, compared to $826,722 for the same period in 2021. An increase of over 23%.
- Net earnings of $140,161 for the year ended December 31, compared to net earnings of $244,943 in the same period in 2021.
- Diluted earnings per ordinary share of $8.42 for the year ended December 31, compared to $14.62 for the same period in 2021.