The TSX: From Trading Club to Major Market
A few weeks ago, while writing the weekly portfolio update, I came across a stock I assumed was on the Toronto Stock Exchange, only to discover it was actually on the TSX Venture Exchange. Then I saw another company I thought was a Venture listing but was actually on the main TSX. That mix-up sent me down a rabbit hole about how the Exchange works and its history. I found the story surprisingly interesting, and this week I thought I’d share some of that history behind Canada’s largest stock market – the Toronto Stock Exchange (TSX).
The TSX’s story begins in 1852, when a group of Toronto brokers formed an informal trading club. By 1861, they incorporated as the Toronto Stock Exchange, making it one of the oldest exchanges in the world. It became part of the TMX Group in 2001 and adopted the shorter “TSX” branding. While it has kept up with modern technology, the TSX still carries a sense of history and stability that reflects Canada’s economic backbone – banking, energy, mining, and industrials. Long before the rest of the world embraced electronic trading, the TSX was ahead of the curve – it went fully electronic in 1997, well before many major global exchanges made the switch. Until the mid-90s, it even quoted prices in old-school fractions like eighths and sixteenths, a holdover from its early British influences. Located in Toronto’s financial district at 130 King Street, the exchange operates entirely electronically today, but its influence runs through almost every part of the Canadian economy.
Where the TSX really stands out is in its two-tier structure. The main TSX is home to established companies with larger market caps, stronger financials, and long operating histories – the big banks like Royal Bank (TSE: RY) and TD (TSE: TD), energy giants like TC Energy (TSE: TRP), railways like CN Rail (TSE: CN), and more recently, a rising wave of tech names such as Shopify (TSE: SHOP), Celestica (TSE: CLS), and clean-energy firms like Brookfield Renewable Partners (TSX: BEP.UN). The TSX Venture Exchange, on the other hand, is where younger, early-stage public companies list. These are often small-cap or micro-cap firms, particularly in mining exploration, energy, and emerging technologies, looking to raise their first meaningful rounds of public capital.
The relationship between the two exchanges is almost like a built-in growth ladder. Companies that start on the Venture exchange can “graduate” to the main TSX once they meet requirements around market cap, financial strength, governance, and liquidity. Many of Canada’s most successful firms followed this path: start small, build momentum, then move up once they’ve proven they can play on the bigger stage. That said, not every company chooses to move up; for some, staying on the Venture exchange makes more sense if growth is slow, plans are uncertain, or the costs of a TSX listing aren’t justified.
Behind the scenes, the TSX runs on a modern electronic infrastructure similar to other major global exchanges. Trades are matched in milliseconds, and liquidity is supported by a deep pool of domestic and international institutions. On an average day, the TSX sees tens of millions of shares traded across hundreds of listed companies, reflecting steady participation from banks, pension funds, asset managers, and retail investors alike. It may not move at the same blistering pace as the Nasdaq Exchange, but the TSX’s combination of stability, liquidity, and sector strength makes it a cornerstone for Canadian investors, and for global investors with an eye on Canada’s resource-rich economy.
We’ll save the full story of Canada’s Venture Exchange — along with the history of the New York Stock Exchange and Nasdaq — for the coming weeks. For now, with the TSX’s history and structure fresh in mind, here’s a look at the market moves that kept investors busy over the past week…
Items that may only interest or educate me ….
Canadian Economic news, US Economic news, ….
Canadian Economic news
This past week’s key economic data that the Bank of Canada (BoC) considers when deciding whether to raise or lower the interest rate.
Gross Domestic Product (GDP)
September Report
Canada’s economy showed a bit more life in September than many expected. Statistics Canada reported that real GDP grew 0.2% month over month, reversing a small 0.1% dip in August. It wasn’t a huge surge, but it was enough to suggest the economy might be catching its breath after a tough summer.
Most of the momentum came from goods-producing industries, which climbed 0.6%. Utilities led the pack with a solid 0.9% gain, while construction slipped 0.2%, the only goods-producing sector to decline. Services also improved, rising 0.1%, with transportation and warehousing standing out at 1.2%, although management of companies and enterprises pulled back 2.0%.
Looking at the past year, goods-producing industries were up 1.4%, powered by a 5.2% jump in mining, quarrying, and oil and gas extraction. Utilities, however, fell 3.1%. Services grew 0.9% year over year, helped by a 2.5% rise in accommodation and food services. The biggest drag was a 22.8% decline in management of companies and enterprises.
Overall, September’s GDP lift feels like a small but welcome break in the recent slowdown. It hints at some resilience, though growth remains uneven. The outlook is cautious: early estimates suggest a 0.3% GDP drop in October, so the rebound may not last without stronger consumer spending and investment.
For those new to the term, ‘real GDP’ isn’t just a fancy way of saying GDP. GDP measures the total value of all goods and services a country produces, basically the size of the economy in dollars. Real GDP does the same, but adjusts for inflation, showing whether the economy is truly growing rather than just getting more expensive.
Third Quarter Report
Canada’s economy staged a modest but meaningful comeback in the third quarter of 2025. Real GDP grew 0.6% from the previous quarter, reversing the 0.5% contraction in Q2. That works out to a 2.6% annualized growth rate, topping expectations and giving the economy a much-needed win.
The lift came from stronger trade and higher government spending. Imports dropped sharply, the biggest quarterly decline since 2022, while exports crept higher, boosted by a 6.7% surge in crude oil and bitumen shipments. Government capital spending rose 2.9%, with more money flowing into infrastructure and military projects. Together, these offset weakness elsewhere.
Still, the rebound wasn’t broad. Household spending slipped slightly, and business investment barely moved. Overall domestic demand, which combines consumption and investment, was essentially flat. In other words, most growth came from net exports and government projects rather than a widespread upswing across the economy.
The third quarter delivered a patchwork recovery – enough to avoid a technical recession, which occurs when the economy shrinks for two quarters in a row. Stronger energy exports and higher government outlays provided stability, but underlying momentum remains fragile. Early signs point to a possible GDP pullback in October, so the gains may need more support to turn into a lasting trend.
Combined with September’s rebound, the third quarter growth gives the economy a bit more breathing room. It suggests Canada may be more resilient than feared after the trade-driven slump earlier this year. Still, the uneven nature of the rebound highlights ongoing risks: consumer and business demand remain soft, and much depends on commodity prices and global trade developments.
Canadian Market Volatility
Canada’s volatility gauge – the S&P/TSX 60 Volatility Index (VIXC) – spent the early part of the week hovering around 17.65 before sliding under 15 mid-week and closing at 14.13. If you’re not familiar with the VIXC, it is basically Canada’s market mood meter. Readings in the low teens usually mean the Canadian market feels steady, while higher readings point to investors getting a bit jittery. Finishing the week just shy of 14 suggests a market that’s relaxed but still keeping an eye on the road – not tense, just calmly alert.
US Economic news
This past week’s key data points that the Federal Reserve (Fed) considers when deciding whether to raise or lower the interest rate.
Personal Consumption Expenditures (PCE)
The Personal Consumption Expenditures (PCE) report was delayed due to the recent government shutdown. The September report is now scheduled for December 5, 2025, while the releases for October and November have not yet been set.
PCE is the inflation gauge most closely watched by the Fed and often guides interest rate decisions. With this key measure missing as the Fed heads into its year-end meeting, Fed officials and investors face an added layer of uncertainty about the current inflation picture.
Gross Domestic Product (GDP)
Normally, the Bureau of Economic Analysis (BEA) publishes three estimates per quarter – advance, second, and third – gradually refining the picture of economic growth. Due to the recently ended government shutdown, the BEA has delayed the release of third-quarter GDP data. The advance estimate, originally scheduled for October 30, was canceled, and the second estimate, due November 26, has also been pushed back. These delays leave a temporary gap in the data, so we won’t have a clear view of third-quarter GDP until the estimates are released.
Retail Sales
According to the latest (and long-delayed) release from the US Census Bureau, retail and food services sales rose 0.2% in September, below the expected 0.4% gain. Growth is still happening, but the slowdown from August’s 0.6% increase suggests late-summer momentum is fading. On a year-over-year basis, sales were up 4.3%, indicating consumers haven’t fully pulled back yet.
The details reveal where Americans are focusing their spending. Miscellaneous retailers posted the biggest monthly gain at 2.9%, and year-to-date they’re up 8.2%, reflecting continued purchases of smaller, everyday items and services. By contrast, sporting goods, hobby, musical instruments, and bookstores fell 2.5% in September, while building materials and garden supplies are down 2.4% year-to-date, highlighting a pullback in bigger-ticket and discretionary purchases. Together, these trends suggest consumers haven’t closed their wallets but are choosing carefully, prioritizing practical purchases over larger, less essential items.
Core retail sales, which exclude autos, parts, and gasoline, rose just 0.1%, down from August’s 0.7% and below the expected 0.3%. Year-over-year, core sales were up 4.2%. The modest increase reflects the same pattern: spending continues, but enthusiasm is waning. The softer core reading aligns with the recent drop in consumer confidence, reinforcing that US consumers, while still active, are growing more cautious.
Month to month, the trend is clearly softening. It’s not a dramatic pullback, but it’s enough to matter. For companies heavily tied to consumer demand, slower sales growth can translate into tighter margins and choppier earnings.
Consumer Confidence Index (CCI)
The Conference Board’s CCI took a noticeable hit in November, dropping to 88.7. That is not only below expectations of 93.4 but also well under October’s 94.6 and far off the 111.7 logged last November. It’s a clear sign that consumers are feeling the strain from persistent inflation, a softening labour market, and growing economic uncertainty.
The “Present Situation” sub-index, which tracks how people feel about business conditions and the job market right now, slipped to 126.9 from 129.3. But the bigger story is what’s happening in expectations. The “Expectations” sub-index, which measures the outlook for the next six months, tumbled to 63.2, down from roughly 71.5 in October. This marks ten straight months below the critical 80 mark, a level that has historically flashed early recession signals. In short, people aren’t confident about where things are heading.
The report also shows rising concern across the board: jobs, income, the economy, inflation, and sticky prices. Uncertainty around trade, tariffs, and policy continues to weigh on confidence, and the recent federal government shutdown only piled on. These themes showed up repeatedly in the survey’s write-in comments.
So, what does the headline number of 88.7 really tell us? Consumers are still spending, but they’re becoming more cautious. The shift may be subtle, but it matters. When the confidence cushion thins out, the odds of a sharper slowdown start to climb. Compared with the same time last year, this drop in confidence stands out as one of the more noticeable changes in the economic landscape.
The economy isn’t falling apart, but the mood is clearly softening. Confidence plays a big role in how much people are willing to spend, which in turn affects corporate earnings and markets. The sharp dive in expectations is the key early-warning indicator here – if people doubt things will improve, slower growth often follows, as is starting to show up in retail sales.
American Market Volatility
The CBOE Volatility Index (VIX), often called the market’s “fear gauge,” had a noticeably calmer week compared to the last. It opened around 22.69 and drifted lower throughout the week, closing at 16.35. The pullback likely reflects growing confidence that the Fed is preparing for another 0.25% rate cut, along with a lighter, holiday-tinged mood around Thanksgiving. Think of the VIX as the market’s mood ring: even with the drop, readings above 25 still indicate unease. It’s not full-on panic, but a “seatbelt fastened” kind of vibe as investors wait for clearer signals from the Fed.
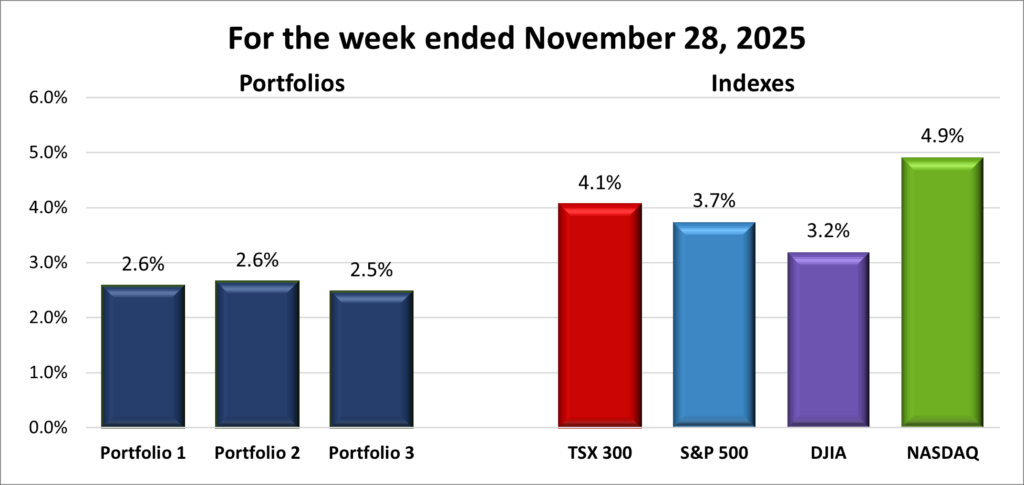
Weekly Market and Portfolio Review
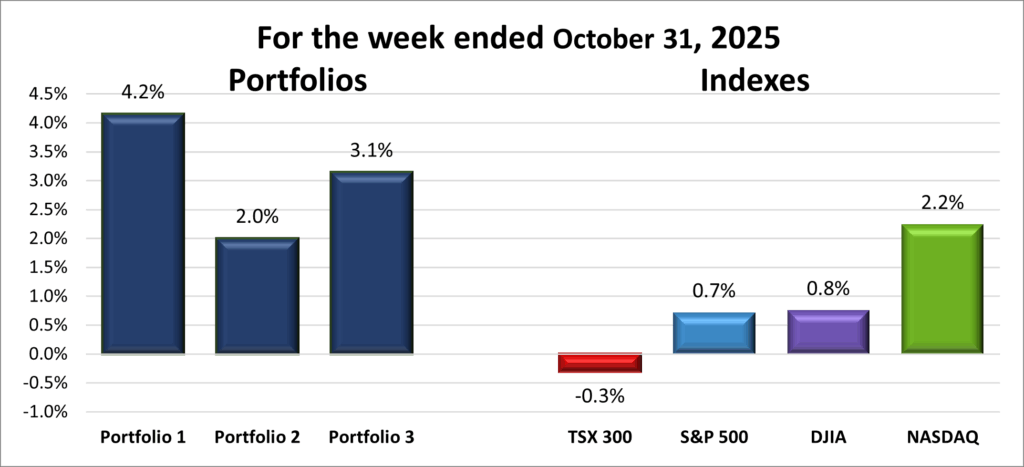
For the week, the TSX (SPTSX) jumped 4.1%, the S&P 500 (SPX) gained 3.7%, the DJIA (INDU) advanced 3.2% and the Nasdaq (CCMP) surged 4.9%.
| Index | Weekly Streak |
| TSX: | 1 – week winning streak |
| S&P: | 1 – week winning streak |
| DJIA: | 1 – week winning streak |
| Nasdaq: | 1 – week winning streak |
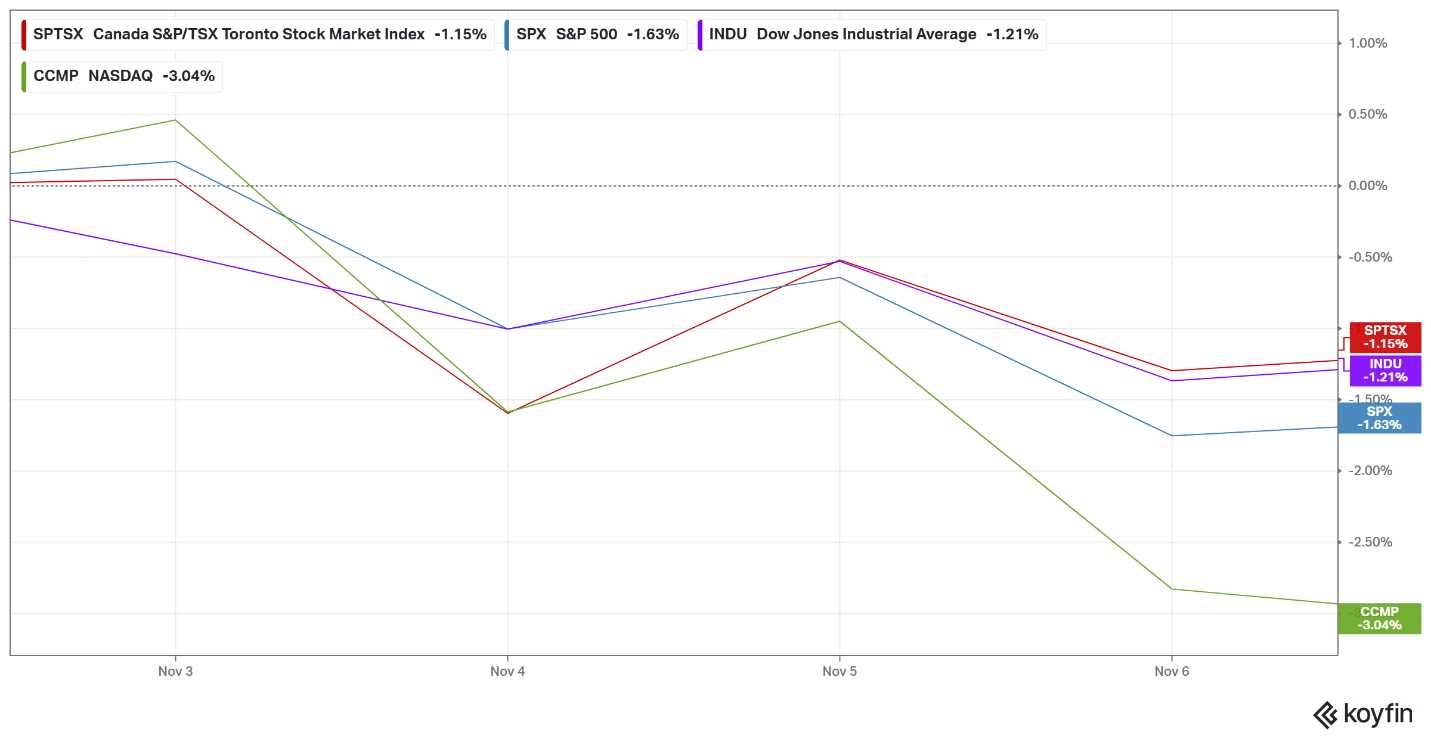
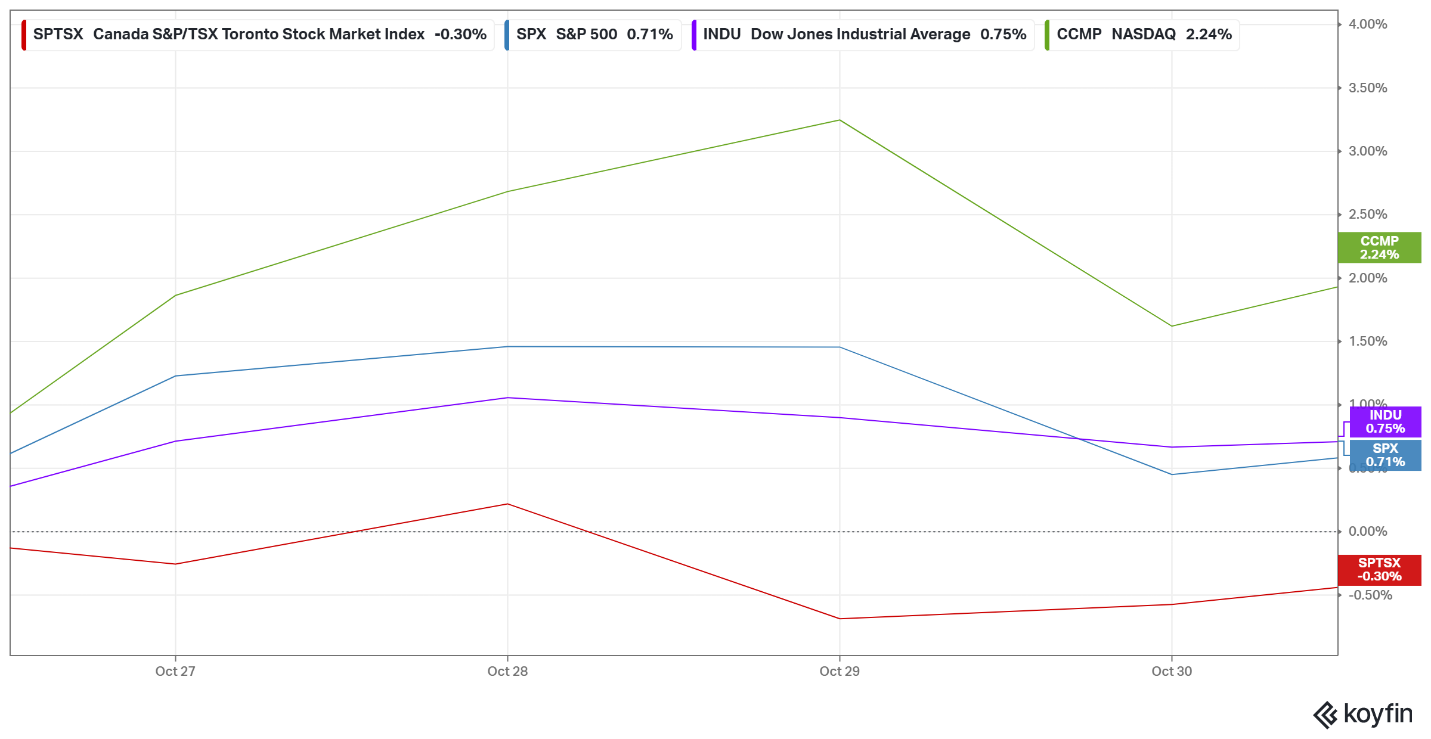
![]() After a few grinding, directionless weeks, the markets finally found something to cheer about. Investors came into Monday carrying the momentum from the previous Friday, and it didn’t take long for that optimism to pick up steam. All four major indexes – the Toronto Stock Exchange Composite Index (TSX), S&P 500 (S&P), Dow Jones Industrial Average (DJIA), and the Nasdaq Composite (Nasdaq) – jumped strongly out of the gate, with the Nasdaq posting its biggest single-day move since May 2025. That early spark set the tone for what became an unexpectedly upbeat stretch.
After a few grinding, directionless weeks, the markets finally found something to cheer about. Investors came into Monday carrying the momentum from the previous Friday, and it didn’t take long for that optimism to pick up steam. All four major indexes – the Toronto Stock Exchange Composite Index (TSX), S&P 500 (S&P), Dow Jones Industrial Average (DJIA), and the Nasdaq Composite (Nasdaq) – jumped strongly out of the gate, with the Nasdaq posting its biggest single-day move since May 2025. That early spark set the tone for what became an unexpectedly upbeat stretch.
The American markets might have had a holiday-shortened week, but nothing about the performance felt slow. All three major US indexes pushed their winning streaks to five sessions. The S&P logged its strongest Thanksgiving week since 2012, climbing 4.1%, while the Nasdaq – helped by a resurgence in artificial intelligence (AI) related names – booked its best holiday week since 2008 with a gain of more than 4%.
The real catalyst was a sudden burst of optimism around a possible Fed rate cut. Just a week earlier, most analysts had written off the chances of a final 2025 cut, thanks to the lack of fresh US economic data caused by the government shutdown. The data that finally arrived was mostly stale September information, although it did show weaker-than-expected retail sales. Consumer confidence also slipped to its lowest level since April, highlighting how much trade uncertainty has been weighing on households.
Then came the spark that flipped the script: a fourth Fed official suggested the central bank could cut rates without derailing progress on inflation. That comment instantly reshaped expectations. Investors shifted from bracing for rates to stay locked at 4% to expecting a December cut, and the odds of a 0.25% rate cut climbed toward 80%. Softer inflation signs, shaky confidence, and cooling consumer spending only reinforced that view.
With rate-cut hopes back in the spotlight, major technology stocks surged. The rally started in AI names and quickly spread across the sector, as if the technology sector was trying to make up for an entire choppy month in just a few sessions. That breakout helped pull the S&P and DJIA into positive territory for November and minimized some of the Nasdaq’s losses. Once upward momentum kicked in, it broadened across the market and gave the week a far more upbeat finish than anyone expected days earlier.
North of the border, Canadian markets quietly matched the positive vibe. The TSX extended its winning streak to six straight sessions and set a new record high each day this week. The week opened strong on the same wave of confidence that the Fed might move ahead with a December rate cut. Since Canadian markets often move in step with US rate expectations, that shift gave the TSX an immediate lift. Commodities also helped, with gold, silver, and other resource stocks catching steady buying after a volatile stretch. To top it off, Ottawa and Alberta signed a Memorandum of Understanding late in the week that could pave the way for a new pipeline from Alberta to Canada’s west coast, giving the energy-heavy index another dose of good news.
By the time the week wrapped up, all four major indexes were riding the renewed optimism around lower rates and had pushed the anxiety over stretched AI valuations into the background. Black Friday kicked off the holiday shopping season, adding another boost of confidence — the kind of spark that hopefully marks the start of a true Santa Claus rally. 😊
| Portfolio | Weekly Streak |
| Portfolio 1: | 1 – week winning streak |
| Portfolio 2: | 1 – week winning streak |
| Portfolio 3: | 1 – week winning streak |
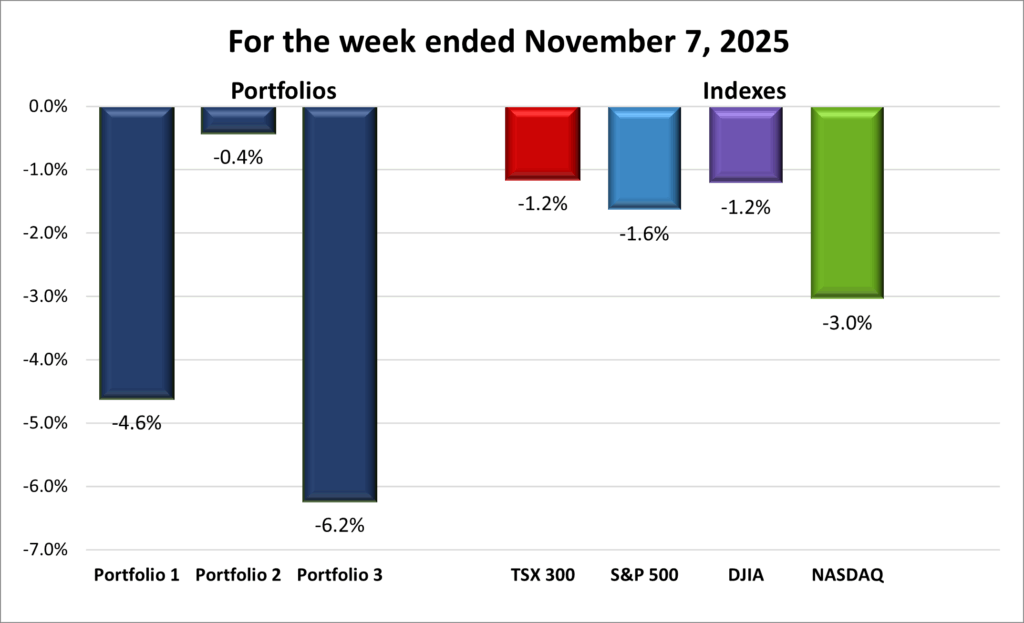
![]() After a few lacklustre weeks, it was great to see all three portfolios ride the rising tide of the markets to snap their losing streaks and get back in the win column. The resurgence in technology stocks provided the biggest lift, but the broad-based rally ensured that all three ended solidly in the green for the week.
After a few lacklustre weeks, it was great to see all three portfolios ride the rising tide of the markets to snap their losing streaks and get back in the win column. The resurgence in technology stocks provided the biggest lift, but the broad-based rally ensured that all three ended solidly in the green for the week.
Portfolio 1 posted an impressive 2.6% weekly gain, with 84% of its companies finishing higher. The big news was a deal between Alphabet (NASD: GOOGL) (Google) and Meta Platforms (NASD: META), more commonly known as Facebook, where Google will supply Facebook with billions of dollars’ worth of its custom-built AI chips, known as tensor processing units (TPUs), for use in Meta’s data centres. The news helped push Alphabet above US$300 for the first time as it set a new high. There was more good news with Celestica surging 19%, Navitas Semiconductor (NASD: NVTS) up 17%, Hammond Power Solutions (TSE: HPS.A) gaining 11%, and Cameco (TSE: CCO) adding 10%. Apple (NASD: AAPL), the Bank of Nova Scotia (TSE: BNS), and Walmart (NYSE: WMT) also set fresh record highs.
Portfolio 2 ended up being the week’s top performer (once you go out to two decimal places), climbing 2.6% with 78% of its holdings finishing in the green. Hammond Power Solutions jumped 11%, Zoetis (NYSE: ZTS) gained 10%, and Aritzia (TSE: ATZ) set yet another record high. It feels like ever since I became an owner, it’s been hitting a new high every week. That’s the kind of company I like. 😊
Portfolio 3 wasn’t far behind, putting up a solid 2.5% gain – the kind of week that would usually take first place, just not this time. About 75% of the portfolio moved higher, helped along by an 18% surge in Lithium Americas (TSE: LAC) and another strong performance from Vertiv Holdings (NYSE: VRT), which climbed 13%. Now, if only one of my top two holdings, Nvidia (NASD: NVDA) or Shopify could have a week like that. 😊
Not bad. Not bad at all! If the rest of November had looked like this, I’d have been smiling a whole lot more. 😊
Companies on the Radar
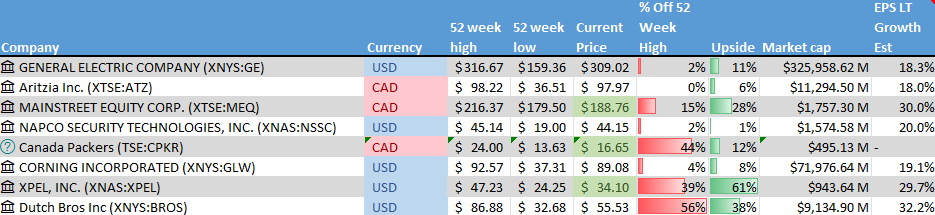
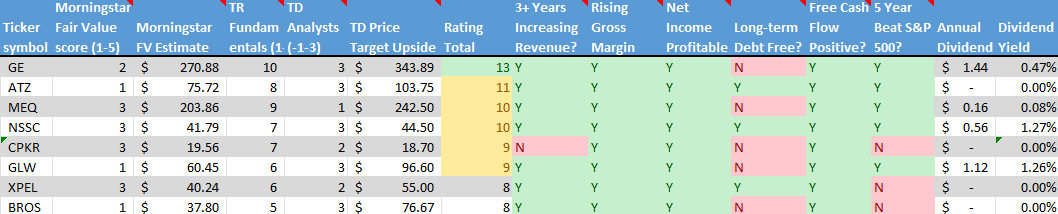
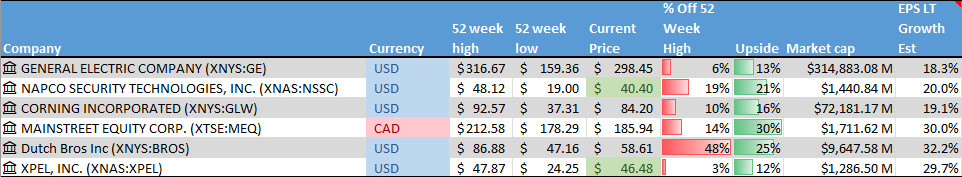
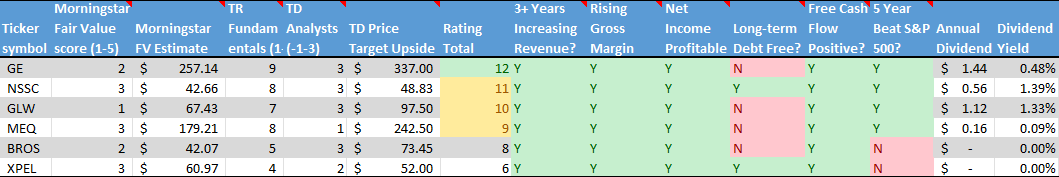
 It was another quiet week on my radar, with nothing new jumping out or grabbing my interest, a welcome change of pace after how companies were coming and going at the start of November. The six companies below are still the front-runners if I end up adding a new name to any of the portfolios.
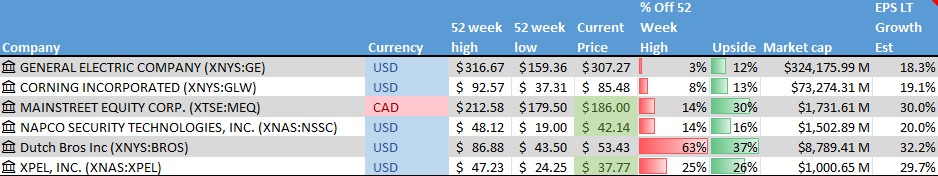
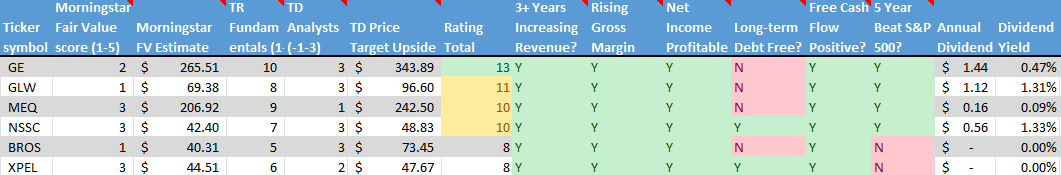
- GE Aerospace (NYSE: GE): This is the large American aviation and defence business that remained after General Electric split into three separate companies in 2024. It has been on a strong run thanks to high demand for commercial jet engines as global air travel continues to recover. The company focuses on aircraft propulsion systems and services for both commercial and military customers, and it’s also moving into drones. As a global leader in jet engines and aircraft systems, GE Aerospace offers exposure to long-term trends in travel, defence spending, and emerging aviation technology.
- Napco Security Technologies, Inc. (NASD: NSSC): A small US company that provides security hardware and systems like smart locks, intrusion alarms, fire alarms, and access control solutions. It sells through a network of distributors and installers, and has been increasing its recurring service revenue – something investors usually like to see. As demand for security and smart home products grows, Napco has multiple avenues for expansion.
- Corning Incorporated (NYSE: GLW): A large US company known for specialty glass and optical technologies. Corning is the longstanding supplier of the glass used in iPhones and is also benefiting from the surge in demand for high quality fiber optics as datacentres expand to support AI and cloud computing. The company is riding several tailwinds with long-term growth potential.
- Mainstreet Equity Corp. (TSE: MEQ): A Calgary-based real estate company focused on mid-market apartment buildings across Western Canada. Their business model is straightforward: buy underperforming buildings, renovate them, improve operations, and increase rental income. With strong demand for rentals, a disciplined approach, and shares that trade below the estimated value of the properties, Mainstreet offers a combination of income, stability, and long-term upside.
- Dutch Bros Inc. (NYSE: BROS): A rapidly expanding drive-thru coffee chain in the US, known for its energetic customer service and customizable drinks. The company is aiming to open at least 160 new locations by the end of 2025 and has long-term goals of surpassing 2,000 stores. Strong brand loyalty, especially in the Western US, makes this an interesting high-growth story – though still in an aggressive build-out phase.
- XPEL, Inc. (NASD: XPEL): A growing, founder-led maker of protective films, coatings, and related products – best known for automotive paint protection film. XPEL has been expanding into window films and architectural applications, and sells through multiple channels, giving it both reach and control. It’s a company with a focused niche and strong brand recognition in that niche.
As always, these are not buy recommendations. Make sure to do your own research and choose investments that fit your personal financial goals.
The Radar Check was last updated November 28, 2025.
That’s a wrap for this week, thanks for reading – may your portfolio stay green and your dividends steady. See you next time!