If the markets were Clubber Lang, their prediction for 2022 would have been “Pain!”.

And so far, pain it has been with the S&P 500 off to its worst start to a year since 1939. Over $10 trillion has been erased from American stocks alone. The Nasdaq Composite Index alone is down 25% in 2022 and well below the official -20% bear market threshold, the S&P 500 index is closing in on the bear market threshold (down 20% or more) and the Dow Jones Industrial Average and Toronto Stock Exchange are both in market corrections (down 10% – 20%). For those with a ten year or more time horizon, however, it is business as usual. Stick with your investment plan (you do have a plan, right?).
Rather than dwelling on the pain of 2022, I am going to talk about the conditions I look to avoid when selecting companies to own. Last week I talked about tailwinds that can accelerate the growth of companies when looking for investment opportunities. Headwinds are the opposite of tailwinds. They are unseen forces that drive down growth and earnings of companies. Obviously, you want to avoid companies with their own unique headwinds, but there are other headwinds you cannot avoid. These headwinds are the ones I am going to talk about today.
Headwinds
Unfortunately for us investors, in 2022 the markets in general have been facing the opposite of tailwinds – headwinds. There has been no shortage of headwinds facing the economy and the stock market for a while now. At the end of 2021, investors were concerned about how COVID-19 and its numerous variants would impact the economy. They were also worried about rising inflation and how it would inevitably lead to higher interest rate which would cut into revenues as companies are forced to pay more to service their debt. More money to pay down debt mean less money to grow the company and earnings. In 2022, another headwind was added to Covid – 19 and inflation concerns – the Russian invasion of Ukraine.
The Covid-19 pandemic continues to impact the global economy. In North America we are learning to live with it but in China many cities are under lockdown. Currently in China, people are forced to stay home, and factories sit idle, unable to produce many of the parts global industries rely on. This leads to ongoing supply chain issues, a phrase we have become all too familiar with over the last two years. In a nutshell, fewer workers lead to higher demand for workers, which leads to higher wages to attract workers. As well, fewer components mean more demand for those components and more demand leads to higher prices for those components. Higher wages and higher materials costs combine for higher prices for the finished products. Leading to inflation.
Both the Bank of Canada (BoC) and the US Federal Reserve (the Fed) aim for an Inflation rate of 2 – 3%. However, the inflation rate in Canada is above 6% and, in the US, its over 8%. In an effort to drive down inflation, the BoC and the Fed have both become aggressive in their respective fights to drive inflation back to the target rate. This leads to our next headwind – rising interest rates.
One of the tools the central banks (the BoC and the Fed) use to fight inflation is to raise interest rates. Already this year we have seen rate hikes of .25% and .5% in both countries, and both central banks have indicated they could keep hiking in .5% increments until interest rates reach 2%. The higher the interest rates, the more money is required to pay down debt and loans. If you have any form of debt, you should already be experiencing higher debt payments. This is the same for companies with high levels of debt. The additional cash to service their debt could have been used to grow the company. In the case of high growth companies like technology companies, this slows their growth. When high growth companies do not create high growth, their share price gets hammered, as we are seeing in 2022 (and as my Portfolios can attest).
If Covid-19, inflation, and higher interest rates are not enough, the Russian invasion of Ukraine further disrupted energy and food supplies, adding to inflationary and supply chain problems. Russia is the third largest producer of oil, second largest producer of natural gas, and third largest wheat producer. Ukraine is the seventh largest producer of wheat. With these two major suppliers removed from the supply system (Russia due to sanctions, Ukraine busy defending itself), we are already experiencing higher food and energy costs. Not only are we seeing higher prices at the gas pumps, but we are also seeing higher prices in almost everything we consume thanks to higher production costs and transportation costs to get those products to market. Higher energy costs and higher food costs only add to inflation.
Finally, a recent headwind we are now seeing is irrational investor psychology. With the markets in a downdraft since the start of 2022, investors are simply selling to get out. They are ignoring companies that are performing well and selling their shares simply because the market is declining. This is irrational. People cannot wait for Boxing Day sales or Black Friday sales, because prices are lower. However, when the stock markets decline, investors unload their shares even though they know that over time the market goes up. This is one of the few times where people do not want to buy when items go on sale.
So, there you have it, five headwinds currently battering the stock market. As with all market declines, these will pass, and the markets will resume their march higher. There is nothing we can do about it but ride out the storm.
For now, lets take a look back at the week that was….
Weekly Market Review
Monday: The week got off to a rocky start with all four major North American Indexes. In Canada, the resource heavy Toronto Stock Exchange Composite Index (TSX), ended at its lowest level since July 2020 as the Canadian Energy and Basic Materials (includes mining and fertilizer companies) sectors fell 7.1% and 5.6%, respectively.
In the US, the S&P 500 Index (S&P) fell 3.2%, the Dow Jones Industrial Average (DJIA) declined 2%, and the Nasdaq Composite Index (Nasdaq) tumbled down 4.3%. Fears of future interest rates caused investors to dump shares in technology companies. The technology heavy Nasdaq closed at its lowest price since November 2020. All the S&P sectors suffered losses today with Technology and Energy sectors leading the way down.
Tuesday: Quite the roller coaster ride for each of the Indexes today – up, down, up, down. In Canada, the TSX fell, ending the day at its lowest level since July 2021 and approaching a drop of 10% since its March all time high.
In the US, the DJIA stumbled while the S&P and the Nasdaq each inched into positive territory. The big technology companies recovered after Tuesday’s selloff, but investors are waiting for the US’s Consumer Price Index (CPI) report, due Wednesday, to see if inflation is slowing down.
Wednesday: The US CPI report indicated inflation growth slowed in April but will stick around for longer than anticipated. The CPI rose .3% in April, bringing the 12 months through April to 8.3%. As a result, the US Fed is likely to remain aggressive in its fight to get inflation under control (between 2 – 3% is the target, definitely not the current 8%). Since the Canadian and US economies are so tightly tied together, its highly likely that Canada will see a similar rise in inflation. As a result, the Bank of Canada (BoC) will continue to raise interest rates as it tries to reign in inflation in Canada.
Thanks to the higher CPI numbers, all four Indexes declined as investors anticipate higher interest rates. The TSX officially joined its American cousins in ‘correction’ territory (down more than 10% since its March 2022 high). The bright spot for the TSX was Energy climbed as the price of oil rose, but it was not wrought to offset the losses of the interest rate sensitive high growth companies.
In the US, the DJIA posted a fifth consecutive loss, the Nasdaq had another 3+% loss for the second time this week, and the S&P slowly moves towards a ‘bear’ market (down over 20 from recent high). As in Canada, the high growth sectors Consumer Discretionary and Technology fell the hardest while a surge in Energy and Basic Materials stocks limited the losses. Next up is the Producer Price Index (PPI).
Thursday: Another day, another ride on the market rollercoaster. The Nasdaq was the only Index to record a gain for the day but on the bright side, all four Indexes were moving higher when the trading day ended. The primary culprit was the Producers Price Index report indicating inflation has topped out but will hang around longer than anticipated. Investors are expecting additional .5% throughout 2022 by the US Fed and BoC.
The TSX notched its sixth consecutive loss and ended the day down 10.8% from its record high on March 29, putting the TSX in a ‘market correction’. Meanwhile, in the US, the S&P is staring down a bear market. In an interesting side note, the Canadian Technology sector gained ground and was best sector on the TSX and the S&P Technology sector declined and was one of the worst performing sectors. Odd, considering they usually move in the same direction.
Friday: The US’s federal Reserve chairman calmed the markets by indicating that bigger rate hikes were off the table for now, sparking a broad rally in beaten-down stocks. But even that was not enough to prevent the S&P and the Nasdaq from a sixth consecutive week of declines, and the TSX and DJIA registered their respective seventh straight losing week. For the S&P, which matched its longest losing streak since 2012, the Nasdaq matched its longest losing streak since 2011, and not to be out done, the DJIA matched its longest weekly losing streak since 2001.
All the Canadian sectors on the TSX, and all the S&P sectors in the US ended the day in the black, led by the Technology, Consumer Discretionary and Energy sector companies in both countries.
The question is, is this another false rally or have the markets bottomed. Only time will tell.
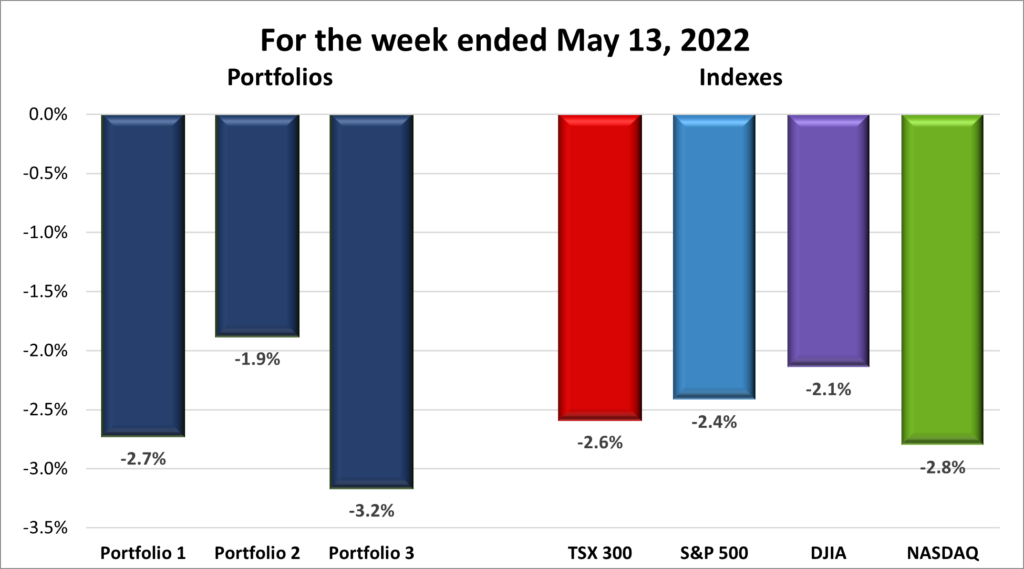
For the week, the TSX was down 2.6%, the S&P fell 2.4%, the DJIA declined 2.1% and the Nasdaq dropped 2.8%.
Weekly Portfolio Review
Another week of declines for all four Indexes but this time the week ended on a positive note with a broad-based rally, led by the Nasdaq’s 3.8% boost on Friday. I am not sure if this is a speed bump on the ongoing journey downward or if a bottom is nearby. Either way, I find myself more optimistic this week than past weeks where a cloud of doom seemed to hang over the marketplace.
As for the three Portfolios, another week another decline. The Portfolios have been falling for so long, it seems like forever, that I have lost track of the weekly declines. However, the strong surge on Friday pulled them back from losses of more than 6% each. Its funny how ‘only’ losing 2 – 3% is now considered a good week but when it good have been worse than 6% I will take the small victory when I can get it. 😊 Thanks to the Friday rally I feel like Ollie the Optimist and am hopeful next week will finally break the losing streak.
Companies on the Radar
I am currently tight on cash so I remain on the sidelines. If I did have cash, these are the higher growth companies I would be looking:
Or for less volatile companies with reasonable growth:
- Microsoft (NASD:MSFT)
- Apple (NASD:AAPL)
- Home Depot (NYSE:HD)
- American Tower (NYSE:AMT)
- Berkshire Hathaway (NYSE:BRK.B)
Portfolio Update
Portfolio 1
Portfolio 1 for the week ended May 13, 2022: DOWN ![]()
- Shaw Communications (TSX:SJR.B) planned merger with Rogers Communications (TSX:RCI.B) came to a grinding halt when Canada’s Competition Bureaus announced plans to block the merger. I am of mixed feelings about this. On one hand I agree that Rogers acquisition of Shaw will not help lower mobile charges as Rogers, Bell (TSX:BCE), and Telus (TSX:T) account for almost 90% of mobile phone revenues in Canada. Canada already has some of the highest smartphone bills in the world and the disappearance of a competitor (Shaw) will not help. On the other hand, the share price of Shaw (which is in Portfolio 1) jumped at the initial announcement being essentially flat for a few years. If the merger fails, the share price will likely fall to pre-merger levels, if not lower. So, on a personal level, the acquisition is a good thing, although I would lose the great dividend Shaw has been producing.
- Rivian (NASD:RIVN) took another hit as Ford (NYSE:F) announced they would be selling their shares in Rivian. Rivian is struggling with supply chain issues limiting their production capacity, which limits their sales, which drags on their ability to generate much needed revenue. However, in their earnings conference call they maintained their target of 25,000 electric pickups and SUVs.
- Tesla (NASD:TSLA) halted production at its Shanghai plant. It looks like the same supply chain issues which have plagued other vehicle manufacturers has finally caught up with Tesla.
Activity
No significant activity to report this week.
Dividends
Dividends Received this week for the following companies:
Companies followed by DRIP (Dividend Re-Investment Plan) indicate additional shares were purchased with the dividend. Any cash leftover was added to the cash balance.
Canadian $
Bank of Nova Scotia (TSX:BNS) DRIP
US $
Apple Inc. (NASD:AAPL)
Quarterly Reports
GDI Integrated Facility Services Inc.
All currency listed in CAD dollars
Selected highlights from their first quarter 2022 financial results on May 10, 2022
- Revenue for the first quarter of 2022 was $495 million, an increase of $111 million, or 29%, over the first quarter of 2021. Organic revenue growth was 4% and growth from acquisitions was 25%.
- Net income was $7 million or $0.30 per share compared to $13 million or $0.57 per share in Q1 2021. The decrease in net income is mainly attributable to Canada Emergency Wage Subsidy (CEWS) subsidies recorded in 2021.
- Board of Directors approved the purchase during the next 12 months up to 500,000 Subordinate Voting Shares, representing approximately 3.6% of the Company’s public float, for the purpose of cancellation.
Copperleaf Technologies Inc.
All currency listed in CAD dollars
Selected highlights from their first quarter 2022 financial results on May 10, 2022
- Revenue of $15.6 million, an increase of 11% over Q1 2021, driven by the increase in new clients and expansion of existing clients.
- Annual Recurring Revenue as of March 31, 2022, of $38.0 million, a 26% increase from $30.1 million as of March 31, 2021.
- Net loss of $10.9 million, or $0.16 per share, compared to a net loss of $1.8 million, or $0.11 per share, in Q1 2021.
- As of March 31, 2022, our Net Revenue Retention Rate was 108%.
Celsius Holdings, Inc.
All currency listed in US dollars
Selected highlights from their first quarter 2022 financial results on May 10, 2022
- Revenue of $133.4 million, up 167% from $50 million in the year ago quarter.
- Gross profit margins of 40.4% compared to 41.1% for the prior year quarter.
- Net income of $6.2 million compared to $0.392 million in the year ago quarter.
- Celsius sales growth outpacing the energy drinks category by twenty times.
Nuvei Corporation
All currency listed in US dollars
Selected highlights from their first quarter 2022 financial results on May 10, 2022
- Revenue increased 43% to $214.5 million from $150.5 million.
- Net income decreased by $23.3 million to $4.5 million compared to net income of $27.8 million, primarily due to a $33.1 million increase in share-based payments to employees who joined the Company as part of acquisitions completed in 2021 and other employee incentive grants.
- Cash flow from operating activities increased by 23% to $65.7 million from $53.4 million.
- Anticipating revenues of $217 – $223 million for the second quarter, and revenues of $940 – $980 million for fiscal 2022.
The Trade Desk, Inc.
All currency listed in US dollars
Selected highlights from their first quarter 2022 financial results on May 10, 2022
- Revenue of $315 million, up 43% versus the same period last year.
- Net loss of $15 million compared to a gain of $23 million in the same period last year.
- Customer retention remained over 95% during the first quarter, as it has for the past eight consecutive years.
- Anticipating revenues of at least $364 million for the second quarter.
Unity Software Inc.
All currency listed in US dollars
Selected highlights from their first quarter 2022 financial results on May 10, 2022
- Record quarter with $320 million in revenue during the first quarter of 2022, up 36% year-over-year.
- Loss from operations was $171.2 million, or 53% of revenue, compared to loss from operations of $110.9 million, or 47% of revenue, in the first quarter of 2021. These results were impacted by an increase in stock-based compensation expenses.
- Basic and diluted net loss per share was $0.60, compared to basic and diluted net loss per share of $0.39 in the first quarter of 2021.
- 1,083 customers each generated more than $100,000 of revenue in the trailing 12 months as of March 31, 2022, compared to 837 as of March 31, 2021.
- Dollar-based net expansion rate as of March 31, 2022, was 135% as compared to 140% as of March 31, 2021.
- Revenue outlook of $290 – $295 million for the second quarter; $1,350 – $1,425 million for fiscal 2022.
fuboTV Inc.
All currency listed in US dollars
Selected highlights from their first quarter 2022 financial results on May 11, 2022
- Record $236.7 million in total revenue in the first quarter, an increase of 98% year-over-year.
- Solid year-over-year growth in advertising revenue (up 81% to $22.8 million) and total paid subscribers (up 81% to 1,056,245).
- Net loss of $140.8 million, up 101% from the same period in 2021.
- Ended the quarter with over $456 million in cash.
- North American subscribers up 81% to 1,056 thousand; rest of the world subscribers up 102% to 305 thousand.
Yellow Pages Limited
All currency listed in thousands of CAD dollars
Selected highlights from their first quarter 2022 financial results on May 11, 2022
- Revenues of $67,789 compared to $73,514 in the same period of 2021.
- Net income of $14,630 compared to $12,135 in the same period of 2021.
- The company purchased 448,036 common shares for cash of $6.3 million in the first quarter
- Declared a dividend of $0.15 per common share, to be paid on June 15, 2022, to shareholders of record as of May 27, 2022.
Rivian Automotive Inc.
All currency listed in US dollars
Selected highlights from their first quarter 2022 financial results on May 11, 2022
- Total production for the first quarter 2022 was 2,553 vehicles. We delivered 1,227 vehicles in the first quarter generating $95 million in Revenue.
- Net loss for Q1 2022 was $(1,593) million as compared to $(414) million for the same period last year.
- Provide guidance for 25,000 total units of production, $(4,750) million in Adjusted EBITDA, and $2,600 million of Capital Expenditures.
Marqueta, Inc.
All currency listed in thousands of US dollars
Selected highlights from their first quarter 2022 financial results on May 11, 2022
- Revenue of $166 million in the first quarter of 2022, up 54 percent year-over-year.
- A 50% increase in gross profit.
- Net loss of $60,598, up 372% over the same period in 2021. The increase in gross profit was offset by an increase in compensation, benefits, and technology expenses as Marqueta continued its investment in their people and platform.
- 53% growth in first quarter total processing volume.
- Provide guidance for revenue growth of 46 – 48%, with a gross margin of 40 – 41%.
Kneat.com, Inc.
All currency listed in CAD dollars
Selected highlights from their first quarter 2022 financial results on May 11, 2022
- Revenues increase 121% year over year to $5.2 million.
- Annual recurring revenue (ARR) grows 134% to $13.4 million.
- Gross margin was up 201% to $3.3 million, compared to $1.1 million for the first quarter of 2021. Gross profit margin was 63%, compared to 46% for the first quarter of 2021.
- Net loss of $3,426,260 compared to a net loss of $4,071,862 for the first quarter of 2021, an improvement of 18%.
Docebo Inc.
All currency listed in US dollars
Selected highlights from their first quarter 2022 financial results on May 12, 2022
- Revenue of $32.1 million, an increase of 47% from the comparative period in the prior year.
- Net loss of $7.0 million, compared to net loss of $5.6 million for the comparative period in the prior year.
- Grew to 2,947 customers, an increase from 2,333 customers at the end of March 31, 2021.
- Strong growth in average contract value (“ACV”), increasing from $35,739 as of March 31, 2021, to $43,875 as of March 31, 2022.
AcuityAds Holdings Inc.
All currency listed in CAD dollars
Selected highlights from their first quarter 2022 financial results on May 12, 2022
- Total revenue for the three months ended March 31, 2022, was $23.8 million, a 13.4% decrease year over year. The year over year comparison was primarily affected by an unusually large client campaign in Q1 2021 that was not repeated in Q1 2022.
- Gross margin for the three months ended March 31, 2022, was 50.0%, compared to 52.3% for the same period in 2021. The decrease was due to mix as self-serve revenues increased as a percentage of overall revenue.
- Net loss for the three months ended March 31, 2022, was $4.5 million, compared to net income of $1.4 million for the three months ended March 31, 2021. The first quarter loss was mainly due to non-cash charges (depreciation and amortization, share-based compensation, and foreign exchange loss) Operating cash flow for the three months ended March 31, 2022, was $1.8 million, compared to $6.2 million for the same period in 2021.
- On March 31, 2022, the Company had cash and cash equivalents of $99.5 million, compared to $102.2 million as of December 31, 2021. Most of the decrease was related to foreign exchange movements in the quarter, which, after the quarter, has been reversed.
Algonquin Power & Utilities Corp.
All currency listed in US million dollars
Selected highlights from their first quarter 2022 financial results on May 12, 2022
- Revenue of $735.7, an increase of 16% compared to the first quarter of 2021.
- Net earnings attributable to shareholders of $91.0 an increase of 555% compared to the first quarter of 2021.
- Approved a 6% dividend increase from a total annualized dividend of $0.6824 per common share to a total annualized dividend of $0.7233 per common share.
WELL Health Technologies Corp.
All currency listed in thousands of CAD dollars
Selected highlights from their first quarter 2022 financial results on May 12, 2022
- Record quarterly revenues of $126.5 million in the first quarter representing a 395% year-over-year (YoY) increase compared to the first quarter in2021, catapulting the Company to over $500 million annualized revenue run-rate. Revenues reflected accelerating organic growth to 15% on a YoY basis.
- Reported a net loss of $2,310 in the first quarter, compared to a Net Loss) of $4,181 in the same period in 2021.
- Since March 31, 2022, purchased and subsequently cancelled 50,000 Shares, at an average price of $4.85 on the TSX.
- Increasing guidance for 2022 annual revenue to exceed $525 million, from the previous guidance of over $500 million in annual revenue.
Portfolio 2
Portfolio 2 for the week ended May 13, 2022: DOWN ![]()
Kneat.com (TSX:KSI) had a very good first quarter with increased revenues, increased annual recurring revenues, improved gross margin and managed to reduce their net loss by $600,000. They also had a number of wins on the business side in the first quarter, including selection by a European National Health Service to provide their laboratory equipment validation management solution; selected to provide enterprise platform to top ten biopharmaceutical company; signed a leading Canadian generics pharmaceutical manufacturer; and signed the U.S. subsidiary of one of the world’s top 15 consumer-packaged-goods companies.
Disney (NYSE:DIS) had a quietly good earnings report. All eyes were on Disney to see if their streaming service Disney+ would follow in Netflix’s footsteps and report declining subscribers. Not only did Disney report a stronger than expected subscriber count, up 7.9 million subscribers from the previous quarter to bring the total to 138 million subscribers, but they are also increased the average revenue per user. They reported they were on target for their goal of 230 – 260 million subscribers by 2024. However, away from the spotlight was news that Disney theme parks generated more money than pre pandemic levels with fewer guests. After 2 years of shutdowns, people are eager to travel and are opening up their wallets when they visit the House of Mouse. As Covid-19 restrictions are lifted in other parts of the world, expect to see more visitors at Disney’s Hong Kong and Shanghai parks to add to the revenue generated at their North American parks. Overall, I see this as a good earnings report with a lot of promise for the future.
Activity
No significant activity to report this week.
Dividends
Dividends Received this week for the following companies:
Companies followed by DRIP (Dividend Re-Investment Plan) indicate additional shares were purchased with the dividend. Any cash leftover was added to the cash balance.
Canadian $
Bank of Nova Scotia (TSX:BNS) DRIP
Summit Industrial Income REIT (TSX:SMU.UN)
US $
No US$ dividends this past week.
Quarterly Reports
Brookfield Renewable Partners LP
All currency listed in US dollars
Selected highlights from their first quarter 2022 financial results on May 6, 2022
- Revenues of $1,136 million compared to $1,020 million in the same period in 2021.
- Funds from operations (FFO) of $243 million or $0.38 per unit, an 18% increase on a normalized basis over the same period in 2021.
- $4 billion of total available liquidity providing significant flexibility to fund growth.
- View inflation as a tailwind because approximately 70% of their contracts are indexed to inflation and have a largely fixed cost structure with relatively limited exposure to rising labour costs or increasing maintenance capital expenditures.
Zynga Inc.
All currency listed in US dollars
Selected highlights from their third quarter 2022 financial results on May 9, 2022
- Revenue of $691 million, up 2% year-over-year.
- Net loss was $25 million, compared to a net loss of $23 million in the year-ago quarter.
- Online gaming revenue was down 3%, year over year. Advertising revenue was up 24%, year over year.
- Plans to be acquired by Take Two Interactive (NASD:TTWO) remains on track.
Walt Disney Company
All currency listed millions in US dollars
Selected highlights from their second quarter 2022 financial results on May 11, 2022
- Revenues for the quarter, $19,249, and six months, 41,068, grew 23% and 29%.
- Net income for the quarter, $597, and six months, $1,797, down 87% and up 55%, respectively.
- 7.9 million Disney+ subscribers added in the quarter.
Kneat.com, Inc.
All currency listed in CAD dollars
Selected highlights from their first quarter 2022 financial results on May 11, 2022
- Revenues increase 121% year over year to $5.2 million.
- Annual recurring revenue (ARR) grows 134% to $13.4 million.
- Gross margin was up 201% to $3.3 million, compared to $1.1 million for the first quarter of 2021. Gross profit margin was 63%, compared to 46% for the first quarter of 2021.
- Net loss of $3,426,260 compared to a net loss of $4,071,862 for the first quarter of 2021, an improvement of 18%.
iA Financial Corporation Inc.
All currency listed in CAD dollars
Selected highlights from their first quarter 2022 financial results on May 12, 2022
- Premiums and deposits amounted to $4.4 billion during the quarter, similar to the record achieved for the same period in 2021.
- Assets under management and administration ended the quarter at $213.9 billion, a year-over-year increase of 6%.
- Net income attributed to common shareholders of $151 million.
- Reported diluted earnings per common share of $1.40 compared to $1.61 for the same quarter of 2021.
- Redeemed and cancelled 108,200 outstanding common shares.
Portfolio 3
Portfolio 3 for the week ended May 13, 2022: DOWN ![]()
Shopify (TSX:SHOP) went on its own rollercoaster this past week. Continuing its downward journey before reversing course and rebounding 20+% in the last two days. The downward trend of Shopify’s share price continued when Shopify released their first quarter earnings showing a revenue growth rate of 22%, a significant decline from 2021’s stellar first quarter. Shopify announced the purchase of Deliverr, an e-commerce fulfillment company. They also indicated they were prepared to spend up to USD $1 billion over the next three years to build out their fulfillment network.
As for the rest of the companies in Portfolio 3, the week was saved by an end of the week rally from what was shaping up to be one of the worst weeks for Portfolio 3 since I started this blog.
Activity
No significant activity to report this week.
Dividends
Dividends Received this week for the following companies:
No dividends this past week.
Quarterly Reports
Brookfield Renewable Partners LP
All currency listed in US dollars
Selected highlights from their first quarter 2022 financial results on May 6, 2022
- Revenues of $1,136 million compared to $1,020 million in the same period in 2021.
- Funds from operations (FFO) of $243 million or $0.38 per unit, an 18% increase on a normalized basis over the same period in 2021.
- $4 billion of total available liquidity providing significant flexibility to fund growth.
- View inflation as a tailwind because approximately 70% of our contracts are indexed to inflation and have a largely fixed cost structure with relatively limited exposure to rising labour costs or increasing maintenance capital expenditures.
GDI Integrated Facility Services Inc.
All currency listed in CAD dollars
Selected highlights from their first quarter 2022 financial results on May 10, 2022
- Revenue for the first quarter of 2022 was $495 million, an increase of $111 million, or 29%, over the first quarter of 2021. Organic revenue growth was 4% and growth from acquisitions was 25%.
- Net income was $7 million or $0.30 per share compared to $13 million or $0.57 per share in Q1 2021. The decrease in net income is mainly attributable to Canada Emergency Wage Subsidy (CEWS) subsidies recorded in 2021.
- Board of Directors approved the purchase during the next 12 months up to 500,000 Subordinate Voting Shares, representing approximately 3.6% of the Company’s public float, for the purpose of cancellation.
Unity Software Inc.
All currency listed in US dollars
Selected highlights from their first quarter 2022 financial results on May 10, 2022
- Record quarter with $320 million in revenue during the first quarter of 2022, up 36% year-over-year.
- Loss from operations was $171.2 million, or 53% of revenue, compared to loss from operations of $110.9 million, or 47% of revenue, in the first quarter of 2021. These results were impacted by an increase in stock-based compensation expenses.
- Basic and diluted net loss per share was $0.60, compared to basic and diluted net loss per share of $0.39 in the first quarter of 2021.
- 1,083 customers each generated more than $100,000 of revenue in the trailing 12 months as of March 31, 2022, compared to 837 as of March 31, 2021.
- Dollar-based net expansion rate as of March 31, 2022, was 135% as compared to 140% as of March 31, 2021.
- Revenue outlook of $290 – $295 million for the second quarter; $1,350 – $1,425 million for fiscal 2022.
goeasy Ltd.
All currency listed in CAD dollars
Selected highlights from their first quarter 2022 financial results on May 11, 2022
- Revenue of $195 million, up 46%.
- Net income in the first quarter was $26.1 million, compared to $112 million in the same period of 2021. In the first quarter of the prior year, the Company recorded an after-tax unrealized gain on investments of $75.8 million, while in the current period the Company recorded an after-tax unrealized loss on investments of $15.2 million.
- After adjusting for these non-recurring and unusual items on an after-tax basis, including $2.4 million in amortization of acquired intangible assets, adjusted net income was $45.8 million, up 25% from $36.7 million in 2021.
- Return on equity during the quarter was 13.5%, compared to 90.1% in the first quarter of 2021. After adjusting for non-recurring and unusual items, adjusted return on equity was 23.8% in the quarter, compared to 29.5% in the same period of 2021.
- Total assets were $2.69 billion as of March 31, 2022, an increase of 67% from $1.61 billion as of March 31, 2021.
- Approved a quarterly dividend of $0.91 per share payable on July 8, 2022, to the holders of common shares of record as at the close of business on June 24, 2022
- Net customer growth during the quarter of 7,120.
Fortuna Silver Mines Inc.
All currency listed in US dollars
Selected highlights from their first quarter 2022 financial results on May 11, 2022
- Sales of $182.3 million, an increase of 55% from the $117.8 million reported in the same period in 2021.
- Net income of $27.0 million, compared to $26.4 million reported in the first quarter 2021.
- Gold and silver production of 66,800 ounces and 1,670,128 ounces, respectively. An increase of 93% and a decrease of 13% respectively compared to the first quarter of 2021.
Kneat.com, Inc.
All currency listed in CAD dollars
Selected highlights from their first quarter 2022 financial results on May 11, 2022
- Revenues increase 121% year over year to $5.2 million.
- Annual recurring revenue (ARR) grows 134% to $13.4 million.
- Gross margin was up 201% to $3.3 million, compared to $1.1 million for the first quarter of 2021. Gross profit margin was 63%, compared to 46% for the first quarter of 2021.
- Net loss of $3,426,260 compared to a net loss of $4,071,862 for the first quarter of 2021, an improvement of 18%.
AcuityAds Holdings Inc.
All currency listed in CAD dollars
Selected highlights from their first quarter 2022 financial results on May 12, 2022
- Total revenue for the three months ended March 31, 2022, was $23.8 million, a 13.4% decrease year over year. The year over year comparison was primarily affected by an unusually large client campaign in Q1 2021 that was not repeated in Q1 2022.
- Gross margin for the three months ended March 31, 2022, was 50.0%, compared to 52.3% for the same period in 2021. The decrease was due to mix as self-serve revenues increased as a percentage of overall revenue.
- Net loss for the three months ended March 31, 2022, was $4.5 million, compared to net income of $1.4 million for the three months ended March 31, 2021. The first quarter loss was mainly due to non-cash charges (depreciation and amortization, share-based compensation, and foreign exchange loss) Operating cash flow for the three months ended March 31, 2022, was $1.8 million, compared to $6.2 million for the same period in 2021.
- On March 31, 2022, the Company had cash and cash equivalents of $99.5 million, compared to $102.2 million as of December 31, 2021. Most of the decrease was related to foreign exchange movements in the quarter, which, subsequent to the quarter has been reversed.