
With tariffs dominating the news the last few weeks, I thought it’d be a good time to talk about how they impact us as consumers and investors.
What Are Tariffs?
Tariffs are essentially taxes on imported goods, meant to regulate trade and protect domestic industries. In this case, President Trump is using them as a bargaining chip in trade negotiations. By making foreign products more expensive, tariffs can push consumers toward locally made goods, but they often come with unintended consequences.
Recent Developments
The trade relationship between the US and Canada is one of the largest and most interconnected in the world, but it hasn’t been without its disputes. In this latest one, on February 1, President Trump imposed 25% tariffs on a wide range of Canadian goods, including steel and aluminum, citing the need to curb illegal drug flows – particularly fentanyl – and illegal immigration. To justify these tariffs, he declared a national economic emergency.
This move comes despite the USMCA trade deal negotiated during his first administration. In response, Canada hit back with 25% tariffs on $155 billion worth of US goods, targeting alcohol, furniture, and natural resources. Prime Minister Trudeau defended the decision as necessary to protect Canadian businesses and workers. Fortunately, President Trump agreed to a 30-day suspension of tariffs on Canada. This decision came after both countries committed to enhancing border security measures to address concerns about drug trafficking and illegal immigration.
Both sides are seeking a resolution, but consumers on both sides of the border will pay the price if the tariffs are reintroduced. The Wall Street Journal has even called it the “Dumbest Trade War Ever.”
Impact on Consumers
Tariffs might sound like an issue for big businesses, but they directly affect consumers and investors:
- Higher Prices 🛒 – Businesses pass tariff costs onto consumers, meaning you could be paying more for everyday goods.
- Supply Chain Issues 🚛 – Many companies rely on cross-border materials. When those costs rise, it disrupts supply chains and slows production.
- Stock Market Volatility 📉📈 – Trade uncertainty can increase market volatility, impacting stocks – including those in your portfolio.
Impact on the Canadian Economy and Consumers
For Canada, US-imposed tariffs are a major headache, especially for export-heavy industries. Higher costs make Canadian goods less competitive, leading to potential job losses and slower economic growth. Consumers also feel the squeeze – whether through higher prices or fewer product choices. Economic uncertainty may also cause businesses to delay investments, further dampening growth.
Impact on the American Economy and Consumers
On the US side, tariffs drive up costs for manufacturers relying on Canadian raw materials, making production more expensive and reducing competitiveness. Farmers are also hit hard when retaliatory tariffs shrink their export markets. And just like in Canada, US consumers face higher prices on affected goods, which can lead to lower spending – ultimately slowing economic momentum.
Is There a Winner in a Trade War?
Not really. While tariffs might temporarily shield certain industries from foreign competition, they also create uncertainty and hurt key sectors like manufacturing and agriculture. Over time, they tend to slow economic growth and cost jobs rather than protect them.
Broader Economic Implications
- Trade Wars 🔥 – Tit-for-tat tariffs can escalate into full-blown trade wars, straining international relations.
- Market Volatility 📉 – Uncertainty over tariffs often leads to unpredictable stock market swings, affecting investments and retirement funds.
- Damaged Trade Relationships 🌎 – Long trade battles can damage partnerships, making future deals tougher.
While tariffs may help certain domestic industries in the short term (by reducing foreign competition), they disrupt trade, increase costs, and reduce overall economic efficiency. If these US-Canada tariffs remain in place or escalate, both economies could face slower growth, weaker job creation, and reduced consumer confidence – a situation neither country wants.
A Simple Analogy: The Locked Garden Gate
Imagine Canada and the US as two neighbours who’ve always shared a garden. Over the years, they’ve traded tools, seeds, and harvests, benefiting from each other’s strengths. Then, one day, the US puts up barriers on its side. In response, Canada does the same. Now, both have less variety, increased costs, and the garden isn’t thriving like before. In the end, both sides lose.
Final Thoughts
While tariffs may protect certain industries in the short term, they often lead to higher prices for consumers. For us investors, they create market uncertainty, resulting in stock market volatility and slowing long-term growth. As US-Canada trade tensions continue, the effects will ripple through both economies, driving up prices, and ultimately, there will be no winner.
With trade tensions adding another layer of uncertainty and volatility, investors are watching for signs of progress – or further escalation. But tariffs weren’t the only market-moving factor this past week. Labour data from both countries and earnings reports also played a role. Let’s look at how the markets reacted and what it meant for the three portfolios.
Items that may only interest or educate me ….
Canadian Economic news, US Economic news,
Canadian Economic news
This past week’s key economic data that the Bank of Canada (BoC) considers when deciding whether to raise or lower the interest rate.
Labour Force Survey (LFS)
According to Statistics Canada, the Canadian job market kicked off the year on solid footing, adding 76,000 jobs in January. While that’s down from December’s 91,000, it’s still far better than the 25,000 jobs analysts had expected. Meanwhile, the unemployment rate edged down to 6.6%, marking its second consecutive monthly decline after peaking at 6.9% in November. That’s a positive short-term trend, though unemployment remains higher than the 5.7% recorded a year ago.
Wage growth continued to cool, coming in at a rate of 3.5% compared to 3.8% in December. That’s a noticeable slowdown from the 5% wage growth we saw through most of 2023 and 2024. While slower wage growth might not sound great, it does help ease inflation concerns.
Overall, this report shows a job market that’s still expanding, even if momentum is slowing. For the BoC, strong employment numbers suggest there’s no rush to cut interest rates, keeping the focus on maintaining economic stability and controlling inflation. For us small-time investors, a resilient job market and rising wages typically lead to more consumer spending, which can drive company profits – and potentially lift stock prices. 😊
Canadian market volatility
Canada’s Volatility Index (VIXC) had a wild ride this past week, with sharp jumps and drops. It started at 19.99 as US tariffs took effect, only to plunge below 16 that same day when the tariffs were suspended for a month. The VIXC spent the rest of the week bouncing between 14.0 and 20.38, closing at 14.49 as concerns over tariffs faded into the background – at least for now.
For those new to the VIXC (traded as VIXI on the TSX), think of it as the market’s fear gauge. Readings below 10 signal smooth sailing, while 10 to 20 reflect normal market fluctuations. Once it pushes past 20, uncertainty starts creeping in, and things can get choppy. 😊
US Economic news
This past week, several key job market reports gave investors and the US Federal Reserve (Fed) more insight into the state of the economy and what it could mean for interest rates going forward.
Labour data
Labor Department’s Job Openings and Labor Turnover Survey (JOLTS)
The December JOLTS report showed job openings falling to 7.6 million – below the expected 8.0 million and a sharp drop from November’s 8.2 million. This marks the lowest level since September 2024 and the steepest month-over-month decline since October 2023. A key measure of labour market tightness – the number of job openings per unemployed worker – also ticked down from 1.15 to 1.1, signalling a gradual cooling in demand for workers.
ADP Employment Report
Private employers added 183,000 jobs in January, beating expectations of 150,000 and slightly outpacing December’s revised 176,000 gain. The services sector was the clear winner, adding 190,000 jobs, while goods-producing industries – especially manufacturing – continued to struggle, shedding 6,000 jobs.
This divergence highlights a key trend: while overall job growth remains steady, manufacturing has been in a rough patch for months, raising concerns about the sector’s outlook.
Employment Situation Report (ESR).
The official US jobs report showed a slowdown in hiring, with 143,000 jobs added in January – down from December’s 256,000 and below the 170,000 analysts had expected. Meanwhile, the unemployment rate dipped slightly to 4.0% from 4.1%, and private sector hiring slowed as well, with payrolls increasing by 140,000 compared to 223,000 the previous month.
On the wage front, average earnings rose 0.5% for the month, pushing year-over-year wage growth to 4.1%, up from December’s 3.9%. While slower job growth could suggest some cooling in the labour market, rising wages might keep inflation concerns on the radar – something the Fed will be watching closely.
Implications
The final labour reports of the Biden presidency paints a picture of an economy near full employment. While the job market remains strong, signs of moderation are emerging. A stable but slowing labour market could give the Fed room to cut interest rates later this year – but with wages rising and uncertainty around President Trump’s economic policies, they’ll likely stick to a wait-and-see approach. For us investors, a strong but not overheated job market is a good thing, as it helps support consumer spending and corporate earnings. And when corporate earnings rise, share prices tend to follow.😊
Consumer Sentiment Index (CSI)
Consumer sentiment took a hit in February, with the University of Michigan’s CSI falling for the second month in a row to 67.8 – its lowest level since last July. That’s a 4.6% drop from January’s 71.1 and a steep 11.8% decline from a year ago when sentiment was at 76.9. Analysts had expected a stronger reading, making this slide a bit of a surprise.
Looking under the covers, the Current Economic Conditions Index, which reflects how people feel about their personal finances right now, fell to 74 – down 7.2% from last month and 13.5% lower than a year ago. Meanwhile, the Expectations Index, which measures how consumers feel about the future, dipped to 67.3, marking a 2.9% monthly drop and a 10.5% decline year-over-year.
The drop in sentiment was broad-based, affecting consumers across political lines, ages, and incomes. The main culprits? Growing worries that tariffs could drive up inflation, with short-term inflation concerns reaching their highest level since November 2023. On top of that, many Americans fear rising unemployment could be on the horizon, adding to economic uncertainty.
American market volatility
The CBOE Volatility Index (VIX), often called the market’s ‘fear gauge,’ came out high, opening at 20.36 due to uncertainty surrounding tariffs and retaliatory measures. However, as a suspension of tariffs were announced for both Mexico and Canada, the VIX dropped below the 20 mark, moving out of the high-volatility range. By the end of the week, with the immediate threat of a trade war fading, the VIX settled back into a more normal range between 15 and 17.5, closing at 16.54.
For those new to the VIX, think of it as the market’s stress meter. A reading below 12 means calm waters, while 12 to 20 signals normal market swings. If it climbs above 20, nerves are rising, and anything over 30 usually signals real trouble.
Weekly Market and Portfolio Review
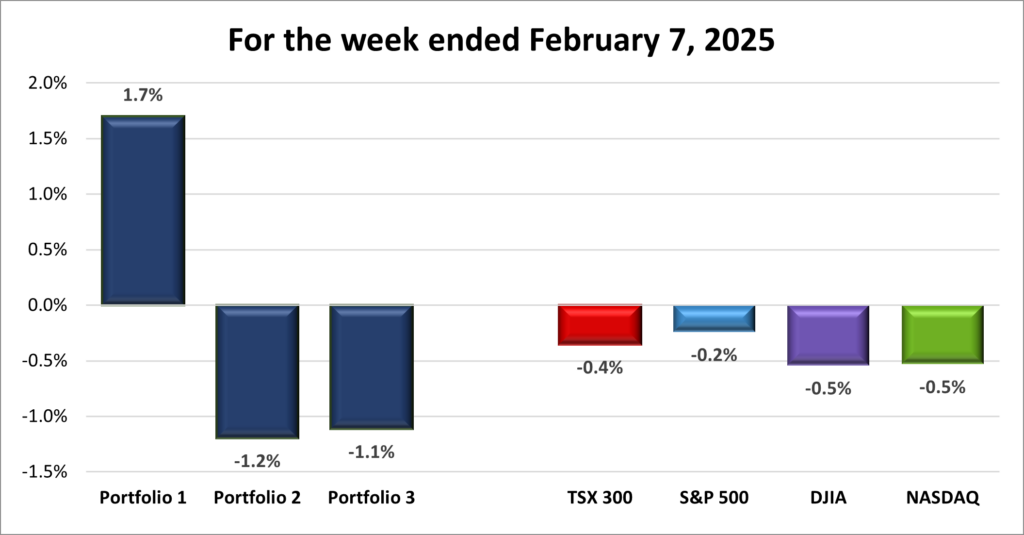
For the week, the TSX (SPTSX) slipped 0.4%, the S&P 500 (SPX) lost 0.2%, the DJIA (INDU) fell 0.5% and the Nasdaq (CCMP) dropped 0.5%.
| Index | Weekly Streak |
| TSX: | 1 – week losing streak |
| S&P: | 2 – week losing streak |
| DJIA: | 1 – week losing streak |
| Nasdaq: | 2 – week losing streak |
 The markets were on a rollercoaster this past week, with all four major indexes fluctuating as trade uncertainty and mixed technology earnings kept investors on edge. As shown in the weekly progress graph above, the week started on shaky ground after the US imposed tariffs on Canada and Mexico, but markets rebounded the next day after both countries were granted at least 30 days to address concerns. With trade worries temporarily on hold, earnings took centre stage.
Technology company earnings were a mixed bag, raising fresh doubts about the massive AI investments. Amazon and Alphabet (Google) both delivered solid results, however, slower-than-expected growth in their cloud divisions, where AI was expected to shine, left investors underwhelmed. Cautious forecasts for the next quarter didn’t help, dampening enthusiasm despite earnings beats. Still, strong reports by other companies helped claw back much of the market’s early losses.
Just as investors thought tariff concerns had cooled, President Trump reignited tensions by announcing plans for new reciprocal tariffs on unspecified countries next week. If tariffs on America’s top trading partners weren’t enough, this latest move added to market jitters. Analysts warn that prolonged trade conflicts could push inflation higher, delaying long-awaited rate cuts even further.
Finally, January labour data showed President Biden left office with the US job market near full employment. While President Trump campaigned on promises of even better economic times, this latest report suggests there’s little room left for improvement – raising concerns that the job market is more likely to weaken than strengthen, especially if trade tensions escalate. In Canada, the latest labour data showed signs of a strengthening labour market, but the positive labour news was overshadowed by lingering tariff threats. This uncertainty weighed on Canadian stocks, particularly those of companies heavily involved in cross-border trade.
The tug-of-war between strong earnings and tariff uncertainty made for a volatile week. The longer trade uncertainty lingers, the greater the risk to the Canadian economy – and, to a lesser extent, the US economy. But with volatility comes opportunity, and I was more than happy to take advantage of it this past week. 😊
| Portfolio | Weekly Streak |
| Portfolio 1: | 1 – week winning streak |
| Portfolio 2: | 2 – week losing streak |
| Portfolio 3: | 1 – week losing streak |
 With all the ups and downs in the markets this past week, I wasn’t sure how my portfolios would perform. With all four major indexes finishing lower, I braced for a rough week – but to my surprise, one portfolio managed to finish higher, as shown in the weekly performance chart below.
Portfolio 1 was the standout, finishing in the green. A solid 74% of its holdings posted weekly gains, led by big movers like TMX Group (TSE: X) and Kraken Robotics (TSE: PNG), each up 12%, Celestica (TSE: CLS) up 14%, Cloudflare (NYSE: NET) up 25%, and Magnite (NASD: MGNI) surging 29%. Nvidia (NASD: NVDA), the portfolio’s largest holding, jumped 14%, driving overall performance. Liberty Media – Formula 1 (NASD: FWONK), Walmart (NYSE: WMT), and TMX Group also hit record highs. On the downside, PayPal (NASD: PYPL) slid 10%, and Skyworks Solutions (NASD: SWKS) took a heavy 27% hit. If not for Nvidia’s strong run, Portfolio 1 would’ve joined the other portfolios and indexes in the red. A silver lining to the pullback in Nvidia’s share price a few weeks ago, the option I sold for Nvidia at $150 expired on February 7, meaning I keep both the shares and the premium the buyer paid me. 😊
Portfolio 2 was a bit of a mystery. Despite 81% of its holdings posting gains, it still ended the week lower. The reason? A few companies with large declines carried enough weight to offset the gains, including Take-Two Interactive Software’s (NASD: TTWO) 13% jump. While TTWO performed well, its smaller weight in the portfolio – ranking 24th out of 27 holdings – limited its impact.
Portfolio 3 had a tough week, snapping a three week winning streak, with just 54% of holdings finishing higher. There were some bright spots – Vertiv Holdings (NYSE: VRT) climbed 14%, Cloudflare gained 25%, and Magnite surged 29% – but those strong performances couldn’t overcome the sharp declines earlier in the week.
While it wasn’t the strongest week, there were plenty of bright spots. Another solid performance from Nvidia, a few standout gains, and some record highs made it a week worth appreciating, even with just one portfolio finishing in the green. Volatility is part of the game, but sticking to my long-term strategy will help me ride out the bumps on the way to my investing goals. 😊
Companies on the Radar
 There was some movement on my radar list this past week – one company dropped off while another caught my attention. I decided to say goodbye to GitLab Inc. (NASD: GTLB), the large-cap software company specializing in developer tools. There was nothing wrong with the business, but when looking at potential investments in technology companies, I felt there were stronger opportunities elsewhere.
Taking its place is Interactive Brokers (NASD: IBKR), a large-cap online brokerage firm known for its advanced trading platform used by professional investors and retail investors (like us!). With access to 150 global markets, IBKR makes it possible to trade stocks, options, bonds, currencies, and more—all from a single platform. Essentially, it opens the door to investing beyond just Canada and the US. I’m not only interested in it as a potential investment but also as a tool for expanding my own portfolio into international markets.
With this update, my radar list stays at five companies – IBKR and the four listed below:
- Sportradar Group AG (NASD: SRAD): A mid-cap Swiss company specializing in sports data, content, and integrity services that support businesses in sports, media, and betting industries.
- Howmet Aerospace Inc. (NYSE: HWM): A large-cap American company producing cutting-edge engineered products like airfoils, titanium forgings, and forged aluminum wheels for aerospace, energy, and transportation sectors.
- Rubrik, Inc. (NASD: RBRK): a high-growth, large-cap American cybersecurity firm.
- Axon Enterprise, Inc. (NASD: AXON): A large-cap innovator in body cameras, TASER devices, and cloud-based evidence management software, serving law enforcement and public safety agencies.
As always, these are not buy recommendations – be sure to do your own research and make decisions that align with your personal financial goals!
The Radar Check was last updated February 7, 2025.


Portfolio Update
Portfolio 1
Portfolio 1 for the week ended February 7, 2025: UP 
- Grab Holdings (NASD: GRAB) is reportedly in advanced talks to merge with its smaller Indonesian rival, GoTo, as both ride-hailing and food delivery giants look to curb years of losses in Southeast Asia.
- Alphabet (NASD: GOOGL) announced they plan to spend US$75 billion on their AI buildout in 2025, 29% more than analysts expected.
Activity
Bought: Alphabet I’ve invested in Alphabet (or as most people know it – Google) twice before and watched the stock climb steadily. I had been looking for an opportunity to add more shares, ideally on a dip, but what really pushed me to increase my investment was their announcement of Willow, their quantum computing chip, in early December.
When it comes to investing in technology, I try to look ahead and identify which companies will dominate when a new breakthrough goes mainstream. That approach worked out well with Nvidia and Shopify (TSE: SHOP). 😊 While quantum computing isn’t commercially viable yet, when it is, I want to be well-positioned. Among all the companies involved, I see Google as the safest bet – they have deep pockets, strong R&D, and a track record of turning innovation into profit.
Beyond quantum computing, Alphabet offers plenty of other growth opportunities. They’re going all-in on artificial intelligence (AI), with plans to invest $75 billion in AI development in 2025 – a move that should enhance everything from Google Search to their cloud services. Speaking of search, Google remains the undisputed leader, with almost 90% of the global search engine market. Alphabet’s diverse revenue streams – from digital ads to cloud computing, healthcare, and self-driving technology with Waymo—give them a strong edge for long-term growth.
Under CEO Sundar Pichai, Alphabet has consistently grown revenue, earnings per share, and cash flow since he took the reins in 2015. So, when the stock dropped 10% after fourth quarter earnings this past week, mainly due to weaker-than-expected cloud revenue, I saw it as a great buying opportunity – and pounced. 😊
Bought: Amazon.com (NASD: AMZN) After successfully adding to my Alphabet position earlier this past week, I set my sights on Amazon – waiting to see if a post-earnings dip would present a buying opportunity. Sure enough, despite beating revenue and net income estimates, Amazon’s cloud revenue came in slightly below expectations, raising concerns about its AI investments and returns. On top of that, its next-quarter revenue forecast fell short of analyst expectations. These two issues triggered a 5% drop in the share price – and that’s when I stepped in.
So why increase my stake (even if it’s still a very small position 😊)? Amazon dominates US e-commerce, controlling nearly 38% of the market, and its relentless focus on speed, selection, and Prime membership benefits keeps it ahead of competitors. But Amazon is far more than just an online retailer. Amazon Web Services (AWS) remains a major profit driver, and with the rise of AI, Amazon is well-positioned to capitalize. Meanwhile, its advertising business is booming, with ad revenue up 19% last quarter as more companies shift their marketing budgets to Amazon’s platform.
Beyond the US, Amazon continues its global expansion, growing Amazon Fresh, Whole Foods, and Prime benefits worldwide. This international push strengthens its long-term prospects while diversifying revenue streams. Financially, Amazon has a strong history of consistent growth and reinvesting in innovation, making it a solid long-term bet. Given all this, I saw the recent dip as a terrific opportunity to buy more shares – so I did. 😊
Dividends
Dividends Received this week for the following companies:
Companies followed by DRIP (Dividend Re-Investment Plan) indicate additional shares were purchased with the dividend. Any cash leftover was added to the cash balance.
Canadian $
Bank of Nova Scotia (TSE: BNS) DRIP
US $
No US$ dividends this past week.
Quarterly Reports
TMX Group Limited
Fourth quarter 2024 financial results on February 3, 2025
Alphabet Inc.
Fourth quarter 2024 financial results on February 4, 2025
PayPal Holdings, Inc.
Fourth quarter 2024 financial results on February 4, 2025
Skyworks Solutions, Inc.
First quarter 2025 financial results on February 5, 2025
Amazon.com, Inc.
Fourth quarter 2025 financial results on February 6, 2025
BCE Inc.
First quarter 2025 financial results on February 6, 2025
Cloudflare, Inc.
Fourth quarter 2025 financial results on February 6, 2025
Ferrari N.V.
Fourth quarter 2024 financial results on February 4, 2025
Portfolio 2
Portfolio 2 for the week ended February 7, 2025: DOWN 
- MongoDB (NASD: MDB) has teamed up with Swiss bank Lombard Odier to modernize the bank’s technology systems. By integrating AI, the partnership aims to simplify the bank’s operations, accelerate innovation, and cut project timelines from days to mere hours – enhancing efficiency across the board.
Activity
No significant activity to report this week.
Dividends
Dividends Received this week for the following companies:
Canadian $
Bank of Nova Scotia (TSE: BNS) DRIP
Dollarama (TSE: DOL)
US $
No US$ dividends this past week.
Quarterly Reports
The Walt Disney Company
First quarter 2025 financial results on February 5, 2025
Take-Two Interactive Software, Inc.
Third quarter 2025 financial results on February 6, 2025
Portfolio 3
Portfolio 3 for the week ended February 7, 2025: DOWN
- Brookfield Asset management (TSE: BAM) has entered the fray to purchase Australian money manager Insignia Financial (ASE: IFL). BAM matched the A$3 billion from other suitors but their offer allowed Insignia shareholders to receive shares in lieu of cash if they prefer.
Activity
No significant activity to report this week.
Dividends
No dividends this past week.
Quarterly Reports
Cloudflare, Inc.
See report under Portfolio 1.