
The AI Revolution: Understanding the Technology Behind the Investment Boom
Part 7: Investing in the AI Ecosystem
Over the past six weeks, we’ve explored what artificial intelligence (AI) is, how AI models learn, the infrastructure required to build them, why companies are spending so heavily on the technology, what AI can do, and why businesses are racing to develop AI capabilities.
The AI Revolution Series
- Part 1: What Is Artificial Intelligence? – What AI is, how it differs from human intelligence, and why today’s AI doesn’t think like people do.
- Part 2: How Does AI Learn? – What training means, how AI models learn from data, and why training requires enormous computing power.
- Part 3: What Does It Take to Build AI? – The chips, memory, networking, data centres, and electricity that make AI possible.
- Part 4: Why Does AI Cost So Much? – Why building and operating AI requires enormous investment, and why companies are willing to spend hundreds of billions to avoid falling behind.
- Part 5: What Are AI Capabilities? – The things AI can increasingly do, from understanding language and recognizing images to generating content, solving problems, and taking actions.
- Part 6: Why Are Companies Racing to Build AI? – How AI can improve productivity, reduce costs, create new revenue, and give companies a competitive advantage—and why businesses fear falling behind.
- Part 7: Investing in the AI Ecosystem – How investors can participate in the AI revolution, where companies fit into the ecosystem, and why AI exposure alone doesn’t make a stock a good investment.
That brings us to the final question: How can investors participate in the AI revolution?
When most people think about investing in AI, Nvidia (NASDAQ: NVDA) is probably the first company that comes to mind. Given the extraordinary demand for its graphics processing units (GPUs), that’s understandable. But there is no single “AI stock.”
AI is an ecosystem.
It starts with the chips providing the computing power required to train and operate AI models. Nvidia is the dominant player, but Advanced Micro Devices (NASDAQ: AMD) and Broadcom (NASDAQ: AVGO) also play important roles.
Those chips need enormous amounts of data delivered at high speeds, creating opportunities for memory companies such as SK hynix (NASDAQ: SKHY) and Micron Technology (NASDAQ: MU). Advanced memory, including high-bandwidth memory, helps keep AI chips supplied with data.
Then comes networking. Thousands of chips and servers must work together, requiring companies such as Arista Networks (NYSE: ANET), which supplies networking equipment, and Corning (NYSE: GLW), which provides fibre-optic cables that connect those systems.
All of this equipment needs somewhere to operate. AI data centres house thousands of servers, networking equipment, cooling infrastructure, and complex power systems. They consume enormous amounts of electricity, making power another increasingly important part of the ecosystem.
As companies build more AI data centres, demand for reliable electricity is increasing. In some locations, access to sufficient power has become a constraint on new construction, bringing utilities and energy infrastructure into a conversation once focused almost entirely on technology.
But infrastructure alone doesn’t create value.
The hardware needs software, and businesses need a practical way to access AI. Cloud providers – including Microsoft (NASDAQ: MSFT), Alphabet (NASDAQ: GOOGL), and Amazon (NASDAQ: AMZN) – bring together computing power, AI models, and software tools, allowing businesses to use AI without building their own infrastructure.
Software companies then turn that technology into applications that can automate work, analyse information, improve customer service, and develop new products. At the same time, the growing use of AI creates new cybersecurity challenges – and opportunities for companies developing AI-powered defences.
For investors, there are two broad ways to think about the opportunity: companies building the ecosystem and companies using AI to improve their businesses. The eventual beneficiaries could extend far beyond the technology sector.
More by accident than design, I realized that Portfolio 3 had gradually become a good example of the ecosystem I’ve been describing. It already included Microsoft, Nvidia, and data-centre infrastructure company Vertiv Holdings (NYSE: VRT). Recent additions – including Broadcom, Corning, and Amphenol (NYSE: APH) – expanded its exposure to chips, fibre-optic cables, and high-speed interconnect products.
Looking across all three portfolios, the exposure is broader still. I also own major cloud and AI providers Microsoft, Amazon, and Alphabet’s Google, along with cybersecurity companies CrowdStrike (NASDAQ: CRWD) and Cloudflare (NYSE: NET). Without specifically setting out to build an AI portfolio, I had gradually assembled exposure to many different parts of the ecosystem.
At first, I was concerned that I had increased my exposure to technology – and particularly the more volatile AI companies – more than intended. But the more I thought about it, the more comfortable I became with that exposure. The journey will undoubtedly be bumpy, with some sizeable potholes along the way, but I believe the long-term opportunities created by AI justify accepting that volatility.
Rather than betting everything on a single company, my three portfolios provide exposure to several parts of the AI ecosystem, with Portfolio 3 offering the broadest exposure.
The key takeaway from this series is that AI isn’t a single company, product, or industry – it’s an ecosystem in which each part depends on the others. That creates opportunities across a wide range of businesses, but being part of the AI revolution doesn’t automatically make a company a good investment. The challenge for investors is to understand where each company fits, how it could benefit, and whether those benefits are already reflected in its share price. Ultimately, the winners won’t necessarily be the companies getting the most attention today, but those that can turn their role in the AI ecosystem into sustainable long-term value for shareholders.
The AI revolution may be a long-term investment opportunity, but it is only one of the forces moving markets in the short term. With the seven-part series now complete, let’s turn our attention back to what happened in the markets this week – and how it impacted my three portfolios.
Items that may only interest or educate me ….
Canadian Economic news, US Economic news, ….
Canadian Economic news
This past week’s key economic data that the Bank of Canada (BoC) considers when deciding whether to raise or lower the interest rate.
Rate Decision
As expected, the Bank of Canada held its benchmark interest rate at 2.25% for the seventh consecutive meeting, keeping rates unchanged since December 2025.
The decision highlights the increasingly difficult balancing act facing the Bank. Renewed trade tensions with the US could weaken Canada’s economic outlook, while higher energy prices and Canada’s incoming dollar-for-dollar tariffs on US goods could push inflation higher.
Governor Tiff Macklem said inflation risks are rising, driven primarily by higher energy costs and tariffs. The renewed escalation of conflict in the Middle East has pushed oil prices higher, raising the risk that more expensive energy could eventually spill over into the prices of other goods and services. At the same time, trade tensions with the US have created what the Bank described as “heightened uncertainty” for the economic outlook.
The Bank therefore has reason to remain cautious. There is still some slack in the economy, and a weaker outlook could argue for lower interest rates. However, persistent energy inflation and higher tariffs could push prices higher, making rate cuts more difficult. For now, the Bank appears content to wait for more clarity before moving in either direction.
The next Bank of Canada interest rate decision is scheduled for October 28.
Labour Force Survey (LFS)
Statistics Canada’s August LFS was weaker than expected, although the unchanged unemployment rate made the overall picture somewhat less negative than the headline number suggests. Employment fell by 42,000 jobs in August, a sharp reversal from the 75,100 positions added in July. Analysts had expected the economy to add another 15,000 jobs.
The unemployment rate held steady at a two-year low of 6.4% for the second straight month, following three consecutive monthly declines. At first glance, it may seem odd that employment could fall without pushing the unemployment rate higher. However, the labour force also declined, meaning fewer people were either working or actively looking for work. That helped keep the unemployment rate unchanged and suggests the report did not point to the same broad deterioration that a sharp rise in unemployment would have signalled.
Average hourly wages also continued to cool, rising 2.0% from a year earlier, compared with increases of 2.8% in July and 3.3% in June. Wage growth is now running below the 3% pace of consumer price inflation, another sign that wage pressures are easing.
The August job losses were clearly disappointing, but one weak month does not necessarily signal a broader downturn. The bigger question is whether September’s data shows that August was a temporary setback or the beginning of a more sustained slowdown.
For the BoC, the weaker employment figure and slower wage growth could provide some reassurance that the labour market is not adding significant inflationary pressure.
Canadian Market Volatility
Canada’s version of the market’s “fear gauge” is the S&P/TSX 60 VIX Index (VIXC). Like the US VIX, it measures expected volatility in the Canadian stock market over the next 30 days. Higher readings indicate greater uncertainty, while lower readings point to calmer conditions.
The VIXC opened the week at 13.91, up from the previous week’s close of 13.24. It spent most of the week between 13.50 and 14.00 despite increased Middle East hostilities that pushed oil prices and inflation concerns higher. However, it jumped above 16 late in the week after the US carried out a “very heavy” attack against Iran, sending oil prices higher. Canada’s trade surplus also shrank sharply in July as energy and metal exports declined while imports increased. Just a few hours later, the VIXC had dropped back to 13, where it remained for the rest of the week, ending at 13.33.
Overall, the VIXC remained relatively subdued, indicating that investors weren’t overly concerned about the risks facing the Canadian market. Even renewed trade tensions and the US attack on Iran failed to keep volatility elevated for long. Its quick retreat to 13 suggests that, despite the potential risks, investors remain relatively comfortable with the current market environment.
Note: The VIXC typically trades at lower levels than the VIX, partly because of the different makeup of the Canadian and US markets. The S&P 500 has a much larger weighting in technology, while the TSX has greater exposure to financials, energy and materials. Because these sectors respond differently to economic conditions and commodity prices, the two indexes can have different levels of expected volatility.
US Economic news
This past week’s key data points that the Federal Reserve (Fed) considers when deciding whether to raise or lower the interest rate.
Labour data
This week’s labour data comes from three key reports: the Job Openings and Labor Turnover Survey (JOLTS), the ADP Employment Report and the Employment Situation Summary (ESS). Each looks at a different part of the US labour market. JOLTS measures employer demand through job openings, hiring and quits; ADP provides an early snapshot of private-sector hiring; and the ESS provides the broader picture, including job creation, unemployment and wage growth. Together, they help investors gauge whether the labour market remains resilient or is losing momentum.
One important difference is timing. JOLTS covers July, while ADP and the ESS provide a more current look at employment conditions in August.
Labor Department’s Job Openings and Labor Turnover Survey
The latest JOLTS report offered another sign that the US labour market is becoming more cautious. Job openings in July rose slightly to 7.3 million from a downwardly revised 7.2 million in June, broadly in line with expectations.
However, the details pointed to what economists describe as a “low-hire, low-fire” labour market. Companies are holding onto existing workers rather than cutting jobs but are also becoming less willing to hire new ones. For the Fed, that provides further evidence that the labour market is losing momentum, even if it isn’t showing signs of a sharp downturn.
ADP Employment Report
The ADP Employment Report came in well below expectations, with US private-sector employers adding 38,000 jobs in August, down from an upwardly revised 46,000 in July. That marked the slowest pace of job creation since January and fell short of analysts’ expectations for 48,000 new jobs.
The weak headline number was only part of the story. Job growth was concentrated in education and health services, leisure and hospitality, and construction, while manufacturing and professional and business services reported sharp job losses. The uneven results suggest hiring is becoming increasingly selective rather than broadly based across the economy.
The Bureau of Labor Statistics’ Employment Situation Summary
The August ESS, better known as the monthly jobs report, delivered a much stronger-than-expected result. Non-farm payrolls increased by 162,000, nearly three times the 56,000 jobs analysts had expected and a sharp rebound from July’s upwardly revised gain of 21,000.
While encouraging, the August gain needs to be viewed in the context of a cooling labour market. The increase lifted the average monthly job gain so far this year to 80,000, compared with just 10,000 in 2025.
The unemployment rate held steady at 4.1%, in line with expectations, while wage growth continued to ease. Average hourly earnings increased 0.3% during the month, with annual wage growth slowing slightly to 3.1% from 3.2% in July.
Overall Labour Takeaway
Taken together, this week’s three reports paint a more nuanced picture of the American labour market. JOLTS and ADP pointed to cautious employers and weaker hiring, while the ESS showed that the broader labour market remains more resilient than those reports suggested. August’s 162,000 jobs were a particularly strong result, marking the biggest upside surprise since 1998. However, the much slower pace of job creation this year shows that the labour market has cooled from last year’s levels.
The good news is that the cooling has so far been relatively orderly. Employers appear reluctant to add workers, but they aren’t aggressively cutting them either. The unemployment rate remains low, while wage growth continues to ease. For the Fed, that’s a relatively favourable combination: the labour market is losing momentum without showing signs of a sharp deterioration, while slower wage growth reduces some of the inflationary pressure that could otherwise keep interest rates higher.
For investors, the key question is whether this gradual cooling continues or begins to accelerate. For now, the data suggest the American economy is slowing rather than stumbling.
American Market Volatility
The VIX – often called the market’s “fear gauge” – measures expected S&P 500 volatility over the next 30 days. Higher readings signal greater uncertainty, while levels above 20 are typically associated with elevated volatility.
The VIX opened the week at 15.24, up from the previous Friday’s close of 14.43, after the US attacked Iranian missile sites. Rising oil prices renewed concerns about inflation and the possibility of further interest-rate hikes.
Those concerns pushed the VIX close to 17 by midweek as oil prices and long-term bond yields rose. However, sentiment improved later in the week after a Fed official pointed to encouraging signs of disinflation. The VIX fell below 15 and continued lower despite the stronger-than-expected jobs report, finishing the week at 14.53.
Overall, the VIX remained well below 20, suggesting investors were not signalling widespread fear despite geopolitical tensions, rising oil prices and uncertainty over inflation and interest rates.
Weekly Market and Portfolio Review
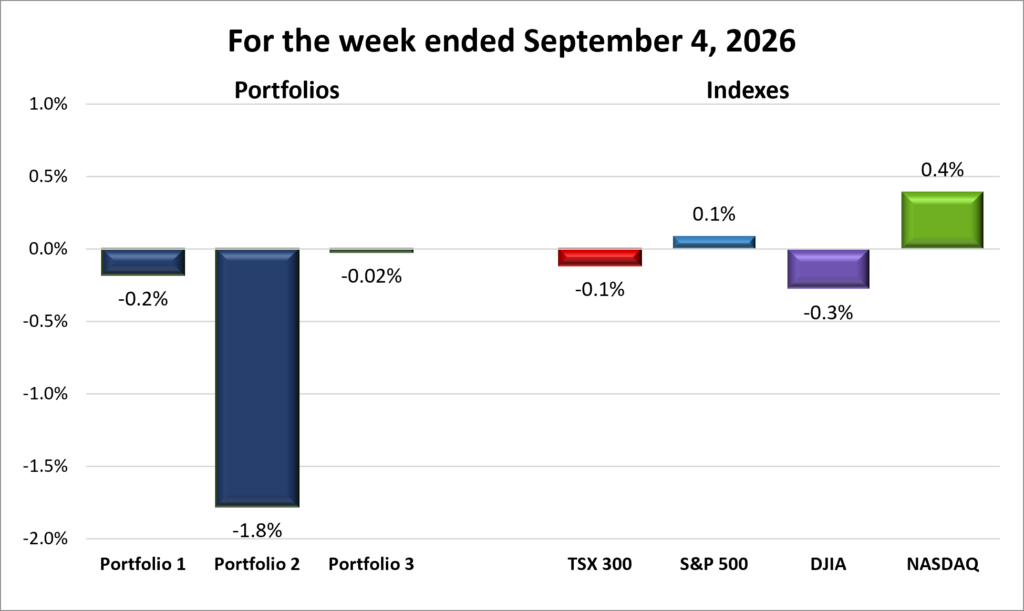
For the week, the TSX (SPTSX) slipped 0.1%, the S&P 500 (SPX) edged higher 0.1%, the DJIA (INDU) dipped 0.3% and the Nasdaq (CCMP) rose 0.4%.
| Index | Weekly Streak |
| TSX: | 3 – week losing streak |
| S&P: | 2 – week winning streak |
| DJIA: | 1 – week losing streak |
| Nasdaq: | 2 – week winning streak |

 ] The week got off to a rough start, with all four indexes, the Toronto Stock Exchange Composite Index (TSX), S&P 500 Index (S&P), Dow Jones Industrial Average (DJIA), and Nasdaq Composite Index (Nasdaq), heading lower. It looked like a week to forget. However, the indexes reversed course midweek, each snapping a three-day losing streak before posting two straight days of gains. Despite a Friday pullback, that was enough for the growth-oriented S&P and Nasdaq to extend their weekly winning streaks. Unfortunately, the Friday pullback pushed the TSX and DJIA back into the red for the week.
The indexes started September under pressure as renewed fighting between the US and Iran pushed oil prices higher. With the 10-year yield on US government bonds approaching 4.8%, investors worried that higher energy costs could keep inflation elevated and force the Fed to keep rates higher for longer. But the concern wasn’t simply rising bond yields. It’s that investors can now earn nearly 5% from a US government security with essentially no credit risk. That makes stocks, particularly technology and other growth stocks, less attractive by comparison.
The tone improved as earlier labour-market data suggested employment was losing momentum, making investors more comfortable with the possibility of lower interest rates. Expectations received another boost Thursday when Fed Governor Christopher Waller said he would support keeping rates unchanged at the September meeting if upcoming inflation data continues to improve. His comments pushed Treasury yields lower and gave investors some relief after the sharp rise earlier in the week.
That optimism didn’t last long. Friday’s jobs report painted a much stronger picture of the US labour market than expected. The economy added 162,000 jobs in August, far more than the roughly 55,000 expected, while the unemployment rate held at 4.1%. July’s initially reported job loss was also revised into a small gain. The stronger report pushed Treasury yields higher and put renewed pressure on stocks as investors reassessed the chances of a September rate hike.
AI provided another source of enthusiasm within technology stocks. Nvidia’s planned US$13-billion acquisition of AI platform Hugging Face reinforced the view that the company is expanding its influence beyond chips and across the broader AI ecosystem. That helped maintain investor interest in technology even as markets wrestled with the economic and interest-rate outlook.
In Canada, the TSX followed the same broad pattern, falling sharply to start the week before rebounding strongly. But the Canadian market received an additional boost from its large exposure to resource stocks. Gold and other metals rose as expectations for US interest rates shifted, sending the materials sector sharply higher, while elevated oil prices supported energy stocks as the conflict between the US and Iran continued. Higher oil prices remain a double-edged sword, however, supporting energy companies while adding to inflation pressures.
Financials, another major component of the TSX, were also influenced by the interest-rate outlook. The BoC left its benchmark rate unchanged at 2.25% on Wednesday and maintained a cautious stance on inflation. At the same time, Canada’s weaker employment picture could give the Bank more reason to keep rates on hold.
The week ended on a more positive note, but the recovery was far from broad-based. The S&P 500 and Nasdaq managed to finish higher, while the DJIA and TSX remained in negative territory. That uneven performance is a reminder that investors haven’t abandoned risk, but they are still selective about where they’re willing to put their money. With September off to a volatile start, the coming weeks should provide a better indication of whether the recent rebound has staying power.
| Portfolio | Weekly Streak |
| Portfolio 1: | 1 – week losing streak |
| Portfolio 2: | 1 – week losing streak |
| Portfolio 3: | 1 – week losing streak |
September has a reputation for being the market’s weakest month, and my three portfolios certainly didn’t get off to a strong start. All three lost value this week, despite their largest holdings actually gaining. Normally, when the biggest position in a portfolio rises, it provides enough support to lift the portfolio with it. This week, however, the weakness elsewhere was enough to overwhelm those gains.
Portfolio 1 fell 0.2%, with just 35% of its holdings finishing the week higher. Among the winners was Nvidia, the portfolio’s largest holding, which gained 5%. That wasn’t enough to offset the broader weakness, however. CrowdStrike set a record high early in the week before pulling back in the final few days, another example of how quickly gains can disappear in a volatile market.
Portfolio 2 had the toughest week, falling 1.8%, with 44% of its holdings posting gains. The Bank of Nova Scotia (TSE: BNS), its largest holding, was among the winners, but MongoDB (NASDAQ: MDB) was a significant drag, falling almost 18%. The selloff was particularly frustrating because MongoDB beat earnings estimates and raised its full-year outlook, both positive developments. Investors instead focused on management’s forecast for a slower third quarter, giving them an excuse to take profits after several consecutive quarters of blowout results.
Portfolio 3 came closest to breaking even, slipping just 0.02% when the result is carried to two decimal places. It also had the highest percentage of weekly winners, with 50% of its holdings gaining, including Nvidia, its largest position. Broadcom was one of the bigger drags, falling 2.7%. Its decline wasn’t due to disappointing earnings, which were actually very strong, but to a weaker-than-expected revenue forecast that raised concerns about what lies ahead.
The week was a good reminder that even a strong performance from a portfolio’s largest holding doesn’t guarantee a positive result. With all three portfolios declining despite gains from their biggest positions, diversification worked both ways this week: strength in a few key holdings helped cushion the declines elsewhere, but it wasn’t enough to overcome them.
Companies on the Radar
 Once again, no new companies made their way onto my stock radar this week, leaving the list unchanged at these five below.
- Mattr Corp. (TSE: MATR): A small cap Canadian industrial technology company that designs and manufactures specialized infrastructure products using advanced materials. The company may not be familiar to most investors, but its products support industries such as energy, electrification, communications, transportation, and water management. From composite pipes and underground storage tanks to specialized wire and cable solutions, Mattr creates products designed to be lighter, more durable, and resistant to harsh environments. Think of it as a behind-the-scenes supplier helping modern infrastructure operate more safely and efficiently, generating revenue by selling specialized products to industrial customers around the world.
- Capital Power Corporation (TSX: CPX): A mid cap Canadian power producer that generates electricity from a mix of natural gas, wind, solar and battery storage across North America. With electricity demand rising rapidly from AI data centres, industrial growth and electrification, Capital Power is expanding its natural-gas generation while adding renewable and storage capacity. Its recent agreement to supply 250 MW of power to a new Meta (NASDAQ: META) data centre in Alberta for more than 10 years highlights how the AI boom is creating opportunities beyond the technology companies building the data centres themselves.
- Emera Incorporated (TSX: EMA): A large cap Canadian energy company that owns regulated electric and natural gas utilities serving about 2.6 million customers across Canada, the US and the Caribbean. Its utilities provide a relatively stable source of revenue while Emera invests billions in expanding and modernizing its power networks. With electricity demand expected to grow as AI data centres, industrial activity and electrification increase, Emera could benefit from the long-term need for more reliable power.
- S&P Global (NYSE: SPGI): A large cap American company and one of the world’s most important financial information companies. Most investors know it for the S&P 500 Index, but the business also provides credit ratings, market data, analytics, and research used by banks, corporations, governments, and investors worldwide. Think of it as one of the key information providers that helps global financial markets function, generating revenue through subscriptions, licensing fees, and rating services.
- TerraVest Industries (TSE: TVK): A mid cap Canadian industrial company that produces equipment for energy, storage, and transportation markets, including propane tanks, pressure vessels, and heating systems. It grows through a mix of organic expansion and acquisitions, serving steady, asset-heavy industrial niches across North America.
As always, these are not buy recommendations. Make sure to do your own research and choose investments that fit your personal financial goals.
The Radar Check was last updated September 4, 2026.


That’s a wrap for this week, thanks for reading – may your portfolio stay green and your dividends steady. See you next time!