
Relief Rally on the Horizon?
Exploring the sectors likely to gain – or stumble – if tensions ease.
March has been a rollercoaster for markets on both sides of the 49th parallel, with hostilities in the Middle East sending oil, stocks, and investor nerves on a wild ride. Just when it seemed the turmoil would drag on – and inflation fears start creeping in – a possible ceasefire is now on the horizon. Let’s assume both sides are serious about ending the conflict and coming up with a peace plan. After exploring the potential impacts of both a short and an extended conflict, this week I’d like to discuss what an end to hostilities could mean for markets.
If an extended conflict creates a tougher backdrop for markets, as discussed last week, a ceasefire would largely reverse those same pressures. It starts with oil. Easing tensions would likely bring crude prices down, helping to ease inflation concerns and take pressure off both consumers and businesses. That, in turn, could give central banks like the Bank of Canada and the Federal Reserve more flexibility on interest rates, helping shift the environment toward steadier growth and improved sentiment.
In the immediate aftermath, markets would likely react quickly, with an initial relief rally as oil prices pull back and geopolitical risk fades. Beyond that first move, however, attention would shift back to the usual drivers – economic data, inflation trends, and central bank decisions. If those don’t improve as much as expected, the longer-term impact of a ceasefire may be more limited than that initial reaction suggests.
From there, the impact would ripple through sectors in very different ways. On the Canadian side, three sectors stand out. Energy – a major driver of the TSX – would likely face short-term pressure. Companies like Tourmaline Oil (TSE: TOU) have benefited from elevated prices, so a pullback in crude would likely weigh on their share prices. Financials, particularly the big banks like TD Bank (TSE: TD), could benefit as easing inflation improves the outlook for interest rates and reduces economic uncertainty, supporting lending activity and credit quality. Consumer cyclicals like Aritzia (TSE: ATZ) would also get a boost, as lower fuel costs and reduced inflation pressure leave households with more spending power.
In the US, a similar but more growth-driven pattern would likely emerge. Energy stocks, including Chevron (NYSE: CVX), would likely pull back alongside oil prices. Technology – a dominant force in US markets – could benefit as lower inflation and bond yields support higher valuations for companies like Apple (NASD: AAPL) and CrowdStrike (NASD: CRWD). Consumer cyclicals such as Amazon (NASD: AMZN) would also likely see renewed strength as improving sentiment and lower cost pressures support spending.
Taken together, a ceasefire would likely trigger a rotation in markets – away from energy and toward rate-sensitive, consumer-driven sectors, though how long that shift lasts will ultimately depend on how inflation and interest rates evolve from here.
While a potential ceasefire could shift markets in the weeks ahead, this past week was still very much driven by ongoing uncertainty. Let’s see how markets reacted and the impact on my three portfolios.
Items that may only interest or educate me ….
Canadian Economic news, US Economic news, ….
Canadian Economic news
This past week’s key economic data that the Bank of Canada (BoC) considers when deciding whether to raise or lower the interest rate.
Gross Domestic Product (GDP)
Canada’s economy performed slightly better than expected in January, according to Statistics Canada. GDP rose 0.1% month over month, following a 0.2% increase in December, while analysts had expected little to no growth. On a year-over-year basis, the economy expanded by 0.6% – not exactly strong, but still moving in the right direction.
Under the hood, the growth was driven mainly by goods-producing industries, which rose 0.2% on the month. Mining, quarrying, and oil and gas extraction led the way with a 1.2% gain, continuing to benefit from higher energy activity. Over the past year, agriculture, forestry, fishing, and hunting has been a standout, up 5.4%, while manufacturing remains a weak spot, down 4.6%.
On the services side, activity was essentially flat in January, showing limited momentum from the consumer side of the economy. Retail trade was a bright spot, rising 0.8% on the month, while wholesale trade declined 1.2%. Looking at the past year, sectors like finance and insurance, along with information and cultural industries, grew 3.2%, while wholesale trade slipped 1.7%.
Together, the report suggests the Canadian economy is still growing, but only modestly. Early estimates point to a potential 0.2% increase in February, which would signal slightly firmer momentum heading into the first quarter. For now, though, growth remains sluggish overall, helping explain why the BoC has been taking a cautious, wait-and-see approach.
Canadian Market Volatility
Canada’s version of the market “fear gauge” is the S&P/TSX Volatility Index (VIXC), often shown on trading platforms as VIXI.TO. Like the CBOE Volatility Index in the US, it measures how much volatility investors expect in the Canadian stock market over the next 30 days.
The index opened the week at 22.04 and briefly climbed above 23, reflecting elevated uncertainty tied to ongoing tensions in the Middle East and fears of inflation. That mood began to shift as the week progressed, however, as optimism around a potential de-escalation in the US/Israel–Iran conflict helped ease investor anxiety. As a result, the VIXC fell below 20 before closing the week at 20.41, marking a slight decline in market stress.
With the VIXC spending much of the week in the low 20s and trending lower, investors appear to be gradually regaining confidence. It’s also worth noting that Canadian volatility typically runs lower than in the US, largely because the TSX is more heavily weighted toward financials, energy, and materials – sectors that tend to see steadier price movements than the high-growth technology stocks that dominate US markets.
US Economic news
This past week’s key data points that the Federal Reserve (Fed) considers when deciding whether to raise or lower the interest rate.
Labour data
This week’s labour data, spanning three major reports—the Job Openings and Labor Turnover Survey (JOLTS), the ADP Employment Report, and the Employment Situation Summary (ESS) – offers a full snapshot of the US job market. Each report captures a different angle: JOLTS tracks demand for workers through job openings, hiring, and quits; ADP provides an early read on private-sector payroll growth; and the ESS, better known as the monthly jobs report, delivers the big picture with unemployment, job creation, and wage growth. Taken together, they offer one of the clearest reads on whether the labour market is still holding firm – or starting to show cracks.
Labor Department’s Job Openings and Labor Turnover Survey
The JOLTS report showed job openings fell by 358,000 to 6.882 million in February, down from 7.240 million in January and slightly below expectations of 6.918 million. The decline points to a continued, gradual easing in labour demand, while still remaining at levels consistent with a relatively solid job market.
ADP Employment Report
The ADP Employment Report showed private-sector payrolls rose by 62,000 jobs in March, down slightly from February’s upwardly revised gain of 66,000 and above expectations of around 40,000. The data points to continued, moderate job growth, while remaining below levels typically seen during stronger labour market conditions.
The Bureau of Labor Statistics’ Employment Situation Summary
The latest report from the Bureau of Labor Statistics showed job growth came in much stronger than expected, with the economy adding 178,000 jobs in March, well above forecasts of around 60,000. That marks a solid rebound from February, which was revised down to a loss of 133,000 jobs. The unemployment rate edged lower to 4.3%, down from 4.4% the previous month, while wage growth showed signs of easing, with average hourly earnings rising 0.2% in March after a 0.4% increase in February.
Overall Labour Analysis
Taken together, this week’s labour data presents a more nuanced picture than the headlines might suggest. While job openings declined and private payroll growth remained modest, the ESS showed a much stronger-than-expected surge in hiring, with job creation coming in nearly three times forecasts and the unemployment rate ticking lower. On the surface, that points to a labour market that is still resilient.
However, a closer look at the details tells a slightly different story. The drop in unemployment was partly driven by a decline in labour force participation, meaning fewer people were working or actively looking for work. At the same time, wage growth slowed, which can be an early sign that demand for workers is easing.
For us investors, this creates a bit of a push and pull. Strong job growth reduces the urgency for interest rate cuts, but softer wage growth and declining participation suggest the economy may be cooling rather than overheating. Add in the uncertainty from the Iran conflict and the risk of higher oil prices pushing inflation back up, and it’s easy to see why markets are still sensitive to every new data point.
In short, the labour market is still holding up, but there are enough cracks beneath the surface to keep the Fed firmly in wait-and-see mode and investors on edge.
Retail Sales
The US Commerce Department reported that retail sales rose 0.6% in February, rebounding from a revised 0.1% decline in January and coming in slightly ahead of expectations of 0.5%. On a year-over-year basis, sales increased 3.7%, up from 3.2% in January, pointing to a solid recovery after a weaker start to the year.
Looking under the hood, the results were mixed. Health and personal care stores led the way with a 2.3% monthly gain, while food and beverage stores and furniture and home furnishings stores both saw sales decline by 1.0%. Over the past year, sporting goods, hobby, musical instrument, and book stores stood out with an 11.3% increase, while furniture and home furnishings remained a weak spot, with sales down 5.6%.
Core retail sales – which strip out autos, auto parts, and gasoline to provide a clearer picture of underlying consumer demand – rose 0.4% in February after a 0.2% increase in January, beating expectations for flat growth. On an annual basis, core sales grew 4.1%, a slight slowdown from 4.7% in January, but still a sign that consumer spending is still relatively resilient.
The rebound in headline sales, combined with steady core growth, reinforces the view that the American consumer is still holding up despite higher interest rates and rising costs. With spending continuing across both essential and discretionary categories, the data suggests households are still willing to open their wallets – for now – even as the broader economic backdrop remains uncertain.
Consumer Confidence Index (CCI)
The Conference Board’s latest CCI came in at 91.8 in March, up from 91.0 in February and ahead of expectations of 88, offering a modest upside surprise even as oil prices have been rising rapidly. On the surface, the improvement looks encouraging, but the underlying details tell a more cautious story. The Present Situation Index, which reflects views on current business conditions and the labour market, rose to 123.3, suggesting consumers still feel relatively good about today’s economy. However, the Expectations Index, which tracks the outlook over the next six months, fell to 70.9 – hovering near levels often associated with recession risk. In other words, people feel okay about where things stand now, but are growing more uneasy about what lies ahead.
Adding to that concern, inflation expectations climbed to around 5.2%, driven largely by higher energy prices, which complicates the path toward lower interest rates. Taken together, the report suggests the consumer is holding up for now, but confidence is starting to crack, reinforcing the “higher for longer” interest rates backdrop investors have been grappling with since the start of the US/Israel–Iran conflict.
American Market Volatility
The CBOE Volatility Index – often referred to as the market’s “fear gauge” – tracks how much volatility investors expect over the next 30 days. Think of it as the market’s pulse: readings above 20 signal rising uncertainty, while levels above 30 point to elevated fear and heightened market stress. That’s exactly where the VIX started the week, opening at 30.79 and reflecting the high level of anxiety surrounding geopolitical tensions.
That mood began to shift early in the week, however, as reports suggested the US could scale back its presence in the region and Iranian leadership signalled openness to negotiations. As tensions appeared to ease, so did investor nerves, with the VIX dropping as low as 23.5 – its lowest level in over a week – before closing at 23.87. While still elevated, the move marked a clear step down in market fear compared to where the week began.
Weekly Market and Portfolio Review
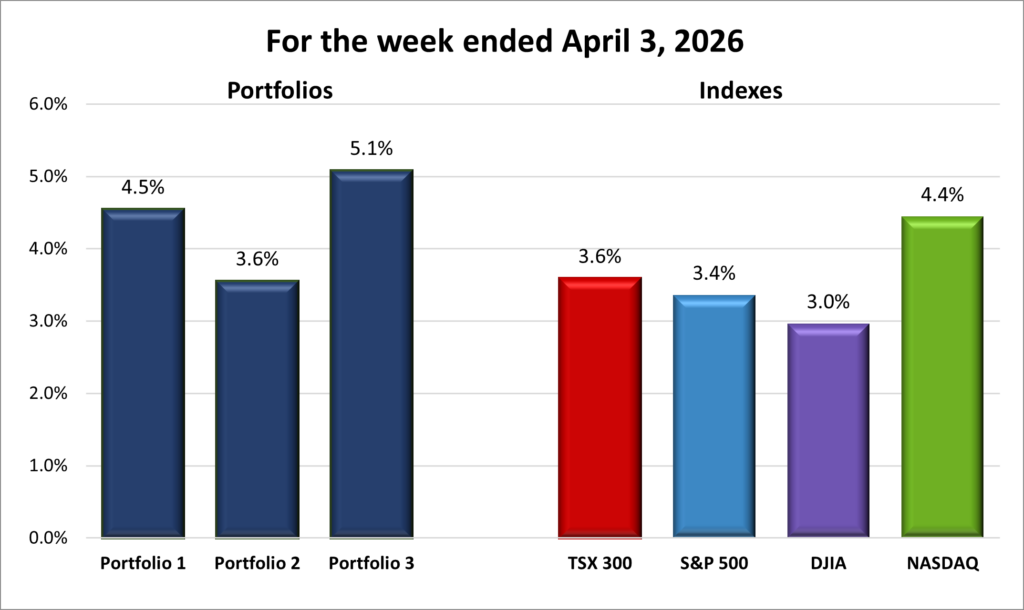
For the week, the TSX (SPTSX) jumped 3.6%, the S&P 500 (SPX) gained 3.4%, the DJIA (INDU) added 3.0% and the Nasdaq (CCMP) surged 4.4%.
| Index | Weekly Streak |
| TSX: | 2 – week winning streak |
| S&P: | 1 – week winning streak |
| DJIA: | 1 – week winning streak |
| Nasdaq: | 1 – week winning streak |
 The sour taste from the previous few weeks lingered at the start of this one, but it didn’t last long. As the week progressed, signs that both sides might be open to ending the conflict lifted investor sentiment. By the close of the shortened trading week, markets had rallied for three straight days, finishing on a more optimistic note.
All four major North American indexes posted their best week of the year. The Toronto Stock Exchange Composite Index (TSX) extended its winning streak to two weeks, while the S&P 500 Index (S&P), the Dow Jones Industrial Average (DJIA), and the Nasdaq Composite Index (Nasdaq) recorded their biggest weekly gains in four months, breaking a six-week losing streak.
The Iran conflict remained the dominant market driver. Early in the week, elevated oil prices supported energy stocks, but that strength wasn’t enough to lift the broader market. Sentiment shifted sharply on Tuesday after reports that President Trump was prepared to pause the military campaign and that Iran was open to negotiations. That combination triggered a powerful rally, sending US indexes to their largest one-day gains since May 2025, when a pause in US–China trade tensions sparked a similar surge.
This marked the fifth week of the conflict, in the middle of earlier expectations of a four- to six-week duration. While there are signs it could end sooner, uncertainty remains, and analysts expect the conflict to leave a lasting mark on global economic growth.
As fears eased and interest rate expectations stabilised, investors rotated back into growth-oriented areas. Technology stocks drove the Nasdaq higher, supported by steady rate expectations and strong momentum in large-cap names, while financials and consumer-focused companies lifted the S&P and DJIA. Energy stocks pulled back later as oil prices eased, but the shift toward growth and rate-sensitive sectors kept the rally going.
Overshadowed by the conflict, US economic data showed a resilient but not overheated economy. Job creation came in well above expectations and the unemployment rate edged lower, though slower wage growth and a dip in labour force participation hinted at easing demand for workers. Retail sales rebounded modestly, while preliminary readings of the CCI suggested confidence is starting to waver. Taken together, the data gives the Fed room to hold its current rate of 3.75%, with many analysts now expecting no cuts this year given the inflationary pressures from the conflict.
In Canada, the TSX followed a similar pattern. Early in the week, high oil prices gave energy stocks a lift, but broader market weakness persisted as uncertainty around the conflict and inflation weighed on sentiment. The turning point came Tuesday, when signs of de-escalation pushed oil prices lower and sparked a broad-based rally. January GDP data showing slightly stronger-than-expected growth further supported the rebound. By week’s end, Canadian markets had rebounded solidly, driven by easing fears of a prolonged Middle East conflict and the inflationary pressures it had threatened to bring.
All in all, it was a week that reminded investors just how quickly sentiment can turn. Signs of de-escalation in the Middle East, a resilient American economy, and solid GDP data in Canada gave markets a lift, even as uncertainty over the conflict and inflation lingers. For now, the rally across growth sectors shows that confidence can bounce back quickly when the picture brightens, as it did this week. Here’s hoping the momentum continues – and that the conflict comes to an end sooner rather than later.
| Portfolio | Weekly Streak |
| Portfolio 1: | 1 – week winning streak |
| Portfolio 2: | 1 – week winning streak |
| Portfolio 3: | 1 – week winning streak |
With the major indexes posting strong weekly gains, all three portfolios followed suit, snapping their recent losing streaks. It was also the first time since the week ending February 20, 2026, that all three finished sharply higher together – a welcome sight after a tough stretch.
It wasn’t just the broader markets doing the heavy lifting. Nvidia (NASD: NVDA), the world’s most valuable company and the largest holding in Portfolios 1 and 3, had a strong week, gaining over 5%. At the same time, a clear pattern emerged across all three portfolios: most oil and energy stocks pulled back as talk of de-escalation in the Iran conflict weighed on crude prices.
Portfolio 1 had a solid week, gaining 4.5%. Along with strength from its largest holding, an impressive 80% of its positions ended the week higher. One standout was Decisive Dividend (TSE: DE), which jumped 11%.
Portfolio 2 lagged the other two but still delivered a respectable 3.6% gain. It also had the lowest percentage of winners, with 72% of holdings finishing in the green. A bright spot was Guardant Health (NASD: GH), which rose 10%. On the flip side, most of the declines came from energy stocks. A good example of how quickly investor sentiment can shift was South Bow (TSE: SOBO) – it hit a record high at the start of the week as oil climbed, only to reverse and finish lower as ceasefire hopes emerged.
Portfolio 3 was the top performer, gaining 5.1% and even outpacing the Nasdaq, the best-performing index of the week. Alongside gains from Nvidia, 80% of its holdings moved higher, including a 10% jump from Rocket Lab (NASD: RKLB).
After a rough month and quarter, this week was a much-needed turnaround. April is off to a more encouraging start – let’s hope it sets the tone for the weeks ahead. Looks like keeping my fingers crossed last week worked 😊… I’ll keep them crossed for next few weeks too. 😊
Companies on the Radar
 No new companies popped onto my investing radar this week, which gave me a chance to run last week’s newcomers through my Quick Test. I had expected Baker Hughes Company (NASD: BKR) to pass the filter, while Bentley Systems (NASD: BSY) and Nebius Group N.V. (NASD: NBIS) might be filtered out. Surprisingly, Baker Hughes scored just 66% – not terrible, but not impressive enough for a well-established company, and not strong enough to stay on my radar.
Nebius, a European artificial intelligence (AI) infrastructure provider, scored 52.2%. That’s on the low side, but not unexpected for a growth-stage company. They’re riding the AI wave, though that tailwind has gotten a bit choppy this year. Since I already have enough technology companies in my portfolios, I’m passing on this riskier opportunity for now.
Bentley Systems, on the other hand, caught my attention with a strong score of 86%. It has solid financial fundamentals, strong growth potential, and capable leadership – the founders still control nearly 48% of the company and hold significant board influence. The tricky part is the market’s concern about AI disruption. The question is whether Bentley is genuinely at risk or simply being swept up in the broader AI-related market turbulence.
With Baker Hughes and Nebius off the list, my radar is now down the 6 companies listed below:
- 5N Plus Inc. (TSX: VNP): a small-cap Canadian company that produces high-purity specialty metals and semiconductor materials used in space solar power, renewable energy, medical imaging, and electronics. Many of its products are mission-critical, requiring consistent quality and long-term supply. With exposure to space programs, clean energy, and strategic materials, 5N Plus operates in several niche but expanding markets where technical expertise creates competitive advantages.
- GE Aerospace (NYSE: GE): This is the large American aviation and defence business that remained after General Electric split into three separate companies in 2024. It has been on a strong run thanks to high demand for commercial jet engines as global air travel continues to recover. The company focuses on aircraft propulsion systems and services for both commercial and military customers, and it’s also moving into drones. As a global leader in jet engines and aircraft systems, GE Aerospace offers exposure to long-term trends in travel, defence spending, and emerging aviation technology.
- Broadcom (NASD: AVGO): A large cap American company that sells semiconductors and software globally. It designs critical chips used in data centres, networking equipment, and broadband infrastructure, playing a behind-the-scenes role in cloud computing and AI. Broadcom also owns a growing enterprise software business following its acquisition of VMware, giving it exposure to both hardware and software spending tied to AI and cloud growth.
- Xylem Inc. (NYSE: XYL): This is a large American company that develops water technology focused on moving, treating, and managing water. Its products and services are used by utilities, industrial customers, and municipalities for everything from clean drinking water and wastewater treatment to flood control and leak detection. With aging water infrastructure and more frequent climate challenges like droughts and flooding, demand for Xylem’s solutions is still strong. The business offers exposure to long-term, essential infrastructure spending tied to water scarcity, sustainability, and smarter cities.
- Enerflex Ltd. (TSE: EFX): a Calgary-based industrial company that provides engineered energy infrastructure and transition solutions for the global natural gas and power markets. Enerflex designs, manufactures, installs and services equipment and modular facilities – including gas compression, processing systems, power generation and treated water solutions – that are critical to natural gas midstream and industrial operations. With a global footprint and expertise spanning engineering, fabrication and after-market support, Enerflex operates in markets where reliable energy handling and infrastructure are essential, and where long-term contracts and technical integration create competitive advantages.
- Bentley Systems is an American software company that sits just above the mid-cap threshold (under US$10 billion market cap), leaving plenty of room for growth. They provide specialized software for professionals who design, build, and operate the world’s infrastructure. From bridges and roads to power plants and water networks, Bentley’s tools help engineers and architects model, manage, and maintain complex physical assets throughout their entire lifecycle.
As always, these are not buy recommendations. Make sure to do your own research and choose investments that fit your personal financial goals.
The Radar Check was last updated April 3, 2026.


That’s a wrap for this week, thanks for reading – may your portfolio stay green and your dividends steady. See you next time!