
Three Reports, One Story: Connecting the Economic Dots
This week gave us something we don’t often see – all three major US economic reports landed at once. Because of the recent partial government shutdown, the labour report, retail sales data, and CPI inflation numbers were released in the same week. Normally, these reports are spaced out, with jobs data arriving first and inflation and retail sales following mid-month. Seeing them together offers a rare opportunity to step back and view the American economy through three connected lenses at the same time.
Each report answers a different question.
The labour report, also know as the Employment Situation Summary (ESS) or more commonly as the monthly jobs report, tells us how strong the job market is. It shows how many jobs were added (or lost), what the unemployment rate is, and how quickly wages are growing. In simple terms: are people working, and are they getting paid more? A strong labour market generally supports consumer income and confidence.
The retail sales report shows how much consumers are actually spending. Since consumer spending makes up roughly 70% of US Gross Domestic Product (GDP), this report is a direct read on economic activity. It answers: Are people opening their wallets? Strong sales suggest demand is healthy. Weak sales suggest households may be pulling back.
The CPI inflation report measures how quickly prices are rising. It tracks the cost of everyday items like food, housing, transportation, and services. It answers: How much more are consumers paying? If inflation is rising quickly, purchasing power gets squeezed. If inflation is easing, households may feel some relief.
Individually, each report tells part of the story. Together, they show how the system is interacting.
If job growth is strong, spending is holding up, and inflation is cooling, that’s close to the “ideal” mix – people are working, spending, and price pressures are easing. Markets tend to respond favourably to that combination.
If jobs and spending remain strong but inflation heats up, the Fed may feel pressure to keep interest rates higher for longer.
If employment weakens and spending slows while inflation remains stubborn, that’s a more uncomfortable setup – growth is fading but price pressures haven’t fully eased.
When all three reports arrive in the same week, investors don’t have to speculate about which part of the economy is driving the narrative. They can see whether income (labour), behaviour (spending), and price pressures (inflation) are aligned – or starting to diverge. Instead of guessing where the economy might be heading, markets get a clearer read on whether it’s accelerating, cooling gradually, or slowing more sharply.
Putting all three reports together provides more perspective than we typically get in a single week and makes it easier to see what’s happening beneath the surface. Rather than viewing them in isolation, we get a coordinated snapshot of the health of the American economy.
Now that we understand how these three reports connect, let’s take a look at what the data revealed and how it affected the markets and my three portfolios.
Items that may only interest or educate me ….
Canadian Economic news, US Economic news, ….
Canadian Economic news
This past week’s key economic data that the Bank of Canada (BoC) considers when deciding whether to raise or lower the interest rate.
Canadian Market Volatility
Canada’s “fear gauge,” the VIXC (tracked by the VIXI), opened Monday at 16.51 and drifted toward the 15 level early in the week before climbing above 18 as concerns around artificial intelligence (AI) spending and disruption weighed on investor sentiment. On Friday, helped by a rise in commodity prices and renewed hopes that the Fed could lower rates twice in 2026, volatility had dropped off, with the index closing the week at 16.76.
Readings in the mid- to high teens suggest a pickup in caution rather than outright stress. While the rebound toward 18 midweek showed investors growing more defensive as AI-related concerns intensified, the pullback to 16.76 by Friday signals those fears moderated into the close. Rather than panic, the move reflects investors recalibrating – aware of risks but not anticipating immediate turmoil.
US Economic news
This past week’s key data points that the Federal Reserve (Fed) considers when deciding whether to raise or lower the interest rate.
Retail Sales
The Commerce Department’s Census Bureau reported that US retail sales were flat in December, a noticeable slowdown after November’s 0.6% increase and below expectations for a 0.4% gain. On a year-over-year basis, retail sales were still up 2.4%, but that marked a deceleration from the 3.3% pace seen a year earlier, pointing to cooling consumer spending as 2025 came to a close.
Looking closer, the picture was mixed. Month over month, building materials, garden equipment, and supply stores saw sales rise 1.2%, suggesting some resilience tied to housing and home-related spending. Meanwhile, furniture and home furnishing stores experienced the largest decline, with sales falling 0.9%. On an annual basis, miscellaneous store retailers posted strong growth of 9.4%, while furniture and home furnishing sales were down 5.6%, highlighting how consumers are becoming more selective, particularly with big-ticket purchases.
Core retail sales – which exclude autos, parts, and gasoline and offer a cleaner read on underlying demand – were also flat in December, slowing from November’s 0.5% gain and missing expectations for a modest increase. Year over year, core sales growth eased from 4.4% to 3.5%, reinforcing the idea that spending momentum is cooling rather than collapsing.
This latest report suggests consumer spending lost steam at the very end of 2025. That matters because consumer spending accounts for roughly 70% of US GDP, meaning even small shifts can ripple through the broader economy. With the holiday boost fading faster than expected, investors will be watching closely to see whether this softness carries into early 2026, especially alongside upcoming labour market and inflation data.
Employment Situation Summary (ESS)
The Bureau of Labor Statistics’ January Employment Situation Summary, commonly known as the monthly jobs report, surprised to the upside. The US added 130,000 jobs – nearly double the 70,000 economists were expecting and the strongest monthly gain in over a year. It was also a notable improvement from December’s 48,000 increase and a clear reversal from January 2025, when the economy lost 48,000 jobs.
The unemployment rate edged down to 4.3% from 4.4% in December, slightly better than expected. While still above the 4.0% rate seen a year ago, it suggests the labour market is still relatively tight.
Wage growth also picked up. Average hourly earnings rose 0.4% in January after being essentially flat in December. On a year-over-year basis, wage growth eased slightly to 3.7% from 3.8% last January. For households, steady wage gains matter – rising incomes help support consumer spending, which accounts for the majority of American economic activity.
Taken together, the data points to a labour market that is holding up well. Companies are hiring, unemployment remains relatively low, and wages are still growing. That’s generally positive for the broader economy because people with jobs and rising paychecks are more likely to spend.
The complication is monetary policy (read, interest rates). A firm jobs market can make the Fed more cautious about cutting interest rates. If hiring and wage growth remain strong, the Fed may worry that inflation pressures could persist. So while this is encouraging economic news, it may lessen the likelihood of near-term rate cuts.
The report also included an important revision to last year’s data. Total nonfarm employment for 2025 was revised down from a previously reported gain of 584,000 jobs to just 181,000. That sizable adjustment suggests the labour market was considerably weaker than originally believed. While January’s strong hiring shows renewed momentum, the broader trend through 2025 was much softer. For us investors, that context matters: the labour market may be improving now, but it is doing so from a weaker base than earlier data suggested.
Consumer Price Index (CPI)
The latest inflation report showed that price pressures in the US continued to ease at the start of the year. In January, consumer prices rose 0.2% from the previous month, slightly below expectations for a 0.3% increase. On an annual basis, inflation came in at 2.4%, down from 2.7% in December and the lowest reading since mid-2025.
Looking at the details, on a monthly basis transportation services posted the largest increase in January, rising 1.4%, while fuel oil prices – used for home heating – fell sharply, dropping 5.7%. On a year-over-year basis, gasoline prices were down 7.5%, helping pull the overall inflation rate lower. In contrast, utility gas service – natural gas delivered to homes – rose 9.8% over the past year, marking the largest annual increase among major components.
Shelter costs, which include rent and homeowner-related expenses and make up the largest portion of the index, increased 0.2% in January. On an annual basis, shelter inflation slowed to 3.0%, continuing its gradual moderation and helping ease overall inflation pressures.
Core inflation, which excludes food and energy and is closely watched by the Fed, rose 0.3% in January and 2.5% over the past year. That was in line with expectations and slightly lower than December’s annual reading of 2.6%.
This latest report shows inflation is moving in the right direction, but progress remains gradual. Prices are no longer rising as quickly as they were a year ago, yet inflation is still firm enough that the Fed is unlikely to rush into cutting interest rates – especially with the labour market remaining resilient. this suggests interest rates may stay higher for longer, even as inflation continues its slow return toward normal levels of 2.0%.
American Market Volatility
The CBOE Volatility Index (VIX), often called the market’s “fear gauge,” opened the week at 18.82 before drifting into the 17–18 range early on. Late in the week, it spiked above 20 on renewed concerns around AI disruption before closing the week at 20.60.
Think of the VIX as the market’s pulse. Readings above 20 generally signal rising caution, with investors becoming more sensitive to headlines and short-term risks. This week’s move above that level, and closing at 20.60, suggests uncertainty is no longer just intraday noise but beginning to linger. Concerns around AI disruption and interest rates are still in focus, and while markets are not showing signs of stress, risk awareness has clearly increased.
Weekly Market and Portfolio Review
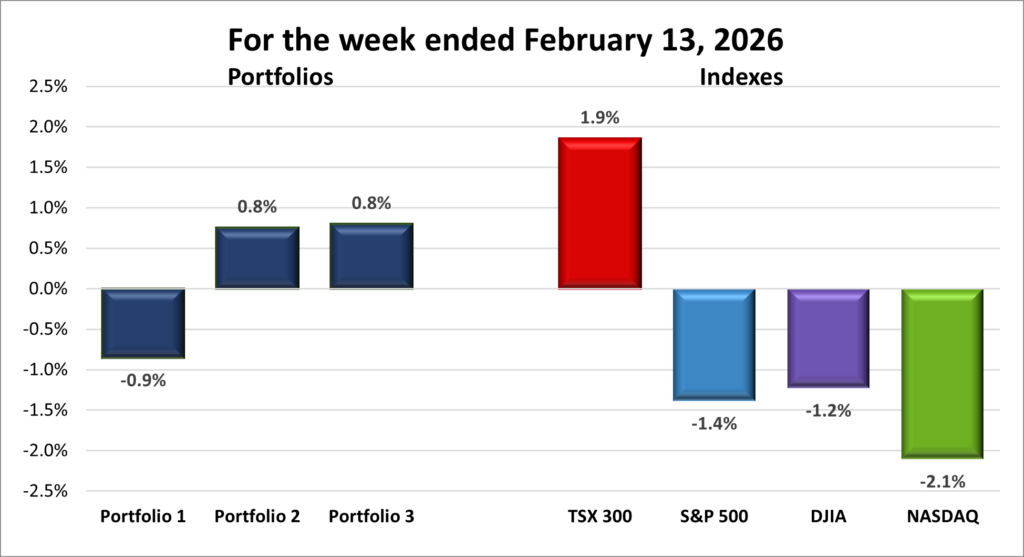
For the week, the TSX (SPTSX) gained 1.9%, the S&P 500 (SPX) dropped 1.4%, the DJIA (INDU) dipped 1.2% and the Nasdaq (CCMP) fell 2.1%.
| Index | Weekly Streak |
| TSX: | 2 – week winning streak |
| S&P: | 2 – week losing streak |
| DJIA: | 1 – week losing streak |
| Nasdaq: | 5 – week losing streak |
![]()
![]() Momentum from the previous week carried into this one, with technology stocks leading the advance as investors continued to rebound from the earlier AI-driven selloff the previous week. Early optimism lifted markets across the board. In Canada, the Toronto Stock Exchange Composite Index (TSX) notched its best single day in six months and followed that with a record high close the next session. In the US, the Dow Jones Industrial Average (DJIA) extended its streak of record closes to three straight days.
Momentum from the previous week carried into this one, with technology stocks leading the advance as investors continued to rebound from the earlier AI-driven selloff the previous week. Early optimism lifted markets across the board. In Canada, the Toronto Stock Exchange Composite Index (TSX) notched its best single day in six months and followed that with a record high close the next session. In the US, the Dow Jones Industrial Average (DJIA) extended its streak of record closes to three straight days.
But the rally didn’t last. By midweek, the S&P 500 Index (S&P), DJIA, and Nasdaq Composite Index (Nasdaq) all turned sharply lower, posting their biggest weekly losses since November 2025. Two main factors drove the reversal: renewed concerns about AI spending and disruption, and a heavy slate of economic data.
On the AI front, enthusiasm gave way to caution after Alphabet (NASD: GOOGL) announced a US$60 billion bond sale to finance roughly US$185 billion in planned AI infrastructure. While AI is still a powerful long-term growth theme, the sheer scale of that spending reignited questions about whether future profits will justify today’s costs. The more technology heavy Nasdaq and S&P were hit hardest, while the more industrial-heavy DJIA held up better as money rotated out of high-growth technology names into more traditional sectors.
Fears of AI disruption also grew. What began as pressure on software companies spread into financial services, trucking and logistics, and even real estate services, as investors reassessed which industries could see profits squeezed in an AI-driven world.
At the same time, economic data further buffeted the markets. Retail sales came in weaker than expected, suggesting consumers may be slowing their spending and prompting markets to briefly price in earlier rate cuts. That narrative shifted quickly after a much stronger-than-expected jobs report signaled the labour market remains resilient. Although revisions showed 2025 was one of the weakest hiring years since 2003, outside of a recession, conditions are still solid enough to give the Fed room to wait. Inflation continued to cool, but only gradually. Taken together, the data suggest the economy is moderating rather than stalling, leaving investors uncertain about when interest rates might move lower.
In Canada, the TSX followed a similar arc but managed to post its second straight weekly gain thanks to its heavy weighting in resources. Early strength was fueled by rising commodity prices, with gold climbing above US$5,000. By midweek, technology weakness weighed on the index, and it plunged Thursday in what appeared to be a spillover from the US technology selloff. Shopify (TSE: SHOP) fell more than 7% after its earnings release, as investors focused less on strong revenue and more on AI-related spending expected to pressure margins.
Adding to the cautious tone, investors were also digesting the latest US economic data. Together, the reports suggested a market navigating between optimism about growth and concern over interest rates and corporate margins.
By the end of the week, higher commodity prices and optimism over the prospects of an early Fed rate cut helped stabilize the TSX. Precious metals led a broad-based rebound as investors rotated back into resource-oriented and more traditional sectors following the technology-driven pullback.
Overall, the week marked a clear shift from optimism to caution. Excitement over AI’s long-term potential collided with concerns about capital intensity and industry disruption. Hopes for rate cuts ran into better than expected economic data, and investors rotated out of high-growth technology names and back into more traditional sectors, leaving markets to balance opportunity with risk.
| Portfolio | Weekly Streak |
| Portfolio 1: | 5 – week losing streak |
| Portfolio 2: | 2 – week winning streak |
| Portfolio 3: | 1 – week winning streak |
![]()
![]() Another week, another Thursday selloff. Concerns around AI disruption once again weighed on all three portfolios, particularly the technology-heavy Portfolios 1 and 3. One company caught in the crossfire was Nvidia (NASD: NVDA), which slipped 0.4% on the week. I expected both technology heavy portfolios to extend their losing streaks, so I was pleasantly surprised to see one of them snap the trend. 😊
Another week, another Thursday selloff. Concerns around AI disruption once again weighed on all three portfolios, particularly the technology-heavy Portfolios 1 and 3. One company caught in the crossfire was Nvidia (NASD: NVDA), which slipped 0.4% on the week. I expected both technology heavy portfolios to extend their losing streaks, so I was pleasantly surprised to see one of them snap the trend. 😊
Portfolio 1 had the toughest week of the three, declining 0.9%. Just under half of its holdings, 49%, finished higher. That said, there were some standout performers. Datadog (NASD: DDOG) jumped 13.7% after a strong earnings report, while Cloudflare Inc (NYSE: NET) gained 15%. Lattice Semiconductor (NASD: LSCC) and Trisura (TSE: TSU) both reached new highs, climbing 14% and 13%, respectively. Ferrari (NYSE: RACE) added 13%, CrowdStrike (NASD: CRWD) rose 10%, and Walmart (NASD: WMT) also set a new record. Strong individual gains helped cushion what could have been a steeper decline.
Portfolio 2 extended its win streak to two weeks, rising 0.8%. Winners and losers were evenly split, but a 15% gain from Mitek (NASD: MITK) provided a boost. Energy exposure also helped, with both South Bow (TSE: SOBO) and TC Energy (TSE: TRP) reaching record highs. That steady resource strength continues to provide balance when technology wobbles.
Portfolio 3 also gained 0.8%, narrowly edging out Portfolio 2 when carried beyond one decimal place. That’s impressive considering its two largest holdings (Nvidia and Shopify) finished slightly lower. Fortunately, 54% of the companies in the portfolio posted weekly gains. A 15% rise from Cloudflare and a 17% gain from Vertiv Holdings (NYSE: VRT), which climbed to a record high, made a significant difference. Vertiv initially surged 36% following its earnings report, which beat expectations and included stronger-than-expected guidance, before pulling back slightly to finish the week still solidly in the green. Another highlight was Brookfield Infrastructure Corporation (TSE: BIPC) reaching a new all-time high.
The week turned out better than expected. Volatility tied to AI headlines once again created short-term swings, but strong earnings and solid execution at the company level still drove results. Even in a choppy environment, there were plenty of new highs and meaningful gains across the portfolios. If some of the larger technology names – especially the Magnificent 7 holdings sprinkled throughout – can regain momentum, we may finally see all three portfolios post gains in the same week for the first time since early January. Fingers crossed. 😊
Companies on the Radar
 No new companies appeared on my radar this week, so I decided to take a second look at Corning (NYSE: GLW), which first landed on my radar back in mid-August. The shares still look just as overvalued today as they did then. I ultimately dropped Corning from my radar in mid-December, mainly because it didn’t score as highly on my Quick Test as I would have liked, and the valuation left little room for error.
Lately, though, Corning has reported double-digit growth in both sales and earnings in its most recent quarter. It also announced a multiyear agreement with Meta Platforms (NASD: META) worth up to about US$6 billion. Those developments have me reconsidering whether owning Corning means accepting a familiar trade-off: paying too much and taking on valuation risk, or waiting for a better price that may never come.
Great companies rarely look cheap. Becoming an owner often requires accepting a premium valuation rather than waiting for a perfect entry. That trade off is common for long-term investors.
The other question I’m wrestling with is where the greater risk really lies – paying a premium for a large, established company like Corning, or investing in a smaller name such Napco Security Technologies, Inc. (NASD: NSSC). That’s something I’ll be thinking through over the coming days. For now, Corning will be joining the other six companies listed below:
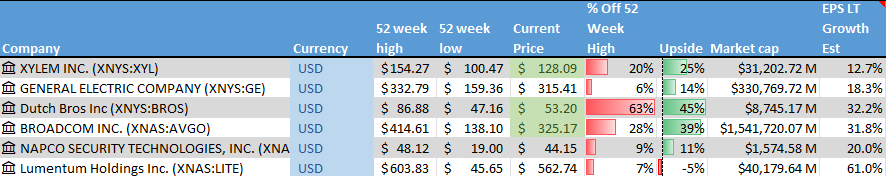
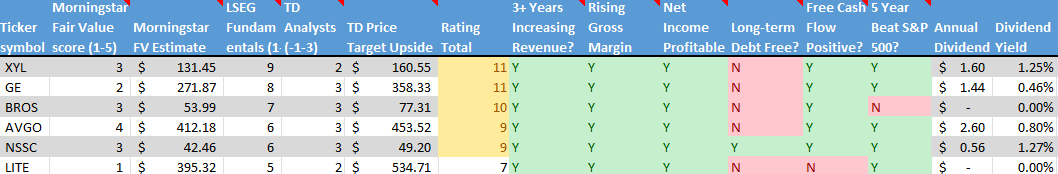
- Xylem Inc. (NYSE: XYL): This is a large American company that develops water technology focused on moving, treating, and managing water. Its products and services are used by utilities, industrial customers, and municipalities for everything from clean drinking water and wastewater treatment to flood control and leak detection. With aging water infrastructure and more frequent climate challenges like droughts and flooding, demand for Xylem’s solutions remains strong. The business offers exposure to long-term, essential infrastructure spending tied to water scarcity, sustainability, and smarter cities.
- GE Aerospace (NYSE: GE): This is the large American aviation and defence business that remained after General Electric split into three separate companies in 2024. It has been on a strong run thanks to high demand for commercial jet engines as global air travel continues to recover. The company focuses on aircraft propulsion systems and services for both commercial and military customers, and it’s also moving into drones. As a global leader in jet engines and aircraft systems, GE Aerospace offers exposure to long-term trends in travel, defence spending, and emerging aviation technology.
- Dutch Bros Inc. (NYSE: BROS): A rapidly expanding drive-thru coffee chain in the US, known for its energetic customer service and customizable drinks. The company is aiming to open at least 160 new locations by the end of 2025 and has long-term goals of surpassing 2,000 stores. Strong brand loyalty, especially in the Western US, makes this an interesting high-growth story – though still in an aggressive build-out phase.
- Broadcom (NASD: AVGO): A large cap American company that sells semiconductors and software globally. It designs critical chips used in data centres, networking equipment, and broadband infrastructure, playing a behind-the-scenes role in cloud computing and AI. Broadcom also owns a growing enterprise software business following its acquisition of VMware, giving it exposure to both hardware and software spending tied to AI and cloud growth.
- Napco Security Technologies, Inc.: A small US company that provides security hardware and systems like smart locks, intrusion alarms, fire alarms, and access control solutions. It sells through a network of distributors and installers, and has been increasing its recurring service revenue – something investors usually like to see. As demand for security and smart home products grows, Napco has multiple avenues for expansion.
- Lumentum Holdings (NASD: LITE): A large cap US-based optical technology company that makes key components used to move data at extremely high speeds across cloud and data-centre networks. Products like electro-absorption modulated lasers (EMLs) are seeing rising demand as AI workloads require faster and more efficient connections between servers. As large cloud providers continue ramping up AI infrastructure spending, Lumentum has emerged as a key beneficiary of this next wave of data and connectivity growth.
As always, these are not buy recommendations. Make sure to do your own research and choose investments that fit your personal financial goals.
The Radar Check was last updated February 13, 2026.
That’s a wrap for this week, thanks for reading – may your portfolio stay green and your dividends steady. See you next time!