Canadian Economic news, US Economic news, Fear gauges, Nvidia knocks it out of the park…
Canadian Economic news
Canada’s Retail Sales: What It Means for Interest Rates
Canada’s retail sales in June rose 0.1% from May, surpassing expectations of it remaining unchanged. While an increase in sales may sound like bad news for investors who are concerned about an interest rate hike, the increase was primarily driven by vehicle and vehicle parts sales. Excluding these sectors, core retail sales actually declined by 0.9% on a monthly basis.
On an annual basis, the picture is reversed, with total retail sales down 0.6% but core retail sales up 1.2%.
The Bank of Canada (BoC) will be closely monitoring retail sales in the coming months to assess the health of the economy and make decisions about interest rates. The June retail sales data is mixed, with total sales up, yet core sales down. This could be a sign that the economy is slowing down, which could lead the BoC to hold off on raising interest rates.
The combination of inflation unexpectedly higher in July, up 3.3%, lower employment numbers and this mixed retail sales report could be enough to tilt the odds towards the BoC maintaining the benchmark interest rate at 5.0%.
Canadian budget update
The Canadian finance ministry reported a budget surplus of C$ 3.62 billion for the first quarter (April through June) of the 2023-2024 fiscal year. That was well below the C$ 10.2 billion surplus posted in the same period last year. For the month of June, Canada had a surplus of C$ 2.11 billion, compared to a C$ 4.88 billion surplus a year ago.
Revenues were up thanks to money collected from income tax, higher interest rates, and higher Employment Insurance premium revenues. However, the increase in revenues was not enough to offset the rise in expenses which were higher due to increases in government program expenses, such as healthcare and social assistance. Higher interest rates also meant higher interest payments on government debt.
The budget surplus is the difference between government revenues (your tax dollars) and expenses (your tax dollars at work). A budget surplus means that the government is taking in more money than it is spending. A budget deficit means that the government is spending more money than it is taking in.
US Economic news
Consumer sentiment
The University of Michigan’s final consumer sentiment (CSI) results for August dropped slightly to 69.5 from 71.6 in July but above 58.2 recorded in the prior year. Analysts had been expecting 71.2.
This was the second highest reading in twenty-one months. The current reading is 39% above the all-time low set in June 2022 and the second highest since December 2021. The historic average is 86. Concerns about higher interest rates for longer and a slowdown in the drop of inflation slightly cooled consumer sentiment.
Fear gauges
Both the Canadian and American volatility indexes (VIX) are currently showing relatively stable levels, reflecting the market sentiment in each country. The Canadian VIX (VIXC) stands at 11.32, while the American VIX registers at 15.7. Both are on a scale of 0 to 100. VIX readings in the mid teens typically indicate a moderate level of investor confidence and a relatively stable market environment. When the VIX is in this range, it suggests that investors are not perceiving significant levels of near-term volatility or uncertainty in the market.
These indices are tools that can be used by investors to gain insights into market expectations over the next 30 days. The American VIX, often referred to as the ‘fear gauge’, gauges the expected volatility, rather than actual volatility, within the S&P 500 stock market index over the upcoming 30 days. While the Canadian VIX may not be as widely recognized as its American counterpart, it serves the same purpose in assessing the anticipated volatility in the S&P/TSX 60 stock market index. Both typically hover around 20. Below 20 indicates investor confidence in the market’s future performance. Conversely, readings above 20 signal heightened investor apprehension. Both the Canadian VIXC and the American VIX, fluctuate in real time, capturing market volatility as it evolves throughout the day.
Nvidia knocks it out of the park
Nvidia’s (NASD: NVDA) stock price has surged this year thanks to strong demand for its semiconductors, especially in the rapidly expanding artificial intelligence (AI) market where Nvidia is the dominant player. The company’s sales have been growing at an unprecedented rate. After their first quarter earnings report in May, Nvidia increased its sales forecast for the second quarter from US$ 7.2 billion to US$ 11 billion (an impressive 53% increase), which triggered an AI-focused rally throughout June and July.
Their second quarter earnings report was highly anticipated and influenced the markets even before Nvidia released its report. Leading up to the announcement, all four major North American indexes rallied, propelled by the expectations of Nvidia’s earnings. The surge in Nvidia’s performance also boosted other AI-oriented companies, sparking a rally in the stock market (although it turned out to be short lived).
In this latest report, Nvidia not only delivered on their May forecast, but they blew past the analysts’ estimate of US$ 11 billion in revenues, coming in at US$ 13.5 billon. This earnings report suggests that the growth caused by AI in the first quarter was not a momentary spike, but rather the start of a sustained period of growth for Nvidia’s AI offerings.
Following the announcement, Nvidia’s shares experienced a surge of over 9% in after-hours trading, reaching an all-time high of US$ 512 per share before retreating slightly. Much of Nvidia’s performance has been driven by the rapidly growing demand for its highly advanced processors required to train the latest artificial intelligence models such as OpenAI’s ChatGPT and Google’s (NASD: GOOGL) Bard.
This increase in share price propelled Nvidia’s market capitalization to an impressive US$ 1.27 trillion, solidifying its position as the leading semiconductor manufacturer in the world. With this latest earnings report and Nvidia’s third quarter forecast of US$ 16 billion in revenues, any lingering doubts about Nvidia’s supremacy in the emerging AI sector should be dispelled.
Finally, the company unveiled a US$ 25 billion stock buyback plan, adding to the share price’s upward momentum. Given the tremendous growth of the share price in 2023 already, it would be great if the shares are underpriced. 😊
Quite the earnings report, indeed! The AI market is still in its early stages, and Nvidia is the leading player in this growing market. I am very excited to be an owner of a fine company that is in the right industry and the right time. 😊
Finally! For the first time this month an overall positive week in the markets. Let’s see how that happened ….
Weekly Market Review
Monday: A rally in technology companies, outweighing concerns of higher interest rates, spurred a rebound in the Nasdaq Composite Index (Nasdaq) and the S&P 500 Index (S&P). On the losing side, lower oil prices dragged the Toronto Stock Exchange Composite Index (TSX) and the Dow Jones Industrial Average (DJIA) lower. China maintained it benchmark interest rate, passing on an opportunity to further stimulate their economy through lower interest rates. This caused analysts to lower expectations for growth in the world’s second largest economy. Lower growth would lead to lower demand for oil, causing oil prices to fall.
In Canada, in trading on the TSX, Technology and Basic Materials (miners and fertilizer manufacturers) were the only Canadian sectors to post gains, while Utilities and Financials had the steepest declines.
In the US, with today’s advance, the Nasdaq broke a four-day losing streak. Investors are also looking forward to Friday’s speech by Federal Reserve Chair Jerome Powell at an annual global gathering of central bankers. They are hoping for clues on the Fed’s path for interest rates for the rest of the year. Investors are also keenly awaiting Nvidia’s (NASD: NVDA) earnings report on Wednesday to see if the Nvidia led AI bull run still has legs. In trading, Technology and Consumer Cyclicals lead all gainers, while Utilities and Consumer Staples fell the furthest.
Tuesday: The Nasdaq was the only one of the four major North American indexes to end in the green, but just barely. The Nasdaq was pushed higher in anticipation of a strong earnings report from Nvidia tomorrow. The other three were weighed down by rising bond yields that are caused by the higher interest rates and expectations they will remain high for longer. With decent bond yields (4% and higher), investors are moving their money to less risky bonds.
In Canada, the TSX was weighed down by the financial sector where financial institutions are having to raise their bond rates to compete with safer government bonds. In the Canadian sectors, Basic Materials, Utilities, and Technology were the only sectors to advance, while Financials and Energy suffered the biggest losses.
In the US, credit ratings agency S&P Global joined fellow global credit agencies by lowering the credit rating of several US regional banks. The agency said funding risks and lower profits could push the limits of the financial sector’s strength. The lower credit rating will make it more costly for those banks to borrow money. In trading, Consumer Cyclicals, Utilities and Basic Materials were the only sector to end in the green. Among the sectors that declined, Financials and Energy dropped the most.
Wednesday: Finally, a day where all four indexes finished sharply higher. The Nasdaq and S&P were driven higher by a rally in Nvidia shares when the company easily beat analysts’ projections. Otherwise, investors are waiting to hear from Fed Chair Jerome Powell on Friday when he gives the keynote speech at a gathering of global bankers. Investors hope he will provide insight into when and how the Fed plans to end their battle with inflation.
In Canada, the TSX was led higher by a surge in the Canadian Technology sector, and solid gains in the Basic Materials sector. The Canadian Energy sector was the only sector to end in the red.
In the US, investors were betting a strong earnings report from Nvidia would prolong the AI inspired technology rally that has lifted the markets through most of 2023. In trading, the Technology and Financials sectors posted the largest gains, while the US Energy sector was the only sector to end lower.
Thursday: After a brief morning rally spurred by Nvidia’s blowout earnings report on Wednesday, all four indexes reversed course to end sharply lower. The markets’ decline began when a Fed official said it was “extremely likely” interest rates will need to remain high “for a substantial amount of time” to bring inflation down to their 2% target. Investors now await to see if Fed Chair Jerome Powell echoes those sentiments in his speech tomorrow.
In Canada, mixed results for two of Canada’s big six banks weighed on the TSX. In trading, the Telecommunications Services and Consumer Staples sectors were the only two sectors to advance, while Technology and Healthcare had the biggest drops.
In the US, the DJIA had its worst day since March despite the upward momentum from yesterday. In trading, all sectors ended lower today. Financials and Telecommunications Services fell the least while the interest sensitive sectors Technology and Consumer Staples suffered the largest declines.
Friday: All four indexes ended the day in the green, ending the week on a positive note. In today’s keynote speech, Fed Chair Powell delivered a balanced message, acknowledging inflation had come down but the Fed was still “prepared to raise rates further” to get it down to their 2% target. He said the Fed remains data driven but will proceed with caution. Investors took a glass half full approach to the news and pushed the markets higher. Oil prices rose, driven largely by a sharp increase in the price of diesel fuel caused concerns of a diesel shortage as refineries go into maintenance mode and the outbreak of a fire at a refinery.
In Canada, the TSX climbed on the higher oil prices, causing the Energy sector to be the best performer in the Canadian sectors, followed by the Technology sector. At the other end of the spectrum, Financials and Basic Materials were the only sectors to lose ground.
In the US, despite the possibility of another interest rate hike, the three American indexes all advanced. In trading, Consumer Cyclicals and Energy were the biggest gainers while Telecommunications Services was the only American sector to end lower.
Weekly Market and Portfolio Review
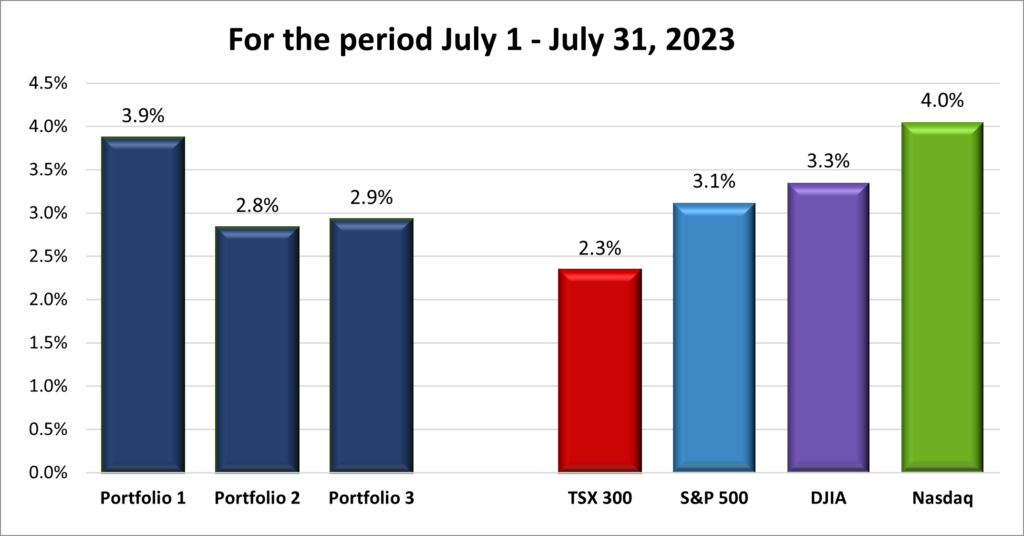
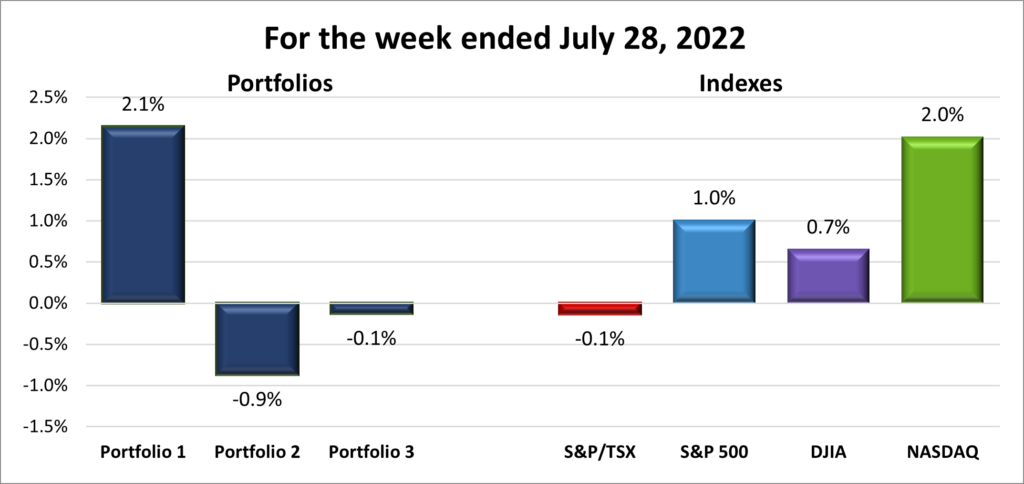
For the week, the TSX (SPTSX) inched up 0.1%, the S&P 500 (SPX) rose 0.8%, the DJIA (INDU) slipped 0.4% and the Nasdaq (CCMP) jumped 2.8%.
Looking at the chart above, it was not until Friday that it became clear three of the four major North American indexes would post a weekly gain. While the TSX’s increase was modest, a gain is always a positive sign. 😊 The week’s market movements were primarily driven by two key factors: Nvidia’s earnings report and statements from Fed.
You can see the midweek bump the Nvidia report provided all of the indexes. As the week progressed, investors’ focus shifted to Fed Chair Powell’s speech on Friday. Initially, there was a negative reaction when he suggested the possibility of higher interest rates. However, a closer examination of his speech revealed a reassuring aspect: the Fed’s commitment to a cautious approach. Powell stated that the Fed would “proceed carefully as we decide whether to tighten further or, instead, to hold the policy rate constant and await further data.” Essentially, this implies that if data continues to indicate declining inflation, they will stay the course.
This aspect of his speech caught the attention of investors, boosting the rate-sensitive Nasdaq and S&P indexes, and it also contributed to limiting the weekly losses in the DJIA. As for the TSX, higher oil prices and the potential that the Fed may not need to raise interest rates provided a boost to Canada’s main index, helping it over the line into positive territory.
Finally all three Portfolios were able to post a weekly gain in August, thanks to a strong week from American technology companies. As you can see in the chart below, Portfolio 1 had the biggest gains of all the portfolios and indexes, thanks to a 6.3% gain from Nvidia. Portfolio 2 rose on the strength of a good week from Microsoft (NASD: MSFT) and a few other companies. Aside from Disney (NYSE: DIS) which continues to struggle, no company in the portfolio experienced a sizable drop this past week. Portfolio 3 was lifted by Microsoft and Shopify (TSX: SHOP) but gains were limited by drops in its two Canadian bank stocks. Despite a strong week from the technology sector, Adyen (OTCM: ADYEY), the payment processor, continued last weeks slide.
Overall, a good week for the markets and the indexes. After a rough start to August its good to see all three portfolios post weekly gains.
Weekly Portfolio & Index performance for the week ended August 25, 2023.
Companies on the Radar
Medpace Holdings, Inc. (NASD: MEDP) and Snowflake, Inc. (NYSE: SNOW) have been dropped from the Radar List, but not forgotten. 😊
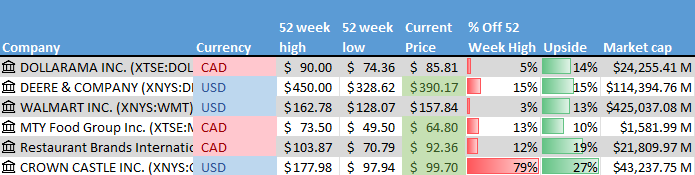
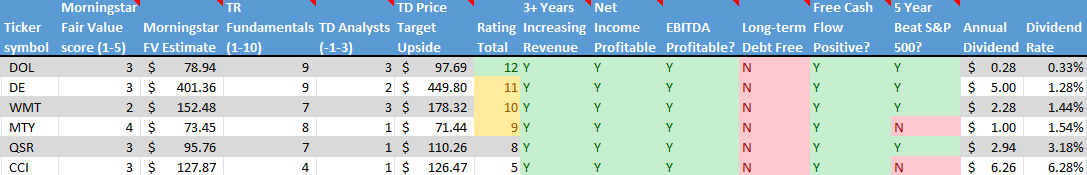
New to the list are Dollarama (TSX: DOL), a large Canadian company that operates dollar stores across Canada; Deere & Company (NYSE: DE), a large American company that manufactures and sell agricultural equipment worldwide; and Walmart (NYSE: WMT), a big American retail and wholesale company that operates globally. All are well-known companies, pay less than a 1.5% dividend and score well on the Radar Test, as seen in the tables below.
These companies will join the holdovers from last week:
MTY Food Group Inc. (TSE: MTY): A small cap Canadian consumer cyclical company that operates and franchises quick service and casual dining restaurants throughout North America and internationally.
Restaurant Brands International Inc. (TSE: QSR): A large cap Canadian consumer cyclical company that operates in the North American quick serve restaurant industry. The company owns Tim Horton’s, Burger King, and Popeye’s Louisiana Kitchen among others.
Crown Castle Inc. (NYSE: CCI), a large cap American company that owns and operates cell towers throughout America
The Radar Check was last updated August 25, 2023.
Portfolio Update
Portfolio 1
Portfolio 1 for the week ended August 25, 2023: UP
Tesla (NASD: TSLA) has lowered their output of electric vehicles (EV) at their German production facility to 4,350 vehicles. The company had hit a high of 5,000 EVs per week in March but has since slowed down and plans to slow production further.
Cloudflare (NASD: NET) partnered with SpaceX to improve the performance of SpaceX’s Starlink satellite internet service. The two companies are working together to increase the number of mini data centres around the world and to improve network speeds to end users.
Progeny (NASD: PGNY) announced that through their partnership with Amazon (NASD: AMZN), they have helped over 30,000 Amazon employees with their “family building journeys.” In 2019, Progeny partnered with Amazon to help Amazon employees with fertility benefits and family building.
Activity
Received interest on TD 1-year cashable GIC.
Dividends
Dividends Received this week for the following companies:
Companies followed by DRIP (Dividend Re-Investment Plan) indicate additional shares were purchased with the dividend. Any cash leftover was added to the cash balance.
Canadian $
Pulse Seismic Inc (TSX: PSD) Consisting of a regular quarterly dividend of $0.01375 per share and a special dividend of $0.15 per share.
TMX Group Ltd (TSX: X)
US $
No US$ dividends this past week.
Quarterly Reports
Nvidia Corporation
All currency listed in millions of US dollars, except for per share data.
Revenue of $20,935 for the three months ended June 30, compared to $10,782 for the same period in 2022. An increase of over 94%.
Net income of $2,889 for the three months ended June 30, compared to net income of $3,171 in the same period in 2022.
Diluted earnings per ordinary share of $1.57 for the three months ended June 30, compared to earnings of $1.75 per share for the same period in 2022.
Revenue of $58,298 for the nine months ended June 30, compared to $26,333 for the same period in 2021. An increase of over 121%.
Net earnings of $7,896 for the nine months ended June 30, compared to net earnings of $10,758 in the same period in 2021.
Diluted earnings per ordinary share of $4.11 for the nine months ended June 30, compared to earnings of $5.85 per share for the same period in 2021.
Portfolio 2
Portfolio 2 for the week ended August 25, 2023: UP
Microsoft announced that in order to get the approval of the British anti trust regulator for their acquisition of Activision Blizzard (NASD: ATVI), it would sell the non-European streaming rights of Activision games to French rival Ubisoft Entertainment.
Telus (TSX: T) announced they were making an initial donation of C$ 5 million, made up of cash donations and in-kind contributions. The money will go to local charities and organizations supporting relief efforts and first responders battling the wildfires in BC.
Activity
No significant activity to report this week.
Dividends
Dividends Received this week for the following companies:
Companies followed by DRIP (Dividend Re-Investment Plan) indicate additional shares were purchased with the dividend. Any cash leftover was added to the cash balance.
Canadian $
Dream Industrial Real Estate Investment Trust (TSX: DIR.UN) DRIP
US $
No US$ dividends this past week.
Quarterly Reports
No quarterly reports this past week.
Portfolio 3
Portfolio 3 for the week ended August 25, 2023: UP
Canada’s largest bank, the Royal Bank (TSX: RY) beat analysts’ earnings per share (EPS) estimates for the third quarter, however, the bank plans to reduce costs by up to 2% as it prepares for a slowing Canadian economy.
The news wasn’t so good for Canada’s second largest bank, the Toronto – Dominion Bank (TSX: TD) missed analysts’ EPS estimates due to higher expenses, a slowdown in the US side of its operations and the need to set aside more cash for unpaid loans.
Activity
No significant activity to report this week.
Dividends
Dividends Received this week for the following companies:
Companies followed by DRIP (Dividend Re-Investment Plan) indicate additional shares were purchased with the dividend. Any cash leftover was added to the cash balance.
No dividends this past week.
Quarterly Reports
Royal Bank of Canada
All currency listed in millions of Canadian dollars, except for per share data.
Canadian Economic news, US Economic news, Debt and Interest rates…
It was a slow week for US economic reports, so I decided to explain the reports I will be covering on a regular basis going forward, and why I chose them. If you are interested, please check out Key Economic Data in the Commentary section.
Now, on to our regularly scheduled items that may interest me ….
Canadian Economic news
Inflation news
Canada’s annual inflation rate for July, as measured by the Consumer Price Index (CPI), surged to 3.3%, up from 2.8% in June. This was higher than analysts’ expectations of 3.0%.
The CPI tracks the prices of a basket of goods and services that are commonly purchased by Canadians. The biggest increases in July were in the food component, which surged by 7.8%, and the health and personal care component, which climbed by 5.8%. Conversely, the gas subcomponent had the largest decline, plummeting 12.9%.
On a monthly basis, the CPI was up 0.6% in July, accelerating from June’s 0.1% increase. This was also higher than analysts’ expectations of 0.3%. The biggest increases were in the recreation, education and reading component, up 2.1%, and the fuel components, up 0.9%, while the biggest decrease was in the clothing component, down 1.0%.
The headline CPI, encompassing all components and providing a comprehensive view of overall inflation trends, beat expectations with a notable upswing. However, the core CPI, which excludes the food and energy segments, maintained a steadier trajectory, edging up by 3.4% on a yearly basis and an increase of 0.6% from June.
While the elevation in headline CPI might raise concerns, the Bank of Canada (BoC) will be pleased to see their preferred metric, core CPI, was essentially flat on a monthly basis. Analysts are split on whether the BoC will opt for another rate hike to drive down inflation faster or maintain the benchmark rate at its upcoming meeting in September. Either way, the BoC will be closely monitoring the data in the next few weeks to determine if they need to take action to keep inflation trending downward.
Industrial and raw materials price indexes
The Industrial Product Price Index (IPPI) and the Raw Materials Price Index (RMPI) provide a glimpse into the price movements of industrial products and raw materials, reflecting economic trends and dynamics that influence various sectors and industries. The IPPI data for July showed product prices rebounded by 0.4% from a prior drop of 0.6% in June. Looking at the broader picture, the annual trend reveals a decrease of 2.7% in prices. When energy and petroleum products are omitted from the IPPI calculation, the index remains unchanged from June, despite an annual increase of 0.5% in prices.
On a monthly basis, the lumber and other wood products, as well as energy and petroleum products, had the biggest price increases of the twenty one IPPI sectors. Conversely, chemicals and chemical products, along with primary ferrous metal products, had the largest monthly declines.
On an annual basis, the largest price gains were in sectors like cement, glass, and other non-metallic mineral products, as well as tobacco products. Conversely, energy and petroleum products, along with lumber and other wood products, suffered the largest annual price decreases.
Shifting to the Raw Materials Price Index (RMPI) for July, the prices for raw materials experienced growth of 3.5% in June, while dropping 11.1% compared on an annual basis. When energy products are removed from the RPMI calculation, prices recorded a monthly uptick of 1% and a yearly increase of 0.7%.
On a monthly basis, crude energy products increased the most of the seven RMPI sectors, while logs, pulpwood, natural rubber and other forestry products was the only sector to see a decline in prices.
Taking a broader view on an annual basis, the biggest increase was in the animals and animal products sector, while the crude energy products sector declined the most on a yearly basis.
US Economic news
FOMC minutes
During their most recent meeting in late July, the Federal Open Market Committee (FOMC) of the Federal Reserve (Fed) decided to increase the benchmark interest rate for the 11th time within a span of 17 months. This decision was aimed at getting inflation down to their target of 2%. The minutes of that meeting that were released this week reveal that the Fed remains concerned about persistently high inflation and recognizes the potential need for further interest rate hikes. However, they acknowledged some data suggested inflation was falling. This mixed view echoed Fed Chair Jerome Powell’s post meeting comments about future rate hikes.
Although the decision to raise the rate was unanimous among the FOMC’s eleven members, two nonvoting participants from the broader Fed expressed an opposing perspective. These participants argued for maintaining the existing rate rather than implementing an increase.
As the upcoming FOMC meeting approaches, the Fed’s members have displayed varying stances on whether to raise or maintain the current interest rate. Some are of the belief that the benchmark rate has reached a level that can effectively curb economic growth and bring inflation back to the targeted 2%. Conversely, others argue that an additional rate increase is imperative to sustain the ongoing trajectory of decreasing inflation. Regardless of the ultimate decision, the Fed’s choices will be based on the latest economic data and trends. Perhaps the most intriguing aspect of the upcoming meeting will be whether a unanimous decision can be reached on the path forward.
Debt and Interest rates
While reviewing CrowdStrike’s (NASD: CRWD) Form 10-K, I stumbled upon a strong argument against investing in heavily indebted companies. The statement I encountered highlighted the drawbacks of such debt-heavy companies:
“…requiring a portion of our cash flows to be dedicated to debt service payments instead of other purposes, thereby reducing the amount of cash flows available for working capital, capital expenditures, acquisitions and other general corporate purposes.”
When a company has significant debt obligations, a significant portion of its cash flow must be directed towards servicing these debts. This allocation can curtail the availability of funds for essential operational needs, growth initiatives, acquisitions, and other vital aspects of the business.
The statement also highlights the negative impact of rising interest rates on such companies. As interest rates increase, the cost of servicing debt also rises. This not only exacerbates the allocation of cash flows towards debt servicing but can also impede the growth prospects of a company. Elevated interest rates can result in a higher cost of capital, making it more challenging for growing companies to secure funding and pursue expansion opportunities.
I thought this statement was a great reminder of the potential risks associated with investing in companies burdened by significant debt in the current high interest environment. It underlines the importance of carefully evaluating a company’s debt position and financial health before deciding whether to become an owner of a business.
Now, let’s see what happened this past week….
Weekly Market Review
Monday: A good way to start the week for the three American indexes, not so great for the Toronto Stock Exchange Composite Index (TSX). Oil prices slipped as investors worried about lower demand coming out of China.
In Canada, commodity prices dropped on concerns of weak demand from China as the world’s second largest economy struggles with its economic recovery. Investors are waiting for the latest CPI report due later this week to get an idea what the BoC will do with the interest rate at their next meeting in September. In trading, Technology and Industrials were the only Canadian sectors to advance, while Basic Materials (miners and fertilizer manufacturers) and Telecommunications Services had the biggest setbacks.
In the US of A, after sliding for the last week or so, the mega cap technology companies, and technology companies in general, had their best day in a long time helping boost the Nasdaq Composite Index (Nasdaq) higher and the S&P 500 Index (S&P) into positive territory. The Dow Jones Industrial Average (DJIA) ended slightly above the breakeven point, carried by market sentiment. In trading, Technology and Healthcare were the top gainers while Utilities and Energy sank the most.
Tuesday: Weak economic data out of China sent all four indexes sharply lower as investors concerns grow about the world’s second largest economy. In response to their sputtering economy, China’s central bank lowered its key interest rates to jumpstart its economy. As one of the world’s largest consumers of raw materials and exporter of manufactured products, China’s problems can quickly become global problems. In contrast, the US continues to show resilience in retail sales with an increase of 0.7% in July over June, beating expectations of a 0.4% increase. The news out of China did not help oil prices either as investors worried about lower demand.
In Canada, the TSX had its biggest drop since October 2022 as the July CPI report came in higher than expected, sparking concerns the BoC will hike interest rates. All Canadian sectors declined with Consumer Cyclicals and Healthcare falling the least and Basic Materials and Energy falling the furthest.
In the US, the American indexes did not fall as hard as the TSX, but they fell just the same. The retail sales report was stronger than expected leading to speculation interest rates will remain high for longer. Investors are waiting for the release of the minutes from the last Fed’s last policy meeting in July when they raised the interest rate another 0.25%. Analysts will be looking for clues to indicate which way the Fed is leaning heading into their September meeting. Every American sector ended lower, with Healthcare and Telecommunications Services dropping the least and Energy and Basic Materials suffering the biggest declines.
Wednesday: When the best performing index ends flat, you know it has not been a great day. Minutes from the Fed’s last session revealed many members still felt there was upside risk to inflation and were divided on the need for an additional rate increase. With no clear direction on interest rates, fears they could go higher sent the American indexes lower and the TSX marginally lower.
In Canada, the TSX was in positive territory for most of the day before settling slightly below the breakeven bar. The economic slowdown in China continued to weigh on the resource/commodity oriented TSX. Today was good illustration of how dominant sectors can dictate the direction of the overall index. Seven of the ten sectors end higher, yet the TSX still ended in the red. In the Canadian sectors, Technology and Consumer Staples posted the biggest gains, however, the Basic Materials, Telecommunications Services, and Financials were the only sectors to end lower. Basic Materials and Financials account for 45% of the TSX.
In the USA, investors were not only concerned about the possibility of another rate increase but now they are also worried the Fed will hold the rates at the current or higher rate for longer. In the American sectors, only the defensive Utilities sector advanced, all other sectors posted losses with the interest sensitive Consumer Cyclicals and Technology posting the biggest losses.
Thursday: The week just keeps sliding lower as all four major North American indexes once again ended in negative territory. Analysts are now not only debating how high interest rates will go, but how long they will remain elevated. Oil prices rose after China implemented economic measures to stimulate their economy.
In Canada, the bad news is the TSX hit a six-week low. Worse news, September is historically the worst month of the year, so the skid is likely to continue for a while. On Bay Street, the Canadian Energy sector was the lone bright spot, ending in positive territory. Falling the furthest were the interest rate sensitive Technology and Consumer Cyclicals sectors.
In the US, the recent positive economic news has investors spooked that high interest rates will linger longer than originally expected, sending all three indexes lower. On Wall Street, Energy was the only American sector to advance. Consumer Cyclicals and Financials suffered the heaviest losses.
Friday: Stronger than expected US economic news led to a mixed day for the four indexes. The growth-oriented S&P and Nasdaq sank, while the TSX and DJIA advanced. Investors are concerned rates will need to remain high longer than originally anticipated to prevent inflation from reversing its decline and moving upward. Weaker than expected economic news out of China further weighed on the markets. Oil prices climbed on news of lower US production levels.
In Canada, the TSX barely made it into the green today, with higher oil prices overcoming declines in many of the other Canadian sectors. In trading, Utilities and Energy posted the largest gains, while Consumer Staples and Telecommunications Services had the biggest losses.
In the US, declines in the mega cap technology companies dragged the S&P and Nasdaq below the flatline, while the DJIA finished barely above it thanks to gains in the Energy sector. In trading, Energy and Consumer Staples advanced the most, while Consumer Cyclicals and Basic Materials had the biggest drops.
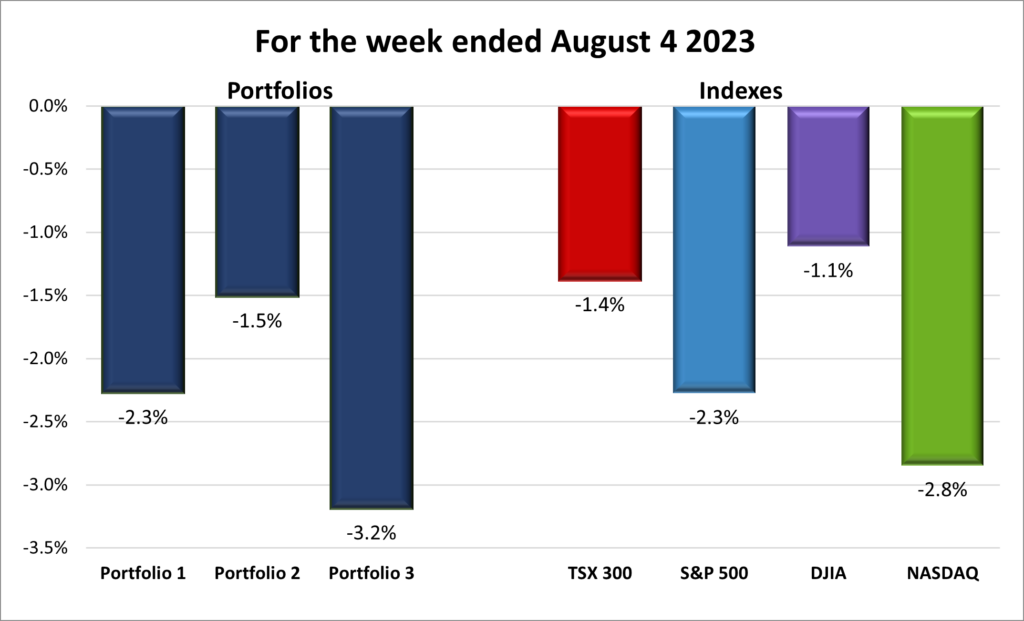
Weekly Market and Portfolio Review
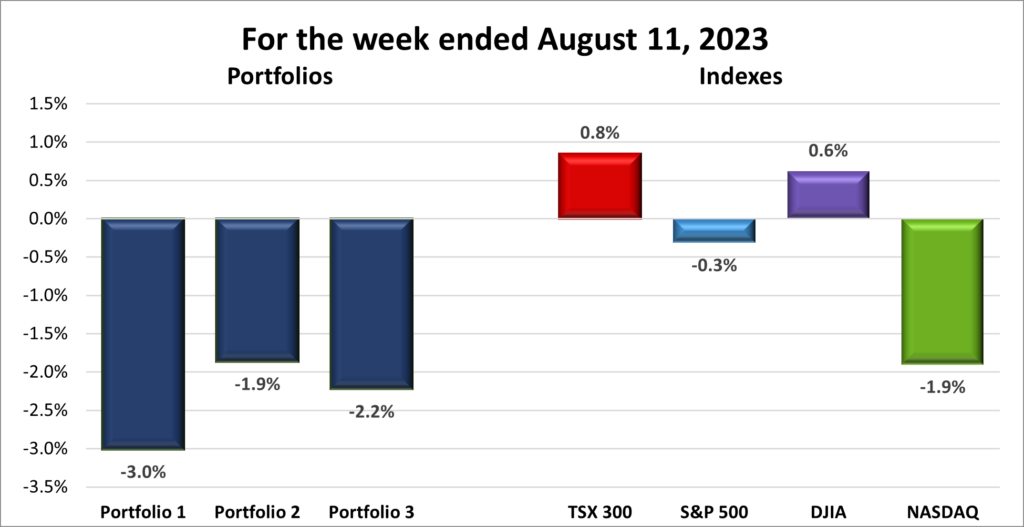
For the week, the TSX (SPTSX) fell 2.9%, the S&P 500 (SPX) declined 2.1%, the DJIA (INDU) sunk 2.2% and the Nasdaq (CCMP) dropped 2.6%.
The rapid shift in market sentiment over the past few weeks has been quite noticeable. What was a summer rally just three weeks ago now seems like a distant memory, as the markets continue to sink. The primary driver behind this shift appears to be the performance of the US economy, the world’s largest. Its persistent strength has raised concerns among investors that the Fed might not only implement another interest rate hike, but also maintain these elevated rates for an extended period.
The optimism that fueled the summer rally has now been replaced by a sense of caution and uncertainty. The concern over higher rates for longer has triggered an upward trajectory in US government bond yields, with 10-year yields inching closer to levels not seen since 2007.
Many investors, having reaped substantial gains in the Technology sector, have taken the opportunity to lock in profits and shifted their money from riskier stocks towards safer investments, like US government bonds. As yields on these risk-free bonds continue to rise, they become an even more attractive option for investors.
Conversely, on the global stage, the Chinese economy, the world’s second largest, is showing signs of a slowdown. The reduction in demand from Chinese consumers and industries, coupled with China’s role as a major supplier of manufactured goods, has raised concerns that this deceleration could potentially exert a drag on other economies. Consequently, many investors are reallocating their investments into safer assets such as …. US government bonds.
As evident from the above graph, the commodity heavy TSX index experienced the largest decline due to the impact of waning demand from China for raw materials. However, there was a silver lining as oil prices managed to edge higher, providing a boost to energy stocks and thereby limiting the overall decline of the index. Among the American sectors, all three major indexes saw declines of over 2%, with the Nasdaq, being particularly sensitive to interest rates, experiencing the biggest fall and its third straight weekly decline. The losses seen in the S&P and DJIA indexes were limited to some extent by gains in the Energy sector. However, the DJIA was additionally weighed down by declines in US bank stocks, a consequence of a credit rating agency suggesting possible credit rating downgrades for several US banks, including some of the larger, well-known ones.
It is like déjà vu all over again for the three Portfolios. While I mentioned this last week, the recurrence of losses over another week has me feeling like I have been transported back to 2022. Last year, the portfolios seemed to be in a constant state of downward drift, and as a result, I became somewhat desensitized to the weekly losses. This year, after the strong bull market performance during the initial seven months, I was optimistic the rally would persist, albeit not as strong as the first half of the year. Consequently, these three consecutive weeks of declines feels worse than last year. ☹
As illustrated in the chart below, Portfolio 1 stands out as the sole portfolio or index to achieve a weekly gain. Considering the overall market trend saw all indexes experiencing drops of over 2%, this unexpected development was certainly a pleasant surprise. The driving force behind Portfolio 1’s performance was Nvidia (NASD: NVDA), which surged by 10% over the week. Portfolios 2 and 3 were more of what I expected, dragged down by the overall markets. Portfolio 2 also felt the sting of drops in the financial sector which took a hit due to concerns surrounding higher interest rates. Lastly, Portfolio 3 faced the biggest losses of the week, largely stemming from Dutch financial payments company Adyen (OTCM: ADYEY) reporting earnings below expectations, leading to a 50% decline in its share price. Unfortunately, most companies faced declines throughout the week, and there was no company to offset the losses caused by Adyen.
Hopefully the losses experienced in the past week will present buying opportunities in the upcoming week and get the markets resuming their upward march. One can only hope for such an outcome, though I have a suspicion that we might be in for a few more weeks of declines. 😊
Weekly Portfolio & Index performance for the week ended August 18, 2023.
Companies on the Radar
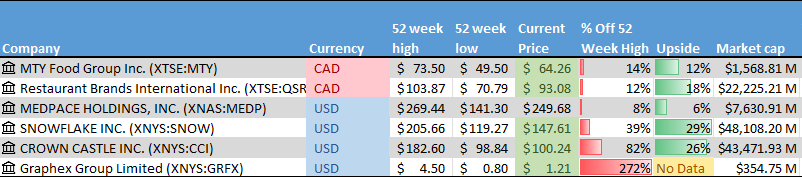
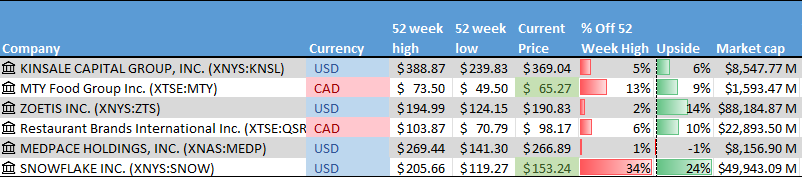
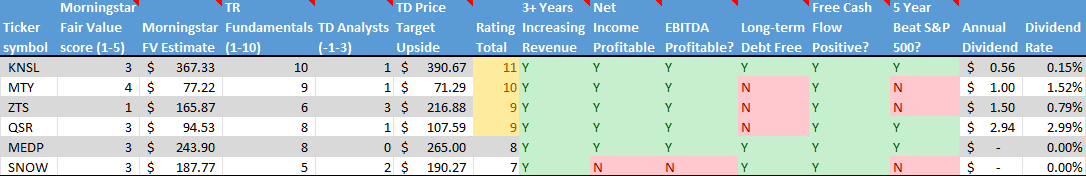
I removed Kinsale Capital Group, (NYSE: KNSL) and Zoetis Inc. (NYSE: ZTS) from my Radar List because both are in industries I am not that familiar with. This week I added Crown Castle Inc. (NYSE: CCI), a large cap American company that owns and operates cell towers throughout America, along with a fiber optic network supporting those towers. Given the ongoing expansion of mobile communications, Crown Castle sound interesting.
The other company joining the list is Graphex Group Limited (NYSE: GRFX). Headquartered in Hong Kong, Graphex Group is a micro cap company that specializes in the processing and sale of graphite and graphene products. My interest in this company was piqued by the growing demand for graphite in the production of lithium-ion battery anodes, which are needed for the batteries used in EVs. As you can see in the lower table below, when I ran it through my Radar Check it scored very poorly. Suffice to say, it will not be on my Radar List next week.
These companies will join the holdovers from last week:
MTY Food Group Inc. (TSE: MTY): A small cap Canadian consumer cyclical company that operates and franchises quick service and casual dining restaurants throughout North America and internationally.
Restaurant Brands International Inc. (TSE: QSR): A large cap Canadian consumer cyclical company that operates in the North American quick serve restaurant industry. The company owns Tim Horton’s, Burger King, and Popeye’s Louisiana Kitchen among others.
Medpace Holdings, Inc. (NASD: MEDP): A medium cap American healthcare company. The company provides clinical research-based drug and medical device development services to other healthcare companies in the development services.
Snowflake, Inc. (NYSE: SNOW): A large cap American technology company that provides a data cloud environment that enables customers to consolidate all their databases into a single source to enable better insights.
The Radar Check was last updated August 18, 2023.
Portfolio Update
Portfolio 1
Portfolio 1 for the week ended August 18, 2023: UP
Amazon (NASD: AMZN) met with three commissioners of the Federal Trade Commission (FTC) to determine if an anti trust lawsuit can be avoided.
Separately, Amazon Pharmacy will now automatically apply manufacturers’ discount to many insulin and diabetes medications. This will help consumers from trying to find discount coupons and manually entering them when ordering their medications. This should be a great help to consumers.
Tesla (NASD: TSLA) lowered prices in China for their Model Y electric vehicles (EV), lowering margins further. They also announced cheaper version of their Model S and Model X in the US. These latest American versions have shorter driving ranges than their pricier siblings, but Tesla hopes the lower prices will increase overall sales.
In a boost to Tesla, the state of Texas approved a mandate that all EV chargers include Tesla’s EV charging technology. Tesla is slowly becoming the North America charging standard.
ZIM Shipping (NYSE: ZIM) announced that in accordance with its dividend policy that payments will be made on a quarterly basis at a rate of approximately 30% of the net quarterly income, there will be no dividend to shareholders on account of the net loss it recoded for the second quarter. The only reason I have been holding onto ZIM was for the dividend. I will have to rethink that. ☹
Activity
No significant activity to report this week.
Dividends
Dividends Received this week for the following companies:
Companies followed by DRIP (Dividend Re-Investment Plan) indicate additional shares were purchased with the dividend. Any cash leftover was added to the cash balance.
Canadian $
Dream Industrial Real Estate Investment Trust (TSX: DIR.UN)
Revenue of $2,582 for the three months ended June 30, compared to $2,200 for the same period in 2022. An increase of over 17%.
Net loss of $17,364 for the three months ended June 30, compared to a net loss of $19,614 in the same period in 2022.
Diluted loss per ordinary share of $0.31 for the three months ended June 30, compared to a loss of $0.38 per share for the same period in 2022.
Revenue of $5,029 for the six months ended June 30, compared to $4,008 for the same period in 2022. An increase of over 25%.
Net loss of $29,125 for the six months ended June 30, compared to a net loss of $43,528 in the same period in 2022.
Diluted loss per ordinary share of $0.53 for the six months ended June 30, compared to a loss of $0.79 per share for the same period in 2022.
Portfolio 2
Portfolio 2 for the week ended August 18, 2023: DOWN
MongoDB (NASD: MDB) announced the general availability of their latest service – MongoDB Queryable Encryption. This technology provides built in protection for sensitive information when it is queried and in use in MongoDB. This capability is key for companies in data sensitive industries such as financial services, healthcare and government.
Mitek Systems (NASD: MITK) reported they received notice from the Nasdaq Stock Exchange that it was not in compliance with Nasdaq’s continued listing requirements for failing to file its Quarterly report for the quarter ended June 30, 2023. Mitek says they have addressed the issue and presented their plan to become fully compliant.
Activity
Bought SmartCentres Real Estate Investment Trust (TSX: SRU.UN): This is the 2nd purchase of SRU.UN. The initial purchase was made the first week in July for Portfolio 3. I considered adding more shares to the Dream Industrial REIT (TSX: DIR.UN) but wanted some REIT diversification in the portfolio.
The investment was made to generate income from the 7.4% dividend yield. As well, SRU has growth potential as SmartCentres is in the process of converting many of its retail mall properties into multi use town centres that includes rental apartments, condos, townhomes, seniors’ residences, self-storage, offices, retail outlets, hotels and industrial.
Dividends
Dividends Received this week for the following companies:
Companies followed by DRIP (Dividend Re-Investment Plan) indicate additional shares were purchased with the dividend. Any cash leftover was added to the cash balance.
No dividends this past week.
Quarterly Reports
No quarterly reports this past week.
Portfolio 3
Portfolio 3 for the week ended August 18, 2023: DOWN
News I do not like to hear, Dutch payments processor Adyen N.V., missed analysts’ first-half earnings estimates and got pummeled by the markets, falling 39% in one day. Ouch! ☹Adyen is Europe’s equivalent of PayPal (NASD: PYPL), a global payment processor providing back-end financial infrastructure for merchants.
Brookfield Reinsurance (TSX: BNRE) announced it will begin to offer holders of Class A Limited voting shares of Brookfield Corporation (TSX: BN) the opportunity to exchange up to 40 million BN shares for newly issued Brookfield Reinsurance shares on a one-for-one basis. Brookfield Reinsurance and Brookfield Corporation are considered a “paired entity”, which allows the offer to be structured so that the equity base and market capitalization of Brookfield Reinsurance can be enhanced without any dilution to Brookfield Corporation or Brookfield Reinsurance shareholders.
Activity
No significant activity to report this week.
Dividends
Dividends Received this week for the following companies:
Companies followed by DRIP (Dividend Re-Investment Plan) indicate additional shares were purchased with the dividend. Any cash leftover was added to the cash balance.
Canadian $
SmartCentres Real Estate Investment Trust (TSX: SRU.UN) DRIP
US $
No US$ dividends this past week.
Quarterly Reports
Adyen N.V.
All currency listed in thousands of Euros, except for per share data.
Note: Companies whose primary stock exchange resides in Europe, such as Adyen (AMS: ADYEN) on the Amsterdam Stock Exchange, report twice a year as opposed to quarterly as required on North American exchanges.
Revenue of €853,550 for the first half of 2023 ended June 30, compared to €3,947,481 for the same period in 2022. A decrease of over 78%.
Net income of €282,173 for the first half of 2023 ended June 30, compared to net income of €282,137 in the same period in 2022.
Diluted earnings per ordinary share of €9.07 for the first half of 2023 ended June 30, compared to earnings of €9.09 per share for the same period in 2022.
When I initially began reporting on Canadian and US economic news, I found myself overwhelmed by the sheer volume of inflation-related data. To streamline my coverage, I made the strategic decision to concentrate solely on the key indicators scrutinized by the Bank of Canada (BoC) and the US Federal Reserve (Fed). For additional information into these central banks, please refer to the “Central Banks” article.
The Fed oversees the management of the world’s largest economy, while the BoC is entrusted with overseeing Canada’s economy, the ninth largest globally. Both institutions share the common objective of maintaining inflation at a steady 2%. Achieving this target hinges largely on their ability to adjust their respective benchmark interest rate. The decision-making process for interest rates takes into account a variety of factors, including:
The current state of the economy (like inflation, economic growth, and employment)
Financial market conditions
Global economic trends
The essence of their task lies in achieving a delicate balance between encouraging economic growth and preventing runaway inflation. Although central banks like the BoC and the Fed deal with this data on a daily basis, as investors, we only have access to it on a monthly basis. Despite distinct reports for each country, they often share similar names. Here is a brief explanation of the data that central banks monitor, as well as the monthly reports that furnish this information.
To gauge inflation, central banks rely on two critical indicators: the Consumer Price Index (CPI) and the Core Personal Consumption Expenditures Price Index (Core PCE). The CPI tracks fluctuations in prices for various everyday items over time. The Core PCE operates similarly to the CPI, focusing on prices of goods and services, but omits volatile food and energy prices. This provides a clearer insight into underlying inflation patterns. An upward trend in the CPI or Core PCE suggests rising costs, which might necessitate higher interest rates to curb inflation and to encourage responsible spending and borrowing, thereby stabilizing prices.
Gross Domestic Product (GDP) is the key metric employed to gauge economic growth. It measures the overall economic activity within a country. Rapid economic expansion could trigger inflation, prompting central banks to consider raising rates in order to temper borrowing and spending.
Both central banks closely monitor employment data. In Canada, the BoC relies on various reports, with the Labour Force Survey (LFS) and the Job Vacancy and Wage Survey (JVWS) being primary sources. The LFS offers insights into employment, unemployment, and the broader labor market landscape. The JVWS sheds light on job vacancies and wage trends, aiding the BoC in understanding labor demand and market health.
Similarly, in the US, the Fed monitors various employment reports, including the Labor Department’s Job Openings and Labor Turnover Survey (JOLTS) and the Bureau of Labor Statistics’ Employment Situation Report (ESR). JOLTS provides data on job openings, hires, quits, and layoffs, providing a comprehensive view of labour market dynamics. The ESR encompasses average hourly earnings, average weekly earnings, and offers a comprehensive snapshot of employment and wage trends in the US.
Both central banks also track several market sentiment indices. In the US, these include the VIX, CCI, and the CSI. The VIX measures market volatility, the CCI assesses investor confidence, and the CSI gauges investor sentiment. For further clarification on these, kindly refer to the respective links.
In Canada, the equivalents are the “VIXC” (CBOE Volatility Index for Canadian Stocks), which gauges market expectations of near-term volatility in Canadian stocks. While the term “CCI” is not commonly used in Canada, similar insights can be gathered from sources such as the “Canadian Confidence Index” released by Bloomberg/Nanos. Additionally, the Conference Board of Canada releases the “Index of Consumer Confidence,” reflecting consumer sentiment based on diverse economic factors and surveys.
Obviously, there are other reports and data they both follow as well as other factors such as global financial markets, and global economic conditions. None of these factors are taken in isolation. The BoC and the Fed look at the bigger picture to make informed decisions that support the overall health of their respective economies. It’s like putting together a puzzle with lots of different pieces!
Going forward, I will cover the economic reports and sentiment indexes that I have already mentioned. The reports are from government agencies while the sentiment indexes are provided by independent third parties. The reports and sentiment indexes are published monthly, while the volatility indexes are updated daily. I may throw in other information occasionally if it impacts the markets.
Navigating the world of investing can feel overwhelming (kind of like being on a paddleboard in the fog, with no idea where you are going 😊) , especially when it comes to sifting through financial and economic information. You must figure out what information truly matters to you and what’s merely noise.
If you are someone who thrives on data and analysis, you might feel that the more information, the better (and there is certainly no shortage of data available). On the flip side, some find financial details monotonous and boring – they would rather not bother with what might seem like a tsunami of data. Most individuals, however, fall somewhere in between these two viewpoints.
The key takeaway here is to determine what financial and economic information is relevant to you. This will help you avoid the sensation of being inundated by a constant stream of information.
In my case, I have found that this handful of basic economic indicators provides valuable insights into the Canadian and American economies. This understanding proves essential for making sense of market shifts and comprehending why central banks make the decisions they do. For me, the surplus of other economic data is just background noise. Afterall, I am only worried about my three portfolios, not the economy of a nation. 😊
Let me know what economic data you follow in the comment section below.
Canadian Economic news, US Economic news, World’s second largest economy stumbles, Robotaxis move among us, …
While my initial intention was to primarily focus on the Canadian and American economies, it’s important to recognize that the global economic landscape is interconnected. Recent turbulence in the world’s second-largest economy, China, has the potential to reverberate and impact both Canada and the US. When China, a major economic player, faces challenges, it can trigger a cascade of effects that extend beyond its borders.
The reduced demand from Chinese consumers can directly influence Canadian and American products, leading to decreased exports. Considering China’s significant role as the world’s largest exporter, any slowdown in its manufacturing sector could trigger supply chain disruptions, contributing to price hikes and potentially fueling inflation. This interconnectedness is why I expanded my coverage this week to include updates on three economies, rather than just the Canadian and American ones.
Understanding these global economic dynamics is crucial for us as investors. Grasping the bigger picture in which economic events unfold is essential to comprehend the influence they can have on investment decisions and overall financial outcomes. Next week, I will return to our regular focus on the Canadian and American economies.
Canadian Economic news
In June, Canada recorded a substantial international trade deficit, widening the shortfall to C$3.73 billion. This deficit marks the largest since October 2020 and exceeded analysts’ projections of a C$2.9 billion deficit.
The combination of inflation pressures and diminished global demand contributed to a monthly decline of 2.2% in exports, following a 3.0% drop in May. Among the eleven subsectors, nine registered lower figures, with the Metal and Non-Metallic Mineral Products subsector witnessing the most significant decrease. Aircraft components and consumer goods were the only subsectors to report increases. Looking at the yearly perspective, exports experienced a 12.3% decrease, with six of the subsectors posting declines. Exports were dragged lower by energy products, while the Motor Vehicles and Parts subsector posted the biggest gain.
Turning to imports, there was a 0.5% decrease from May and a 2.2% decline on a yearly basis. In the month-to-month assessment, seven of the eleven subsectors displayed lower figures. Energy products witnessed the most substantial decline, whereas Metal and Non-Metallic Mineral Products experienced the largest increase. A similar pattern emerged on an annual basis, with energy products demonstrating the most significant decline, and Metal and Non-Metallic Mineral Products recording the largest increase.
US Economic news
Inflation
The Consumer Price Index (CPI) data for July revealed inflation slowing, but still above the Federal Reserve’s (Fed) target of 2%. On a monthly basis, consumer prices climbed 0.2%, mirroring the 0.2% uptick observed in June. On an annual basis, CPI surged 3.2%, marking the first annual increase in over a year. While this surpassed June’s 3.0% increase, it fell short of analysts’ predictions of a 3.3% rise.
The Fed’s preferred measure of inflation, core CPI, which excludes food and energy prices, also rose 0.2% in July. On an annual basis, Core CPI increased 4.7%, the smallest increase since October 2021. The increase was slightly lower than June’s 4.8% and once again lower than analysts anticipated 4.8%. However, core inflation is still above 4%, which is well above the Fed’s target.
On a yearly basis, shelter, which includes mortgages, rent, utilities and other housing related expenses, was by far the largest contributor to the monthly rise in prices, accounting for over 90% of the total increase. The biggest decline was in energy commodities such as gasoline.
Despite the deceleration in inflation, the rate remains higher than the Fed’s goal of 2% and the current rate is slightly higher than a year ago. Typically, when inflation falls, the unemployment rate rises. However, that has not been the case as the labor market remains “very tight.” As long as there are more jobs available than people looking for work, wages will continue to rise, which will put upward pressure on prices.
On one hand, falling inflation would suggest that the Fed does not need to raise the benchmark interest rate further. However, a look beyond the headline CPI number at the core CPI shows that core inflation remains high. Combined with a tight labor market, this suggests that the Fed may lean towards another interest rate increase in September to drive down core CPI.
Overall, the July CPI data suggests that inflation is still a problem, but it is starting to slow. Analysts are predicting the Fed will maintain the current interest rate of 5.5% at their next meeting in September. However, those same analysts are split over what the Fed will do at following sessions. The Fed itself has suggested another increase may be necessary to further cool inflation, but they will follow the data.
Consumer Sentiment
The University of Michigan’s Consumer Sentiment Index for August presented an initial reading of 71.2, showing a slight decline from July’s reading of 71.6. On a monthly basis, consumer sentiment decreased by 0.6% compared to July. However, there was a sizable 22.3% increase on an annual basis and a significant rise of nearly 42% from the all-time low recorded in June 2022. To throw water on the better-than-expected CSI, the Fed signaled that doesn’t mean they are finished with interest rate increases.
World’s second largest economy stumbles
Data has revealed a significant decline in China’s imports for July, marking a 12.4% drop compared to the same period a year ago. This decline exceeded analysts’ expectations of a 5% decrease. This contraction represents the most substantial drop since the country’s shutdown in January 2020 during the initial Covid-19 outbreak. Simultaneously, exports also experienced a decline of 14.5%, surpassing the anticipated 12.5% decrease. This rapid decline in exports is the sharpest since the onset of the Covid-19 pandemic. The combination of reduced domestic consumption and weakened global demand for Chinese goods has created mounting pressure on the government to introduce new stimulus measures aimed at reviving demand.
The ramifications of this weakened demand have translated into sluggish growth for the world’s second-largest economy. Consequently, concerns have arisen that China might be embarking on an extended period of slow economic growth. The anticipated economic rebound following the country’s emergence from its Covid-19-induced shutdown has yet to materialize, leaving analysts apprehensive about the prospect of a lackluster Chinese economy failing to contribute to an upswing in global demand or bolster commodity prices.
Robotaxis moves among us
Alphabet’s (NASD: GOOGL) Waymo and General Motors’ (NYSE: GM) Cruise have received permission from California regulators to operate their robotaxis 24/7 in San Francisco. This is a historic milestone for the development of autonomous vehicles, and it will be interesting to see how these services are received by the public.
Both companies currently operate 300 or fewer robotaxis in San Francisco, but they are expected to deploy more vehicles in the coming months. It is also unclear how much these robotaxis will cost to ride, compared to traditional taxis. However, one thing is for sure: all eyes will be on San Francisco to see how robotaxis impact consumers and traffic safety.
Now that we have covered three economy and the rise of robotaxis, let’s see what happened this past week….
Weekly Market Review
Monday: A Fed official said she still believed higher interest rates are necessary to get US inflation back to their 2% target. Another Fed member said he felt interest rates could begin to fall in early 2024. Investors chose to focus on the later, sending the markets higher.
In Canada, the Canadian markets were closed for a Civic Holiday.
In the US, the Nasdaq Composite Index (Nasdaq) and the S&P 500 Index (S&P) snapped their four day losing streaks, joining and the Dow Jones Industrial Average (DJIA) in positive territory. In trading, all sectors ended higher, led by Industrials and Consumer Cyclicals with Utilities and Energy bringing up the rear.
Tuesday: The markets ended lower on concerns of weak economic data from China suggesting the country’s recovery is weaker than expected. In morning trading all four indexes dropped sharply but slowly recovered to pare losses by the end of the day.
In Canada, the news about China’s economy dragged the resource heavy Toronto Stock Exchange Composite Index (TSX) down sharply in the morning but the TSX was able to recover much of those losses by the end of the day. In the Canadian sectors, the Energy and Consumer Staples sectors were the only sectors to advance, while Technology and Consumer Cyclicals decreased the most.
In the US, ten small and mid size US regional banks had their credit ratings downgraded by Moody’s (one of the three global credit ratings agencies). Moody’s also warned it could lower credit ratings for a few of the biggest American banks, sparking a wave of concern about the American financial system. In the American sectors, Healthcare and Energy posted the biggest gains while Financials (where banks reside) and Technology had the biggest declines.
Wednesday: Mixed results today, with the TSX advancing and the American indexes stumbling. Investors are waiting for tomorrow’s US inflation report to get a sense of which way the markets will move and what it means for the Fed’s battle with inflation. Weighing on the markets was news China’s consumer sector fell into deflation in July, sparking concerns China’s economic struggles could have global repercussions. Oil prices jumped on news of a sharp drawdown in US oil reserves.
In Canada, higher oil prices lifted the energy sector which in turn lifted the resource heavy TSX. In trading, Telecommunications Services and Utilities were the big winners, while Consumer Cyclicals and Healthcare were the big losers on the day.
In the USA, concerns flared up over the US banking system after yesterday’s credit rating downgrades of ten mid size banks, weighing on the financial sector. At the consumer level, credit card borrowing hit a record high, possibly keeping inflation above the 2% target. In the American sectors, Energy and Telecommunications Services led all sectors, with Technology and Consumer Cyclicals suffering the biggest declines.
Thursday: All four indexes ended the day slightly higher following the latest US inflation report that showed inflation was up for July but less than feared. Investors are now concerned about the long-term prospects for the world’s largest economy in the US if interest rates stay elevated for an extended period.
In Canada, the TSX tracked the American indexes for most of the day until the end when it zigged up while the American indexes zagged down. In trading on Bay Street, Technology and Telecommunications Services had the biggest upwards moves, while Consumer Cyclicals and Basic Materials (miners and fertilizer manufacturers) had the biggest downwards moves.
In the US, after an impressive opening the indexes surrendered most of their early gains to end the day essentially flat. As analysts and investors took a deeper look at the latest inflation report, they saw core inflation remained high at 4.7%, more than twice the Fed’s target of 2%. in trading on Wall Street, Telecommunications Services and Consumer Cyclicals led the gainers, while Utilities and Basic Materials declined the most.
Friday: A mixed bag for the indexes with the value-oriented indexes, the TSX and DJIA, ending higher, while the growth-oriented Nasdaq and S&P both ended lower. All four indexes bounced around throughout the day.
In Canada, higher gold and oil prices drove the resource heavy TSX upward. As a result, the Basic Materials and Energy sectors advanced the most of the Canadian sectors. Not so lucky were the Consumer Cyclicals and Utilities sectors which suffered the biggest declines.
In the US, stronger than expected Producer Price Index (PPI) data raised concerns of creeping inflation and another rate hike. The fears of another rate hike tripped up the rate sensitive technology sector. Consequently, the Technology sector dropped the most, followed by the other interest rate sensitive sector, Consumer Cyclicals. Posting the biggest daily gains were Energy and Utilities.
Weekly Market and Portfolio Review
For the week, the TSX (SPTSX) advanced 0.8%, the S&P 500 (SPX) fell 0.3%, the DJIA (INDU) gained 0.6% and the Nasdaq (CCMP) sank 1.9%.
It was a week of mixed outcomes for the indexes, with the value-oriented TSX and DJIA managing to end the week on a positive note, while the growth-focused S&P and Nasdaq declined. After a bullish run through June and July, the beginning of August has proven to be more challenging. The S&P and the Nasdaq recorded their second consecutive weekly losses, marking the first time in 2023 where the Nasdaq saw back-to-back weekly declines.
Several factors contributed to the week’s performance. Concerns about China’s slower economic growth, credit rating downgrades for ten midsize American banks, statements from the Federal Reserve about the possibility of higher interest rates, and mixed inflation data all played roles in shaping the market’s direction. The combination of elevated interest rates and investors taking profits from a strong July collectively drove the S&P and Nasdaq down.
On a positive note, the TSX and DJIA managed to rise, propelled by the upward climb of gold and oil prices. Oil prices achieved their longest streak of weekly gains since early 2022. This was the result of record demand in June, coupled with production cutbacks by key suppliers Saudi Arabia and Russia. Moreover, the International Energy Agency’s (IEA) projection of sustained high demand and a tightening supply landscape in the upcoming months also bolstered oil prices.
So far, I am not liking August. This is the second week in a row all three portfolios have lost more than 1% or more of their value. Its starting to feel like 2022 all over again. ☹ This week is worse than last week as Portfolios 1 and 3 fell more than the Nasdaq, the worst performer of the indexes. Portfolio 2 did not fair much better, dropping as much as the Nasdaq.
The mega cap technology companies that had lifted the portfolios for most of the year declined as investors took profits and concerns of higher interest rates weighed on the markets in general, and the interest rate sensitive technology companies in particular. Portfolio 1 was also stung by a bad week for semiconductor companies, two weeks after I added two chip companies to the portfolio. ☹ To paraphrase Marvin the Martian, not a good week, not a good week indeed!
Weekly Portfolio & Index performance for the week ended August 11, 2023.
Companies on the Radar
After clearing off my radar list last week, six new companies appeared on it this past week. A variety of Canadian and American companies in several different sectors. All sound interesting and have done well in the past. All have been growing their business and their share prices. Once the second quarter earnings season ends, I should have some time to take a closer look at these companies listed below.
Kinsale Capital Group, (NYSE: KNSL): A medium cap American financial services company. They provide specialty insurance in the US.
MTY Food Group Inc. (TSE: MTY): A small cap Canadian consumer cyclical company that operates and franchises quick service and casual dining restaurants throughout North America and internationally.
Zoetis Inc. (NYSE: ZTS): A large cap American healthcare company, focused on animal health medicines and devices.
Restaurant Brands International Inc. (TSE: QSR): A large cap Canadian consumer cyclical company that operates in the North American quick serve restaurant industry. The company owns Tim Horton’s, Burger King, and Popeye’s Louisiana Kitchen among others.
Medpace Holdings, Inc. (NASD: MEDP): A medium cap American healthcare company. The company provides clinical research-based drug and medical device development services to other healthcare companies in the development services.
Snowflake, Inc. (NYSE: SNOW): A large cap American technology company that provides a data cloud environment that enables customers to consolidate all their databases into a single source to enable better insights.
The Radar Check was last updated August 11, 2023.
Portfolio Update
Portfolio 1
Portfolio 1 for the week ended August 11, 2023: DOWN
Progyny (NASD: PGNY) said it will be expanding its managed reproductive health network to include providers of menopause care. The service will be available in all 50 states.
PayPal (NASD: PYPL) became the first major financial technology to launch a US dollar stablecoin for payments and transfers. This could provide a major boost to the slow adoption of digital tokens for payments. It will be interesting how this is received by the Fed and Securities and Exchange Commission. Stablecoins are crypto tokens whose monetary value is pegged to a stable asset, such as the US dollar, to protect from wild volatility.
Berkshire Hathaway (NYSE: BRK.B) posted its highest ever quarterly operating profit, with a nearly $36 billion overall profit. Not bad! 😊
Nvidia (NASD: NVDA) announced the latest version of their Grace Hopper superchip. The chip is a combination of Nvidia’s powerful H100 graphics processing units (GPU) with an Nvidia designed central processor. This version is designed to provide a boost to generative artificial intelligence (AI) applications.
Algonquin Power & Utilities Corp. (TSX: AQN) announced they will pursue a sale of their Renewable Energy Group, leaving Algonquin as a regulated utility with diversified assets in several regions.
The National Highway Traffic Safety Administration (NHTSA) will take a closer look at a recent fatal accident involving a Tesla (NASD: TSLA) electric vehicle (EV). The Model Y is suspected of being driven by Tesla’s advanced driver assistance system when it struck the side of a tractor trailer as the semi trailer was turning onto the highway. The NHTSA has started more than three dozen investigations over the last few years into Tesla involved accidents where their driver assistance system has been involved.
Amazon (NASD: AMZN) has decided to eliminate 27 of its 30 private clothing brands as it attempts to cut costs and avoid the crosshairs of the US Federal Trade Commission (FTC).
Activity
Liberty Media’s Formula 1 tracking (NASD: FWONK) spun out its Liberty Live Group unit. The new public company, Liberty Live, owns and operates a live entertainment company. The new company trades under the ticker (NASD: LLYVK).
Dividends
Dividends Received this week for the following companies:
Companies followed by DRIP (Dividend Re-Investment Plan) indicate additional shares were purchased with the dividend. Any cash leftover was added to the cash balance.
No dividends this past week.
Quarterly Reports
Berkshire Hathaway Inc.
All currency listed in millions of US dollars, except for per share data.
Revenue of $664,420 for the three months ended June 30, compared to $464,643 for the same period in 2022. An increase of almost 43%.
Net income of $26,807 for the three months ended June 30, compared to net income of $20,943 in the same period in 2022.
Diluted earnings per ordinary share of $0.57 for the three months ended June 30, compared to earnings of $0.50 per share for the same period in 2022.
Revenue of $1,303,520 for the six months ended June 30, compared to $868,312 for the same period in 2022. An increase of over 50%.
Net earnings of $40,783 for the six months ended June 30, compared to net earnings of $44,281 in the same period in 2022.
Diluted earnings per ordinary share of $0.87 for the six months ended June 30, compared to earnings of $1.05 per share for the same period in 2022.
Portfolio 2
Portfolio 2 for the week ended August 11, 2023: DOWN
It appears Microsoft (NASD: MSFT) will get Activision (NASD: ATVI) after all. The US FTC withdrew their case against the two companies, clearing the way for the acquisition to proceed.
Separately, the US Department of Homeland Security’s Cyber Safety Review Board will investigate a recent breach of Microsoft’s security software that resulted in the theft of emails from various US government agencies.
Activity
No significant activity to report this week.
Dividends
Dividends Received this week for the following companies:
Companies followed by DRIP (Dividend Re-Investment Plan) indicate additional shares were purchased with the dividend. Any cash leftover was added to the cash balance.
No dividends this past week.
Quarterly Reports
Kneat.com
See report under Portfolio 1.
Take-Two Interactive Software, Inc.
All currency listed in millions of US dollars, except for per share data.
Revenue of $71,666,414 for the three months ended June 30, compared to $62,518,245 for the same period in 2022. An increase of almost 44%.
Net income of $2,112,548 for the three months ended June 30, compared to net income of $7,363,953 in the same period in 2022.
Diluted earnings per ordinary share of $0.08 for the three months ended June 30, compared to earnings of $0.28 per share for the same period in 2022.
Revenue of $160,088,048 for the six months ended June 30, compared to $125,787,066 for the same period in 2022. An increase of over 27%.
Net earnings of $11,609,041 for the six months ended June 30, compared to net earnings of $13,665,807 in the same period in 2022.
Diluted earnings per ordinary share of $0.45 for the six months ended June 30, compared to earnings of $0.52 per share for the same period in 2022.
Portfolio 3
Portfolio 3 for the week ended August 11, 2023: DOWN
Magnite (NASD: MGNI) has partnered with private company Attain to provide video ad buyers with measurement capabilities based on Attain’s live data.
In 2020, Shopify (TSX: SHOP) pre purchased carbon removal credits from climate start-up Running Tide. This past week Shopify finally received those credits. To remove carbon, Running Tide took 1,000 metric tons of waste wood that was scheduled to be burned, coated it with limestone and placed it on the ocean floor, 306 kilometres south of Iceland. By coating the wood with limestone, it will minimize ocean acidification from the decomposing wood. The result was the removal of 275 metric tones of carbon dioxide. Thumbs up to all parties.
Activity
No significant activity to report this week.
Dividends
Dividends Received this week for the following companies:
Companies followed by DRIP (Dividend Re-Investment Plan) indicate additional shares were purchased with the dividend. Any cash leftover was added to the cash balance.
No dividends this past week.
Quarterly Reports
GDI Integrated Facility Services Inc.
See report under Portfolio 1.
SmartCentres Real Estate Investment Trust
All currency listed in thousands of Canadian dollars, except for per share data.
Canadian Economic news, US employment news, US credit rating surprise …
Over the last 30 years, August and September have been the worst two months for the markets, according to Bloomberg News. Will August be a reality check after the bullish June and July or more room for the bulls to run? Based on this past week, so far it seems to be a reality check. Let us hope this week was just a pothole on the upward path the markets have been on for the last few months.
Canadian Economic news
In an unexpected turn, Canada’s July Labour Force Survey revealed a decrease of 6,400 jobs, a stark contrast to the anticipated gain of 21,100 jobs for the same month. The most significant decline in employment was observed among men aged 25 to 54 years old. Conversely, employment figures saw an increase for young men aged 15 to 24 years.
Correspondingly, the unemployment rate experienced a 0.1 percentage point rise to 5.5%, marking the first instance of unemployment increase since the pandemic’s onset. Notably, most of the uptick in the unemployment rate was driven by women, whereas men experienced little change.
On an annual basis, the average hourly wages registered a 5.0% gain in July. This follows prior incremental gains of 4.2% in June and 5.1% in May. While wage growth continues to surpass the Bank of Canada’s (BoC) preferences, it is worth noting that wage trends tend to trail behind labor market movements.
With the job market displaying signs of slowing down and unemployment rates on the rise, it appears that the BoC’s endeavors to temper the economy’s pace are yielding results, resulting in an economic slowdown. This latest dataset strengthens the indication that the BoC will likely maintain the benchmark rate at 5% during its upcoming announcement on September 6th.
US employment news
At the start of the week, the Labor Department released its June Job Openings and Labor Turnover Survey (JOLTS) report, revealing a significant decrease in job openings to their lowest point in over two years. The count of job openings contracted by 34,000, settling at a total of 9.582 million. This figure is below May’s 9.824 million job openings and falls short of analysts’ projections, which had forecasted 9.630 million job openings for the same period.
Meanwhile, the ADP National Employment report indicated that private payrolls experienced a rise of 324,000 jobs in July. Although this number is below June’s addition of 455,000 jobs, it still surpasses the anticipated 189,000 jobs for July. This data suggests that the labour market is undergoing a phase of moderation while retaining its strength. In conjunction with the job increases, ADP’s report showed a 6.2% annual increase in wages. This represents a slight deceleration from June’s 6.4% growth.
Finally, at the end of the week, the Labor Department released its Employment Summary for July. The report outlined that non-farm payrolls added 187,000 jobs, trailing June’s robust addition of 209,000 jobs. Analysts’ expectations had centered around a gain of 200,000 jobs. Furthermore, the unemployment rate decreased to 3.5%, down from June’s 3.6%. Analysts had forecast the unemployment rate to remain at 3.6%. The report also showed a 0.4% monthly upswing in average hourly earnings, leading to a 4.4% annual increase. While this is great for employees, the annual wage growth now surpasses inflation. This suggests that consumers are likely to retain their purchasing power, potentially contributing to maintaining inflation levels above the Federal Reserve’s (Fed) 2% target.
These employment reports reinforce the perception that the economy is headed toward the Federal Reserve’s (Fed) sought-after “soft landing” rather than a recession. However, the data still points toward a tight labour market, which could prompt the Fed to maintain higher interest rates for a prolonged period. A “soft landing” refers to a controlled and gradual easing of economic activity, often coupled with a reduction in inflation, without incurring major disruptions or adverse impacts on employment and overall economic stability.
US credit rating surprise
Fitch Group, one of the three major credit rating agencies, downgraded the US’s credit rating from the top AAA rating to AA+ on Tuesday. The downgrade was due to growing US deficits and political dysfunction. Fitch cited the recent last-minute US debt ceiling negotiations that threatened the government’s ability to pay its bills, and the likelihood that brinkmanship would reoccur, as the financial concerns. The political instability the Fitch group referred to has be the political divide that currently exists in the US.
The US government strongly disagreed with the assessment, calling it “arbitrary and based on outdated data.” It does seem odd that the US would be downgraded while its economy is growing, however, the government is spending a lot of money and the constant political squabbles are unlikely to end any time soon.
With the downgrade, Fitch joins Standard & Poor’s who previously dropped the US government from the AAA rating in 2011. The downgrade puts the US at a level with Great Britain and Japan, but below Canada, Australia, Singapore, and a few western European countries.
After the gains of the last two months, August has started out like its determined to end the market’s summer hot streak. Let’s see what happened this past week to throw cold water on the markets ….
Weekly Market Review
Monday: Once again the markets got off to a good start with all four major North American indexes advancing. Investors are preparing for earnings reports from two more of the mega cap technology companies report, as well as many other well-known companies. Falling inflation and economic resilience in Canada and the US have improved investor optimism. Oil continued to rise as global supplies get tighter.
In Canada, the Toronto Stock Exchange Composite Index (TSX) edged higher as commodity prices rose on hopes the economy will avoid a recession. With commodity prices up, the Basic Materials (miners and fertilizer manufacturers) led all Canadian sectors, followed by the Technology sector. Telecommunications Services, Industrials and Utilities were the only sector to lose ground.
In the US, the S&P 500 Index (S&P), the Dow Jones Industrial Average (DJIA), and the Nasdaq Composite Index (Nasdaq) all posted monthly gains. The S&P 500 posted its fifth-straight monthly gain, its best streak since 2021. In trading, Energy and Basic Materials were the top American sectors, while Telecommunications Services, Consumer Staples and Healthcare were the only sectors to drop.
Tuesday: The markets stumbled today, with the DJIA the only index to gain ground. Mixed results from several large US companies and investors taking profits after a bullish July were the main drivers of the markets.
In Canada, concerns about China’s sputtering economy led to worries about demand for raw materials, sending the TSX lower. In the Canadian sectors, Industrials and Energy led the gainers, while Basic Materials and Utilities had the biggest drops.
In the US, second quarter earnings results continue to come in, but they have been unable to set a direction for the markets. Some big-name companies beat expectations, some meet expectations, and some miss. In the markets, Industrials was the only American sector to end in the green, while Basic Materials and Utilities were the deepest in the red.
Wednesday: All four indexes dropped sharply after private payrolls increased more than expected and the US unexpectedly received a downgrade in their credit rating from AAA to AA+ by one of the top three global credit rating agencies, the Fitch Group. Investors immediately unloaded stocks and moved into safer, more stable government bonds and cash, sending the stock markets lower.
In Canada, the TSX ended lower on the news out of the US and lower oil prices. All Canadian sectors declined today. Consumer Staples and Healthcare fell the least and Technology and Basic Materials fell the hardest.
In the USA, investors did not need to be told twice to take profits after the credit rating cut. It was a day of broad-based declines in the American sectors with Consumer Staples and Utilities falling the least and Technology and Basic Materials dropped the most.
Thursday: The selloff that started yesterday resumed this morning before the indexes started clawing their way into positive territory, only to fall back into negative territory at the end of the day. Today, investors are waiting for the earnings reports from two of bigger technology darlings – Apple (NASD: AAPL) and Amazon (NASD: AMZN). Oil prices climbed higher on tighter supply.
In Canada, disappointing quarterly reports and underwhelming forecasts by a few big-name Canadian companies added to the downward pressure created by the downgrade of the US’s credit rating. On Bay Street, Energy and Healthcare were the only Canadian sectors to end in the green while Technology and Utilities sank the farthest into the red.
In the US, it was a bit of a rollercoaster ride for the American indexes but eventually the weight of Wednesday’s downgrade sunk all three indexes. In trading on Wall Street, Energy and Consumer Staples were the only American sectors to advance, while Utilities and Telecommunications Services suffered the biggest declines.
Friday: Its always nice when a company you own is the catalyst for a market rally. Today, Amazon was the catalyst. Its earnings report beat expectations and, more importantly, they were optimistic about the third quarter based on strong cloud sales and shopping trends. However, it was not enough to save the three American indexes from ending in the red. Oil prices rose on supply concerns pushing oil higher for the sixth week in a row.
In Canada, the TSX was the lone index to stay in the green all day, driven by a rotation away from interest rate sensitive technology companies into commodities sectors energy and basic materials. This bodes well for the commodities heavy TSX as we head into the back half of 2023. In trading in the Canadian sectors, Financials and utilities were the biggest winners, while Technology and Consumer Cyclicals had the biggest drops.
In the US, the American indexes were riding high on the latest jobs report indicated the labor market continued to cool down. However, a disappointing report from Apple and profit taking overcame the upward momentum of the Amazon report and the jobs news. The afternoon drop caused the Nasdaq and S&P to have their worst weekly declines since March. In trading, Consumer Cyclicals and Energy were the only sectors to end higher, while Technology and Utilities had the largest declines.
Weekly Market and Portfolio Review
For the week, the TSX (SPTSX) slipped 1.4%, the S&P 500 (SPX) lost 2.3%, the DJIA (INDU) declined 1.1% and the Nasdaq (CCMP) fell 2.8%.
As depicted in the graph above, the past week proved to be challenging for the four major North American stock indexes. Following a promising start to conclude July, the indexes dropped throughout the week. The primary driver behind this drop was the unforeseen credit rating downgrade of the US. Financial markets typically do not like surprises, and this instance was no different. Furthermore, a lacklustre earnings report and cautious outlook from Apple added to the uncertainty, prompting investors to question the potential for other unanticipated earnings disappointments. In contrast, the TSX managed to recuperate some lost ground, primarily driven by gains in the energy and commodity sectors.
I was hoping the portfolios would build on the upward momentum from July, but it was not to be. As illustrated in the chart below, all three portfolios suffered sizable declines. Definitely not the way to start August. The retreat of the markets in general, the technology sector specifically, and investors taking profits after a strong bull run through June and July dragged all three portfolios lower. Hopefully next week will be better.
Weekly Portfolio & Index performance for the week ended August 4, 2023.
For the month, the TSX (SPTSX) gained 2.3%, the S&P 500 (SPX) rose 3.1%, the DJIA (INDU) advanced 3.3% and the Nasdaq (CCMP) increased 4.0%.
Fortunately, the performance of the indexes throughout July stood in stark contrast to the recent week’s downturn. As evident from the provided graph, the markets enjoyed another robust month, with each index recording gains. Notably, both the S&P and Nasdaq marked their fifth consecutive month of upward movement. The beginning of July was marked by concerns surrounding elevated interest rates in both Canada and the US, resulting in an initial dip. However, the indexes adeptly reversed these early declines. With the exception of minor fluctuations observed in the TSX and Nasdaq, the upward trajectory remained intact through the end of the month. Improved economic data gave investors a renewed sense of confidence, propelling all four indexes higher.
The bullish momentum observed throughout July provided a significant boost to all three portfolios. As indicated in the chart below, the technology heavy Nasdaq experienced a particularly successful month. Considering that all three portfolios are oriented to varying degrees on the technology sector, they were all able to ride the tailwinds that propelling this sector higher. Additionally, the uptick in oil prices and the expansion of the market rally beyond the technology sector contributed to the positive performance of each portfolio. It would be great if the coming months could replicate and build upon the gains of July. 😊
Monthly Portfolio & Index performance for July, 2023.
Companies on the Radar
In the past week, the Radar List underwent shifts and adjustments, with two new entrants and two departing companies, but in differing directions. The choice between Cameco (TSX: CCO) and BWX Technologies (NYSE: BWXT), both well regarded in the nuclear energy sector, presented a decision point. Opting for a single nuclear energy company, I chose to add Cameco due to its higher potential for growth. Notably, Cameco’s trading value was below Morningstar’s fair market valuation, a key consideration that tipped the scales.
For the time being, I intend to remain on the sidelines unless a truly exceptional opportunity emerges. Nevertheless, I continue to monitor the markets for any potential investments, and during this period, two intriguing companies came onto my radar: OTC Markets Group Inc. (OTCM: OTCM) and Idexx Laboratories (NASD: IDXX).
OTC Markets Group Inc., a small-cap American company, that owns and operates the over-the-counter market trading system, often referred to as pink sheets. Interestingly, I had held shares of this company until 2021, when I decided to divest due to limited share price movement. It is somewhat disheartening to see the share price has surged by an impressive 65%.
Idexx Laboratories, a large-cap American firm, holds a prominent position within the animal industry. Serving veterinarians with a spectrum of products and tests for pets and livestock, Idexx is one of the industry’s top dogs 😊. If you own a pet and have ever taken it to the vet, this company’s products have likely played a role in the veterinary care your pet received.
As I conducted my Quick Test on OTCM, I encountered a lack of available information on the company. The absence of data from reputable sources such as Morningstar and Thomson-Reuters, as you can see in the second chart below, led me to a decision to move forward without further exploration of OTCM.
Regarding IDXX, while the company holds promise, the stock is considered overpriced, trading at a premium. This consideration prompted me to pass on IDXX, as it does not align with my valuation criteria.
Although neither of the companies passed the Quick Test, it is good to see that the Quick Test effectively fulfilled its intended purpose – efficiently filtering out companies that do not align with my investment strategy before committing valuable time to researching them. While this outcome might appear as a minor victory, it underscores the importance of this initial screening process in optimizing my investment research efforts.
The Radar Check was last updated August 4, 2023.
Portfolio Update
Portfolio 1
Portfolio 1 for the week ended August 4, 2023: DOWN
Nvidia (NASD: NVDA) is teaming its Drive and Omniverse platforms with Hesai Technology’s (NASD: HSAI) lidar sensors for projects in the autonomous driving space. Another revenue stream for Nvidia
Tesla (NASD: TSLA) is once again being investigated by National Highway Traffic Safety Administration (NHTSA). This time over reports of loss of steering control in 280,000 new Model 3 and Model Y electric vehicles (EV).
More bad news for Tesla, the company is the subject of a class action lawsuit in California. This time Tesla is accused of false advertising when it comes to the estimated driving range of their EV. Surprisingly, the advertised their cars went farther on a full charge than they actually did. 😊
Amazon is back into buying real estate after a year ago saying they had too many warehouses. This time they are looking for smaller properties to double the number of same-day delivery centers they own. The plan is for these smaller centres to carry the 100,000 most-popular items on Amazon. When a same day centre gets an order, the product is on its way within 11 minutes. Now that is fast.
In other Amazon news, the company is expanding its digital health care unit, Amazon Clinic, throughout the US to all 50 states.
Activity
Liberty Media’s Formula 1 tracking (NASD: FWONK) split off its Braves Holdings, LLC unit. The new public company, Atlanta Braves Holdings, owns and operates the Atlanta Braves major league baseball club, operates the team’s baseball stadium, and owns a mixed-use real estate development project. The new company trades under the ticker (NASD: BATRK).
Bought:Cameco: Cameco is a major Canadian company that is one of the world’s largest uranium producers and global suppliers of uranium fuel and nuclear reactor components for clean energy production. As the global shift towards cleaner energy intensifies, nuclear power is emerging as a crucial energy source. Cameco stands out not only for its uranium mining operations but also for its leadership in uranium refining, conversion of fuel for light water and heavy water nuclear reactors, and the manufacturing and distribution of in-core reactor components for CANDU reactors worldwide. With a solid track record spanning over three decades, Cameco has been instrumental in generating electricity through nuclear reactors across the globe.
In contrast to the challenges posed by the intermittent nature of solar and wind energy, as well as the lengthy timeline for hydroelectric dam construction, nuclear energy emerges as a viable and reliable option. In fact, some nuclear reactors slated for closure have been extended, while new reactors have begun operations in both Canada and the US.
Cameco benefits from a stable senior management team with over a decade of experience in the uranium mining industry. The company’s positive corporate culture rating speaks to its conducive work environment. From a financial perspective, Cameco is performing well, with growth in sales, net income, and free cash flow. Debt remains manageable, and the controlled growth of outstanding shares is a positive sign. While the dividend is modest, at C$0.12 per year, it adds to the overall appeal.
Risks do exist, encompassing potential government regulations affecting the uranium sector, reactor-related challenges influencing shifts away from nuclear energy, opposition to nuclear power, and competition from other uranium producers.
A few years ago, I would not have ever thought about investing in a nuclear energy company. Then again, I never would have invested in oil companies. Now I am invested in both. 😊 I made a strategic investment decision to invest in Cameco because the world will need energy from nuclear reactors if emissions are to be reduced. As one of the top global suppliers of uranium and nuclear reactor components, it is well positioned to benefit from this tailwind. While the stock may not experience explosive growth like technology companies, I expect steady expansion as the demand for clean energy and its products increases over time.
I believe that Cameco is a well-positioned company with a bright future. I am confident in its long-term growth prospects and look forward to seeing the company and the share price grow.
Dividends
Dividends Received this week for the following companies:
Companies followed by DRIP (Dividend Re-Investment Plan) indicate additional shares were purchased with the dividend. Any cash leftover was added to the cash balance.
Canadian $
Toronto-Dominion Bank (TSX: TD) DRIP
Bank of Nova Scotia (TSX: BNS) DRIP
US $
No US$ dividends this past week.
Quarterly Reports
Lattice Semiconductor Corporation
All currency listed in thousands of US dollars, except for per share data.
Revenue of $4,946 for the three months ended June 30, compared to $4,401 for the same period in 2022. An increase of over 12%.
Net income of $196 for the three months ended June 30, compared to net income of $498 in the same period in 2022.
Diluted earnings per ordinary share of $0.14 for the three months ended June 30, compared to earnings of $0.34 per share for the same period in 2022.
Revenue of $9,910 for the six months ended June 30, compared to $8,683 for the same period in 2022. An increase of over 14%.
Net earnings of $420 for the six months ended June 30, compared to net earnings of $902 in the same period in 2022.
Diluted earnings per ordinary share of $0.29 for the six months ended June 30, compared to earnings of $0.62 per share for the same period in 2022.
Portfolio 2
Portfolio 2 for the week ended August 4, 2023: DOWN
Telus (TSX: T) announced they have become the official Canadian security breach response provider for consumer cybersecurity specialist Norton. Telus will provide services to companies that need assistance planning for and responding to security and data breaches.
Guardant Health (NASD: GH) came to an agreement with Illumina Inc. (NASD: ILMN), that resolved their pending litigation and promotes a shared resolution to advance both companies’ long-term interests. The two companies will share specimens to improve cancer research.
Last week TC Energy (TSX: TRP) declared a force majeure, or act of god, when an unforeseen incident along interstate 81 Virginia ruptured one of their pipelines, leading to a pressure loss. This past week TC Energy replaced the affected section and began re-pressurizing the pipeline. The impacted pipeline system will run with lower pressure and other risk mitigation measures, while the impacted pipeline segment will remain closed until it Is safe to re-open it.
Canadian Natural Resources Ltd (TSX: CNQ) said it expects the newly expanded Trans Mountain Expansion (TMX) pipeline to request Alberta oil producers to start filling the new pipeline as early as this month. CNQ plans to ship 94,000 barrels per day (bpd) through the pipeline. At full capacity, the TMX will be able to ship an additional 590,000 bpd. This is good for both parties and Canada.
Activity
No significant activity to report this week.
Dividends
Dividends Receivedthis week for the following companies:
Companies followed by DRIP (Dividend Re-Investment Plan) indicate additional shares were purchased with the dividend. Any cash leftover was added to the cash balance.
Canadian $
TC Energy Corp (TSX: TRP)
Bank of Nova Scotia (TSX: BNS)
US $
No US$ dividends this past week.
Quarterly Reports
Fortis Inc.
All currency listed in millions of Canadian dollars, except for per share data.
Revenue of $1,205 for the three months ended June 30, compared to $1,274 for the same period in 2022. A decrease of over 5%.
Net income of $151 for the three months ended June 30, compared to net income of $122 in the same period in 2022.
Diluted loss per ordinary share of $0.10 for the three months ended June 30, compared to a loss of $0.03 per share for the same period in 2022.
Revenue of $2,536 for the six months ended June 30, compared to $2,410 for the same period in 2022. An increase of over 5%.
Net earnings of $328 for the six months ended June 30, compared to net earnings of $155 in the same period in 2022.
Diluted loss per ordinary share of $0.20 for the six months ended June 30, compared to a loss of $0.19 per share for the same period in 2022.
Portfolio 3
Portfolio 3 for the week ended August 4, 2023: DOWN
Lithium Americas (TSX: LAC) shareholders approved the plan to divide the company into two lithium producing companies. One will operate in the North American market to take advantage of Canadian and US government programs. The other company will operate out of Argentina and will look for global opportunities.
Britain’s competition regulator, the Competition and Markets Authority (CMA), is investigating Cameco and Brookfield Renewable Partners’ (TSX: BEP.UN) $7.9 billion deal to acquire Westinghouse Electric, a nuclear power plant equipment maker. According to Cameco this is standard procedure for deals of this nature. Once the deal closes Cameco would own 49% of Westinghouse, with Brookfield and its partners controlling the rest.
Brookfield Asset Management (TSX: BAM) is teaming up with India’s Reliance Industries to investigate opportunities in Australia to manufacture renewable energy and decarbonisation equipment.
Activity
No significant activity to report this week.
Dividends
Dividends Received this week for the following companies:
Companies followed by DRIP (Dividend Re-Investment Plan) indicate additional shares were purchased with the dividend. Any cash leftover was added to the cash balance.
Canadian $
Toronto-Dominion Bank (TSX: TD)
US $
No US$ dividends this past week.
Quarterly Reports
Unity Software Inc.
See report under Portfolio 1.
Shopify Inc.
All currency listed in millions of US dollars, except for per share data.
Canadian Economic news, US Economic news, Central banks elsewhere, Electric vehicle charging gets a jolt, ….
Canadian Economic news
Bank of Canada meeting minutes
The minutes from the Bank of Canada’s (BoC) last meeting provided insights into their decision-making process regarding the latest increase to the benchmark interest rate. While there was consideration given to delaying a rate increase, the BoC ultimately decided that raising the rate was necessary to prevent inflation from stalling and continuing to trend downward. They were also prepared to implement further rate increases if deemed necessary.
The BoC was concerned about the ongoing strong demand in the economy and the high level of core inflation, which is measured by the core Consumer Price Index (CPI), which excludes the volatile food and fuel components from the overall CPI. To address this situation, the central bank decided to increase the interest rate, aiming to slow down demand and bring core inflation to a more manageable level.
The minutes revealed the BoC’s future decisions regarding interest rates will be based on an assessment of incoming economic data and the outlook for inflation.
Based on current projections and unless there are unforeseen events, analysts expect the BoC to maintain the benchmark rate at 5.0% for the remainder of the year, as inflation remains at the upper end of the BoC’s target range of 1% to 3%. However, they anticipate a rate cut sometime in the first quarter of 2024 as inflation is expected to moderate.
Gross Domestic product
According to the latest report on Gross Domestic Product (GDP) from Statistics Canada, the Canadian economy showed signs of growth in May. GDP increased by 0.3% during that month, following a 0.1% growth in April. On an annual basis, the GDP for May indicated a positive trend with a 1.9% increase.
In May, certain subsectors experienced notable rebounds. Wholesale trade and public administration subsectors saw significant growth, with the latter attributed to the return of government employees to work.
However, the oil and gas extraction (except oil sands) subsector faced challenges in May, experiencing a substantial decline of 6.6%. This drop was primarily a consequence of forest fires in Alberta, which led to the shutdown of many wells.
Despite the growth in May, early data for June suggests a decrease of 0.2% in real GDP, signaling a potential contraction in the economy for that month.
Looking ahead, analysts predict that the Canadian economy could continue to experience a back-and-forth pattern between growth and contraction for the remainder of 2023. This kind of oscillation may lead to slow overall growth during this period.
US Economic news
The good news is that the bear market that affected the S&P 500 in 2022 has been nearly erased, and investors continue to drive the markets higher. However, the Federal Reserve (Fed) remains concerned about inflation, a concern that has persisted since the start of the bear market.
The Fed raises the rate
In response to these inflation concerns, the Fed’s Federal Open Market Committee (FOMC) raised its benchmark overnight interest rate by 0.25% to the 5.25%-5.50% range. This marked the eleventh increase in the last twelve FOMC meetings and brought borrowing costs to their highest level since January 2001.
Equally significant were the comments made by Fed Chair Jerome Powell during the press conference that followed the FOMC meeting. Mr. Powell and the Fed members felt that the economy was still too strong, and the labor market needed to soften. He stated that reducing inflation would likely require a period of slower growth and some softening in labor market conditions. However, he also noted that future decisions on rate increases would be data dependent and made on a meeting-by-meeting basis, and the impact of rate hikes on the economy. He said no decision had been made regarding a rate increase at their next meeting in September but a rate cut is highly unlikely in 2023.
I hope that this latest rate increase will be the last for a while, even though the Fed continues to stress the importance of seeing inflation continue to decline. Tough talk from the central bank is essential to maintain control over inflationary pressures, as it signals their commitment to addressing the issue. If they were to ease their stance, it could risk reigniting inflationary pressures.
Economic news
The Gross Domestic Product (GDP) for the second quarter demonstrated a positive growth trajectory, increasing at an annualized pace of 2.4%, surpassing both the previous quarter’s 2.0% and analysts’ expectations of 1.8%. This indicates that the world’s largest economy continues to show resilience and strength, with the threat of a recession fading.
Additionally, there were promising signs in the job market, with the Department of Labor reporting the lowest number of jobless claims since February. Only 221,000 people filed jobless claims for the week ending July 22, reflecting a positive trend in the labor market.
On the inflation front, the Fed’s preferred measure, the Personal Consumption Expenditures (PCE) price index for June increased by 0.2%, up from the 0.1% rise in May. The Core PCE, which excludes volatile food and energy components, also rose by 0.2%. With PCE rising 3.0% and Core PCE rising 4.1% on an annual basis, these numbers indicate a slight rise in inflation. For core PCE, the rise was the lowest increase since September 2021.
However, there are some encouraging signs from consumer sentiment data. The University of Michigan’s final Consumer Sentiment Index (CSI) for July showed a reading of 71.6, slightly below the initial reading of 72.6 but still significantly higher than the readings from the previous month and the same period in 2022. Similarly, the Conference Board’s consumer confidence index reached its highest level in two years, with a reading of 117 in July, up from 110.1 in June. Consumers are feeling more optimistic, likely due to a combination of falling inflation and a robust labor market.
While the positive consumer sentiment is great news for economic growth, it also brings up concerns about the potential impact on inflation. If consumers continue to spend and inflation remains above the Fed’s 2% target, the possibility remains that the Fed could raise interest rates again to control inflation and bring it down to the desired level.
Overall, the data paints a positive picture of the American economy, with strong growth, an improving job market, and upbeat consumer sentiment. More data like this could bring an end to the Fed’s interest rate increases. 😊
Central banks elsewhere
In the event you thought the inflation fight was limited to Canada and the Unites States, here are the latest actions by other central banks:
The Reserve Bank of New Zealand raised its benchmark rate to 5.5% in May, the highest level in 14 years. The bank has been raising rates since October 2021, and analysts believe this is the end of their tightening cycle.
Australia’s central bank held its key rate at 4.1% in July, the highest level in 11 years. The bank is expected to continue raising rates in the coming months.
The European Central Bank (ECB) raised its benchmark rate by 0.25% to 3.75% in July, its highest level since 2000. The ECB is expected to raise rates again in September.
Great Britain’s Bank of England is expected to raise rates at its next meeting on August 3.
Norway’s Norges Bank raised its benchmark rate by 0.5% to 3.75% in June, a 15-year high. The bank is expected to raise rates again in August.
Sweden’s Riksbank boosted its interest rate by 0.25% to 3.75% in June and are expected to increase it by another 0.25% in September.
Switzerland’s Swiss National Bank boosted their key rate to by 0.25% to 1.75% in June. It was the fifth consecutive increase since June 2022 when it was -0.75%. Analysts are divided whether the central bank will increase or lower the rate by 0.25% at their next session in September.
Japan’s central bank, the Bank of Japan, kept its benchmark interest rate unchanged at -0.1% but announced it would let long term interest rates rise. For years Japan had kept its benchmark interest rate at extremely low levels to stimulate the Japanese economy.
As you can see, central banks around the world are taking aggressive action to lower inflation, but it remains to be seen whether they will be able to bring inflation under control. The global economy continues to face a number of challenges, including the war in Ukraine and supply chain disruptions, which could make it more difficult for central banks to bring inflation down.
Only time will tell whether the central banks’ efforts will be successful. However, they are committed to taking action to beat inflation and protect the global economy.
Electric vehicle charging gets a jolt
The competition in the electric vehicle (EV) charging network space is heating up as a consortium of major EV manufacturers, including BMW (OTCM: BMWYY), GM (NYSE: GM), Honda (NYSE: HMC), Hyundai and Kia (OTCM: HYMTF), Mercedes Benz (OTCM: MBGYY), and Stellantis (NYSE: STLA), have joined forces to create their own charging network. This consortium aims to build a massive network of fast chargers in Canada and the US, capitalizing on government subsidies.
Their ambitious plan is to deploy 30,000 fast chargers across both countries by 2030. They said they will provide charging options for both Tesla’s (NASD: TSLA) supercharger standard and the new North American standard charger. By doing so, they aim to provide greater accessibility and convenience for EV drivers, regardless of their vehicle brand.
This move would have a significant impact on the EV charging landscape, as it brings together major players in the automotive industry, pooling their resources and expertise. As the EV market continues to grow, having a robust and widely accessible charging network will be crucial to support the widespread adoption of electric vehicles and address the issue of range anxiety for potential buyers.
Tesla’s supercharger network has been a key advantage for the company, but with this new consortium’s efforts, there might be increased competition and pressure to improve charging infrastructure across the board. Ultimately, this development will benefit consumers by expanding charging options and promoting the transition to cleaner and more sustainable transportation.
After a busy week of economic data, let’s see what happened this past week….
Weekly Market Review
Monday: The start of a busy week for the North Americans markets ended on a positive note with all four indexes ending in the green. This week the Fed announces their latest decision on US interest rates and many of the big technology companies present their second quarter earnings.
In Canada, the Toronto Stock Exchange Composite Index (TSX) gained on higher oil prices as result of higher demand and tightening supplies. While not as exciting as earnings announcement from the big US technology companies, many big Canadian companies will report their second quarter results later this week. In trading, Energy and Consumer Cyclicals were the best Canadian sectors while Utilities and Telecommunications Services had the biggest declines.
In the US, the Dow Jones Industrial Average (DJIA) notched its eleventh straight positive day, its longest winning streak in six years. Meanwhile the S&P 500 Index (S&P) and the Nasdaq Composite Index (Nasdaq) got back into the win column as investors start to expand into other sectors besides technology. In trading, Energy and Financials were the big winners, while Healthcare and Utilities were the only sectors to end lower.
Tuesday: The three American indexes edged upward while the TSX edged slightly down as investors await the Fed’s decision on the US interest rate. Investors were also waiting for Alphabet’s (NASD: GOOGL) and Microsoft’s (NASD: MSFT) second quarter earnings reports that came out after the markets closed. It will be interesting to see how artificial intelligence (AI) impacts these companies top (sales) and bottom (earnings) lines and if it will offset slumps in their respective cloud businesses.
In Canada, an announcement by the Chinese government that would prop up their economy sent the share prices of many of Canada’s big mining companies higher. However, it was not enough to overcome a downdraft in the Canadian Financials sector. Accordingly, Basic Materials (mining companies and fertilizer manufacturers) was the best performing Canadian sector by a full percentage point, while Telecommunications Services and Financials were the worst performers.
In the US, the DJIA streak stands at twelve and the Nasdaq regained its swagger thanks to gains in Alphabet and Microsoft ahead of their earnings reports. In trading, Basic Materials and Technology were the top gainers, while Financials and Consumer Cyclicals experienced the biggest drops.
Wednesday: The markets yawned after the Fed did as expected, raising the US interest rate 0.25% to 5.5%, ending essentially flat. Investors were more focused on the post session comments indicating no decision had been made on an increase at the next session in September.
In Canada, the TSX ended slightly higher, powered by a rebound in the financial sector after yesterday’s drop. In trading, Healthcare and Industrials gained the most while Consumer Staples and Technology had the biggest declines.
In the US of A, the DJIA ran its streak to thirteen while the other two American indexes ended slightly lower. In trading, the Financials and Industrials sector posted the biggest gains, while Basic Materials and Energy had the biggest drops.
Thursday: The markets got off to a good start following yesterday’s optimistic news out of the Fed, but then fell with a thud as all indexes ended lower. The indexes fell when the latest US GDP came in higher than expected, raising concerns of another interest rate hike. Oil prices rose after growing optimism over increasing Chinese demand, coupled with production cuts by OPEC+ countries.
In Canada, the TSX suffered its biggest loss since early July on concerns the Fed would raise the US interest rate after strong US economic data. In trading on Bay Street, every sector ended lower. Consumer Staples and Financials dropped the least, while Telecommunications Services and Basic Materials had the biggest declines.
In the US, the DJIA’s winning streak came to an end at thirteen. It was the DJIA’s longest winning streak since 1987. In trading on Wall Street, every sector ended lower. The Technology and Consumer Staples sectors had the smallest decline while Utilities and Telecommunications Services fell the furthest.
Friday: The markets ended the week on a positive note that saw all indexes advance. The latest PCE data showed inflation falling, raising investors’ hopes this week’s interest rate hike was the last one. Investors believe the US economy is going through a ‘Goldilocks’ scenario of ebbing consumer prices and strong growth that is considered a healthy sign for stocks. Oil prices rose as analysts believe there will be a combination of strong demand and supply cuts to keep prices high.
In Canada, a strong day on the TSX almost pulled the index out of the red for the week but fell just short. In trading in the Canadian sectors, Technology and Basic Materials led all gainers, while Utilities and Consumer Staples were the only sectors to fall back.
In the US, all three American indexes rebounded after yesterday’s losses. Today’s gains for the Nasdaq enabled the Nasdaq to end the week in the green. With the possibility of a Goldilocks scenario, many investors are moving back into the stock markets and looking outside of the high-flying technology sector. In trading, the higher growth Consumer Cyclicals and Technology sectors advanced the most, while the defensive Utilities sector was the only sector to end in the red.
Weekly Market and Portfolio Review
For the week, the TSX (SPTSX) slipped 0.1%, the S&P 500 (SPX) grew 1.0%, the DJIA (INDU) advanced 0.7% and the Nasdaq (CCMP) jumped 2.0%.
As shown in the graph above, the four major North American indexes started the week headed in the right direction, but dipped midweek before rallying on Friday. Solid economic data out of the US, rising consumer sentiment, and renewed investor optimism lifted all four indexes. However, the TSX was the only index unable to end the week in positive territory. The TSX’s underperformance may be attributed to the possibility of another interest rate hike.
The performance of the Portfolios during the past week showed a mix of results, with two portfolios ending lower and one experiencing a positive outcome. As depicted in the chart below, the overall performance of the Portfolios was positive due to the strong showing from Portfolio 1, so I am giving the portfolios a bull for the past week. 😊 Portfolio 1 benefited from robust earnings in the technology sector.
Portfolio 2 faced challenges as Microsoft’s share price was negatively impacted by investor concerns regarding the costs associated with building up their AI infrastructure. Additionally, TC Energy’s (TSX: TRP) announcement about splitting out the liquids pipelines business likely added to the pressures on Portfolio 2.
Portfolio 3 came close to breaking even but was slightly impacted by the decline in Microsoft’s share price.
Weekly Portfolio & Index performance for the week ended July 28, 2023.
Companies on the Radar
This past week two small cap (when the number of shares X the market price of those shares is between $300 million and $2 billion) American semiconductor companies came to my attention. The first is indie semiconductor (NASD: INDI), a developer of semiconductors and software solutions for the growing electric vehicle (EV) market.
The other company is Navitas Semiconductor (NASD: NVTS), a developer of ultra-efficient gallium nitride (GaN) semiconductors. GaN chips provide significantly improved performance over conventional silicon semiconductors. GAN chips allow developers “to create smaller, lighter, faster and greener power conversion and power management solutions” that can be used in a wide variety of growing markets including EVs, solar panels, data centres and others.
Both are small cap companies, so they have plenty of room to grow, plus they are in the hot semiconductor industry. They both sound promising, so I added both to Portfolio 1. 😊
The Radar Check was last updated July 28, 2023.
Portfolio Update
Portfolio 1
Portfolio 1 for the week ended July 28, 2023: UP
Despite increases in revenue and earnings, the share price of General Motors dipped when they announced their profit margins had fallen. As a result of the lower margins, GM plans to lower investment in new products and cut operating expenses to boost their profit margin.
GM announced a quarterly dividend of $0.09.
Alphabet’s second-quarter profit exceeded Wall Street expectations on steady demand for its cloud services, a rebound in advertising, and maintaining their dominant position in online search. Despite an initial stumble with the rollout of their AI products, Google Search was able to withstand competition from archrival Microsoft’s AI powered Bing. While Google has their own chips to handle the computing horsepower required for AI, they expect expenses to increase as they build out the necessary infrastructure (datacentres) to handle the demand for their AI services.
Not wanting to miss out on the AI boom, Amazon (NASD: AMZN) has quietly rolled out its own AI offerings in its Amazon Web Services unit. Amazon has thousands of its customers testing out its AI services, called Bedrock, and should be generally available “soon.”
Activity
Received interest on TD 1-year cashable GIC.
Boughtindie Semiconductor: An automotive semiconductor company that supplies chips to a wide range of vehicle manufacturers. They have positioned themselves well in the growing market for electric vehicles (EVs) and Advanced Driver Assistance Systems (ADAS), which are becoming increasingly important in the automotive industry. They claim one in four new vehicles includes at least one indie device, a testament to their strong presence in the market.
The company’s focus on improving and enhancing the driver and passenger experience through their chips further strengthens their position in the industry. Their founder-led corporate structure and positive culture rating on Glassdoor reflect a strong leadership and company culture, which can contribute to their growth and success.
While the financial numbers are not great now, significant increase in revenues from December 2021 to December 2022 shows promising growth potential. The fact that the losses are decreasing is also a positive sign, indicating that the company is making progress towards profitability.
As a small-cap company, indie Semiconductor does come with higher risks and volatility compared to larger, more established companies. Potential risks include ensuring a reliable supply to customers, maintaining the quality of their products, and facing competition from companies with greater financial resources.
I made an investment in indie Semiconductor because of the increasing demand for their products, which aligns with the tailwinds of the growing EV and ADAS markets. The fact that the four co-founders have a vested interest in the company’s success and have had success in their previous venture adds to my confidence. Overall, as long as indie Semiconductor continues to execute its growth strategies, the share price should follow suit. And I will a happy co-owner. 😊
BoughtNavitas Semiconductor: Another small-cap American company. This one specializes in development of gallium nitride (GaN) power semiconductors and silicon carbide (SiC) chips and devices. These innovative chips offer significant improvements in performance and energy efficiency compared to traditional silicon technologies, making them highly sought-after in various high-frequency and high-power applications.
The company’s GaN chips have already found applications in diverse industries such as mobile chargers, consumer electronics, data centers, solar energy, renewable power fields, and electric vehicles (EVs). As technology continues to progress, and manufacturing processes become more refined, GaN chips are expected to penetrate even more markets and emerge as strong competitors to conventional silicon chips.
Navitas Semiconductor is led by a team of four founders, and with insiders holding 35% of the shares, there is a clear alignment of interests with the company’s success. The founders and management’s extensive background in the semiconductor field and startups add credibility to the company’s potential for growth.
From a financial standpoint, Navitas has been demonstrating robust revenue growth and achieved profitability last year. Additionally, the fact that the company has no debt only enhances its positive outlook.
However, there are risks associated with investing in new technology companies. Some of these risks include the potential challenges in gaining widespread adoption of GaN chips in various industries, securing a reliable supply of gallium, the emergence of a superior competing technology, and the entry of larger competitors into the market.
I decided to invest in Navitas because of its an early mover advantage in the next-generation semiconductor field, strong founder-led management, and its involvement in rapidly growing industries. As with any small-cap company that offers higher rewards, there are higher risks and greater share price volatility.
Dividends
Dividends Received this week for the following companies:
Companies followed by DRIP (Dividend Re-Investment Plan) indicate additional shares were purchased with the dividend. Any cash leftover was added to the cash balance.
No dividends this past week.
Quarterly Reports
General Motors Company
All currency listed in millions of US dollars, except for per share data.
Revenue of $306.2 for the three months ended June 30, compared to $285.1 for the same period in 2022. An increase of over 7%.
Net income of $97.3 for the three months ended June 30, compared to net income of $92.1 in the same period in 2022.
Diluted earnings per ordinary share of $0.35 for the three months ended June 30, compared to earnings of $0.33 per share for the same period in 2022.
Revenue of $605.3 for the six months ended June 30, compared to $572.4 for the same period in 2022. An increase of almost 6%.
Net earnings of $186.3 for the six months ended June 30, compared to net earnings of $379.7 in the same period in 2022.
Diluted earnings per ordinary share of $0.67 for the six months ended June 30, compared to earnings of $1.28 per share for the same period in 2022.
Portfolio 2
Portfolio 2 for the week ended July 28, 2023: DOWN
TC Energy plans to sell its 40% share of Columbia Gas Transmission and Columbia Gulf Transmission pipelines for $3.95 billion to Global Infrastructure Partners (GIP). However, TC Energy will remain involved through a joint venture with GIP, operating the pipelines and sharing in the annual maintenance and system upgrades.
In other TC Energy news, the company plans to split into two companies. One company will deal with natural gas pipelines and power and energy solutions. The other company will focus on the liquids pipelines business. The split is expected to close at the end of 2024.
Telus’s (TSX: T) venture capital firm TELUS Pollinator Fund for Good announced it is making an investment into Dryad, a German startup that uses sensors for early wildfire detection. Dryad plans to deploy 120 million sensors throughout the world by 2030 to protect nearly 4 million hectares of forest The investment will help the startup further scale in Canada and the US.
Activity
No significant activity to report this week.
Dividends
Dividends Received this week for the following companies:
Companies followed by DRIP (Dividend Re-Investment Plan) indicate additional shares were purchased with the dividend. Any cash leftover was added to the cash balance.
Canadian $
Dream Industrial Real Estate Investment Trust (TSX: DIR.UN) DRIP
US $
No US$ dividends this past week.
Quarterly Reports
Microsoft Corporation
All currency listed in millions of US dollars, except for per share data.
Revenue of $3,830 for the three months ended June 30, compared to $3,637 for the same period in 2022. An increase of over 5%.
Net income of $250 for the three months ended June 30, compared to net income of $889 in the same period in 2022.
Diluted earnings per ordinary share of $0.24 for the three months ended June 30, compared to earnings of $0.90 per share for the same period in 2022.
Revenue of $7,758 for the six months ended June 30, compared to $7,137 for the same period in 2022. An increase of almost 9%.
Net earnings of $1,563 for the six months ended June 30, compared to net earnings of $1,247 in the same period in 2022.
Diluted earnings per ordinary share of $1.53 for the six months ended June 30, compared to earnings of $1.27 per share for the same period in 2022.
Portfolio 3
Portfolio 3 for the week ended July 28, 2023: DOWN
Microsoft beat second quarter expectations, thanks to growth in its Azure cloud unit. Azure is the most likely part of Microsoft to capitalize on the soaring interest in AI. Despite beating expectations, the share price fell as investors were concerned about the amount of money being spent on AI and the infrastructure to support AI (datacentres).
Activity
No significant activity to report this week.
Dividends
Dividends Received this week for the following companies:
Companies followed by DRIP (Dividend Re-Investment Plan) indicate additional shares were purchased with the dividend. Any cash leftover was added to the cash balance.
No dividends this past week.
Quarterly Reports
Microsoft Corporation
All currency listed in millions of US dollars, except for per share data.
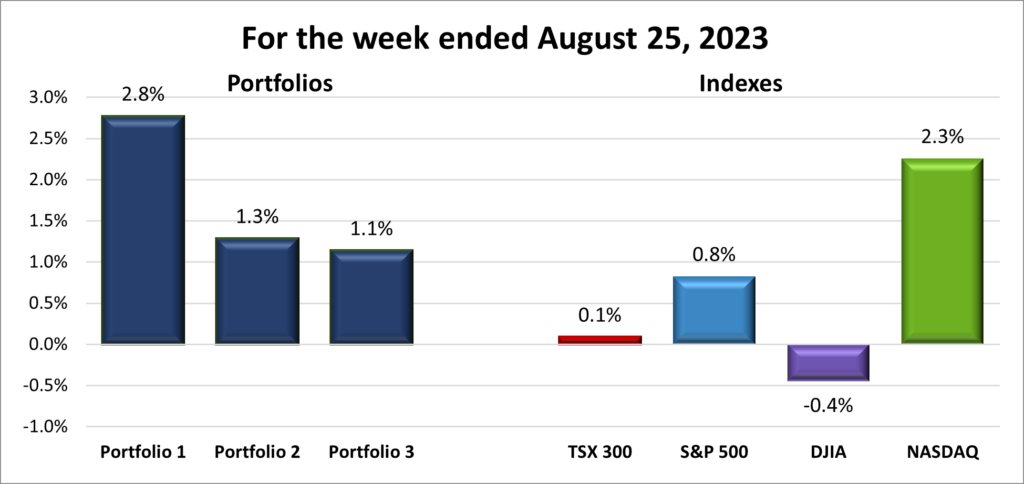
 Medpace Holdings, Inc. (NASD: MEDP) and Snowflake, Inc. (NYSE: SNOW) have been dropped from the Radar List, but not forgotten. 😊